General Sense event settings
Butler SOS can act as a reciever of Qlik Sense events, sent as UDP messages from Qlik Sense Enterprise.
This section of the config file contains general settings for how Butler SOS should handle these events.
More specific settings for each event type (user, log, …) can be found in the respective sections of the config file.
What’s this?
Butler SOS can receive events from Qlik Sense Enterprise, sent as UDP messages.
Two kinds of events are supported: User events and log events.
- User events are events that are generated when a user interacts with Qlik Sense, for example logging into Sense or opening an app.
- Log events originate from the Sense logging framework itself, which is also responsible for logging things to Qlik Sense’s own log files.
Some aspects of these events are general in nature, i.e. shared between the different event types, and are configured in this section of the config file.
Counters for user and log events
If log and/or user events are enabled there is a risk that the number of events generated by a QSEoW cluster can be overwhelming.
To make it easier to understand the volume of events generated, Butler SOS can be configured to count the number of events generated by the Sense cluster.
The counters are stored in InfluxDB and can be used to create dashboards in Grafana.
Each InfluxDB datapoint has tags and fields as described in the reference section.
Rejected events
Butler SOS can be configured to reject certain events even though the event is correctly formatted and contains valid data.
The need to do this can arise if the Sense cluster generates a large number of events, and not all of them are relevant for the current monitoring use case.
For example, performance log events (event name qseow-qix-perf) will be emitted by Sense every 2 seconds during scheduled reloads.
There is rarely a need to store all these events in InfluxDB, so they can be filtered out (=rejected) by Butler SOS.
But they can also be seen as valid and stored in InfluxDB, depending on the use case.
Rejected events are counted and the counters stored in InfluxDB.
They can be used to understand how many events are rejected by Butler SOS, versus how many are received in total (see the section above).
The InfluxDB measurement name is defined in the config file, Butler-SOS.qlikSenseEvents.rejectedEventCount.influxdb.measurementName.
Each event type and name may have its own rejection settings, defined in the respective sections of the config file.
They may also store different tags and fields in InfluxDB.
The currently defined rejection settings are:
Performance log events
These events come from the Qlik associative engine (the “QIX engine”) an contain very detailed performance data about apps, app objects, charts, user selections in apps etc.
Counters for rejected performance log events are enabled via the Butler-SOS.logEvents.enginePerformanceMonitor.trackRejectedEvents.enable setting in the config file.
Once this data is in InfluxDB it can be used in Grafana dashboards, for example showing how long each app takes to open:
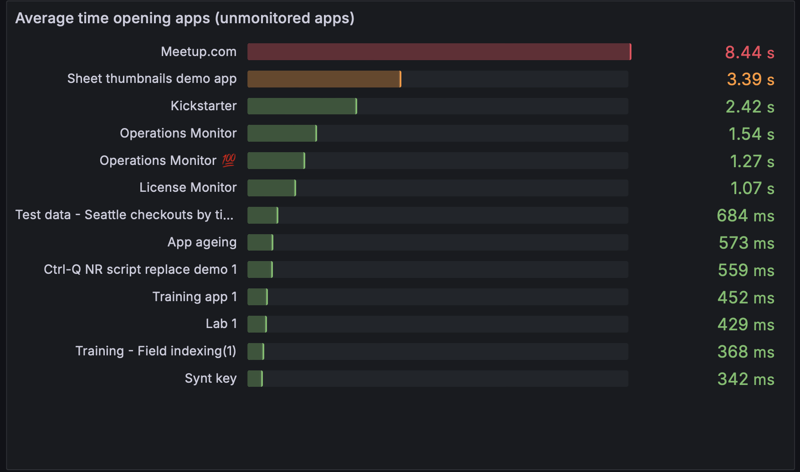
Average time to open Sense apps
The data stored in InfluxDB for performance log events is described here.
Settings in main config file
---
Butler-SOS:
  ...
  ...
  # Shared settings for user and log events (see below)
  qlikSenseEvents:                  # Shared settings for user and log events (see below)
    influxdb:
      enable: false                 # Should summary (counter) of user/log events, and rejected events be stored in InfluxDB?
      writeFrequency: 20000         # How often (milliseconds) should rejected event count be written to InfluxDB?
    eventCount:                     # Track how many events are received from Sense.
                                    # Some events are valid, some are not. Of the valid events, some are rejected by Butler SOS
                                    # based on the configuration in this file.
      enable: false                 # Should event count be stored in InfluxDB?
      influxdb:
        measurementName: event_count # Name of the InfluxDB measurement where event count is stored
        tags:                       # Tags are added to the data before it's stored in InfluxDB
          - name: env
            value: DEV
          - name: foo
            value: bar
    rejectedEventCount:             # Rejected events are events that are received from Sense, that are correctly formatted,
                                    # but that are rejected by Butler SOS based on the configuration in this file.
                                    # An example of a rejected event is a performance log event that is filtered out by Butler SOS.
      enable: false                 # Should rejected events be counted and stored in InfluxDB?
      influxdb:
        measurementName: rejected_event_count # Name of the InfluxDB measurement where rejected event count is stored
  ...
  ...
Log appender XML files
Sample log appender files are available in the ZIP file available from the download page, in subfolders engine/proxy/repository/scheduler of config/log_appender_xml/ folder.
Note that the log appender files contain slightly different information for each Sense service (engine/proxy/repository/scheduler)!
Also keep in mind that the log appender files must be called LocalLogConfig.xml and placed in these directories on the all Sense servers (assuming the detfault installation path of Qlik Sense):
C:\ProgramData\Qlik\Sense\EngineC:\ProgramData\Qlik\Sense\ProxyC:\ProgramData\Qlik\Sense\RepositoryC:\ProgramData\Qlik\Sense\Scheduler
Tip
If you have more than one Sense server you strictly speaking don’t have to deploy log appenders to all servers.
If you are only interested in receiving log events from some servers and/or services (engine, proxy, repository, scheduler) - deploy the log appender files there.