InfluxDB & Grafana
Warning
Butler SOS supports InfluxDB version 1.x and 2x.
InfluxDB v3.x is not yet supported.
If you already have InfluxDB and/or Grafana running you can skip this section.
Running in Docker using docker-compose
The easiest way to get started is to run these tools in Docker containers, controlled by docker-compose files.
Running them under Kubernetes will give you a whole other level of fault tolerance, scalability etc - but this also requires much more when it comes to Kubernetes skills. Use the setup that’s relevant to your use case.
You can use a single docker-compose file for Butler SOS, InfluxDB and Grafana - or separate docker-compose files for each tool.
The advantage of using a single docker-compose file is that the entire stack of tools will be launched in unison. You can create dependencies between the tools if needed etc - very convenient. On the other hand, having separate docker-compose files makes it easier to restart (or upgrade or in other ways change) a single service without affecting other services.
Full stack docker-compose file
Let’s start Butler SOS, InfluxDB and Grafana from a single docker-compose_fullstack_influxdb.yml file:
➜  butler-sos-docker cat docker-compose_fullstack_influxdb.yml
# docker-compose_fullstack_influxdb.yml
version: "3.3"
services:
    butler-sos:
        image: ptarmiganlabs/butler-sos:latest
        container_name: butler-sos
        restart: always
        volumes:
            # Make config file and log files accessible outside of container
            - "./config:/nodeapp/config"
            - "./log:/nodeapp/log"
        environment:
            - "NODE_ENV=production_influxdb" # Means that Butler SOS will read config data from production_influxdb.yaml
        logging:
            driver: "json-file"
            options:
                max-file: "5"
                max-size: "5m"
        networks:
            - senseops

    influxdb:
        image: influxdb:1.8.10
        container_name: influxdb
        restart: always
        volumes:
            - ./influxdb/data:/var/lib/influxdb # Mount for influxdb data directory
            - ./influxdb/config/:/etc/influxdb/ # Mount for influxdb configuration
        ports:
            # The API for InfluxDB is served on port 8086
            - "8086:8086"
            - "8082:8082"
        environment:
            # Disable usage reporting
            - "INFLUXDB_REPORTING_DISABLED=true"
        networks:
            - senseops

    grafana:
        image: grafana/grafana:latest
        container_name: grafana
        restart: always
        ports:
            - "3000:3000"
        volumes:
            - ./grafana/data:/var/lib/grafana
        networks:
            - senseops

networks:
    senseops:
        driver: bridge

➜  butler-sos-docker
Assuming you’ve already completed the setup of Butler SOS, the result of running the docker-compose_fullstack_influxdb.yml file above is something like this:
➜  butler-sos-docker docker-compose -f docker-compose_fullstack_influxdb.yml up
Creating network "butler-sos-docker_senseops" with driver "bridge"
Creating influxdb   ... done
Creating butler-sos ... done
Creating grafana    ... done
Attaching to butler-sos, grafana, influxdb
...
...
grafana       | logger=grafanaStorageLogger t=2022-08-21T18:13:42.76538465Z level=info msg="storage starting"
grafana       | logger=ngalert t=2022-08-21T18:13:42.780004463Z level=info msg="warming cache for startup"
grafana       | logger=http.server t=2022-08-21T18:13:42.796364325Z level=info msg="HTTP Server Listen" address=[::]:3000 protocol=http subUrl= socket=
grafana       | logger=ngalert.multiorg.alertmanager t=2022-08-21T18:13:42.807894344Z level=info msg="starting MultiOrg Alertmanager"
butler-sos    | 2022-08-21T18:13:42.908Z info: CONFIG: Influxdb enabled: true
butler-sos    | 2022-08-21T18:13:42.911Z info: CONFIG: Influxdb host IP: influxdb
butler-sos    | 2022-08-21T18:13:42.912Z info: CONFIG: Influxdb host port: 8086
butler-sos    | 2022-08-21T18:13:42.912Z info: CONFIG: Influxdb db name: senseops
influxdb      | ts=2022-08-21T18:13:43.139047Z lvl=info msg="Executing query" log_id=0cSPbmJG000 service=query query="SHOW DATABASES"
influxdb      | [httpd] 172.24.0.2 - - [21/Aug/2022:18:13:43 +0000] "GET /query?p=&q=show+databases&u= HTTP/1.1" 200 84 "-" "-" fd854ac5-217c-11ed-8001-0242ac180003 1084
influxdb      | ts=2022-08-21T18:13:43.169398Z lvl=info msg="Executing query" log_id=0cSPbmJG000 service=query query="CREATE DATABASE senseops"
influxdb      | [httpd] 172.24.0.2 - - [21/Aug/2022:18:13:43 +0000] "POST /query?p=&q=create+database+%22senseops%22&u= HTTP/1.1 " 200 33 "-" "-" fd89e529-217c-11ed-8002-0242ac180003 2940
butler-sos    | 2022-08-21T18:13:43.177Z info: CONFIG: Created new InfluxDB database: senseops
influxdb      | ts=2022-08-21T18:13:43.219945Z lvl=info msg="Executing query" log_id=0cSPbmJG000 service=query query="CREATE RETENTION POLICY \"10d\" ON senseops DURATION 10d REPLICATION 1 DEFAULT"
influxdb      | [httpd] 172.24.0.2 - - [21/Aug/2022:18:13:43 +0000] "POST /query?p=&q=create+retention+policy+%2210d%22+on+%22senseops%22+duration+10d+replication+1+default&u= HTTP/1.1 " 200 33 "-" "-" fd91ac84-217c-11ed-8003-0242ac180003 2299
butler-sos    | 2022-08-21T18:13:43.242Z info: CONFIG: Created new InfluxDB retention policy: 10d
butler-sos    | 2022-08-21T18:13:43.391Z info: --------------------------------------
butler-sos    | 2022-08-21T18:13:43.391Z info: Starting Butler SOS
butler-sos    | 2022-08-21T18:13:43.392Z info: Log level: verbose
butler-sos    | 2022-08-21T18:13:43.393Z info: App version: 9.2.0
butler-sos    | 2022-08-21T18:13:43.394Z info: Instance ID    : 964cbd0a36bc....
butler-sos    | 2022-08-21T18:13:43.394Z info:
butler-sos    | 2022-08-21T18:13:43.395Z info: Node version   : v18.7.0
butler-sos    | 2022-08-21T18:13:43.396Z info: Architecture   : x64
butler-sos    | 2022-08-21T18:13:43.396Z info: Platform       : linux
butler-sos    | 2022-08-21T18:13:43.396Z info: Release        : 11
butler-sos    | 2022-08-21T18:13:43.397Z info: Distro         : Debian GNU/Linux
butler-sos    | 2022-08-21T18:13:43.397Z info: Codename       : bullseye
butler-sos    | 2022-08-21T18:13:43.398Z info: Virtual        : false
butler-sos    | 2022-08-21T18:13:43.398Z info: Processors     : 4
butler-sos    | 2022-08-21T18:13:43.399Z info: Physical cores : 4
butler-sos    | 2022-08-21T18:13:43.399Z info: Cores          : 4
butler-sos    | 2022-08-21T18:13:43.400Z info: Docker arch.   : undefined
butler-sos    | 2022-08-21T18:13:43.400Z info: Total memory   : 6233055232
butler-sos    | 2022-08-21T18:13:43.401Z info: Standalone app : false
butler-sos    | 2022-08-21T18:13:43.401Z info: --------------------------------------
butler-sos    | 2022-08-21T18:13:43.402Z info: Client cert: /nodeapp/config/certificate/client.pem
butler-sos    | 2022-08-21T18:13:43.402Z info: Client cert key: /nodeapp/config/certificate/client_key.pem
butler-sos    | 2022-08-21T18:13:43.402Z info: CA cert: /nodeapp/config/certificate/root.pem
butler-sos    | 2022-08-21T18:13:43.421Z verbose: MAIN: Anonymous telemetry reporting has been set up.
butler-sos    | 2022-08-21T18:13:43.423Z verbose: MAIN: Starting Docker healthcheck server...
butler-sos    | 2022-08-21T18:13:43.428Z info: USER EVENT: UDP server listening on 0.0.0.0:9997
butler-sos    | 2022-08-21T18:13:43.429Z info: LOG EVENT: UDP server listening on 0.0.0.0:9996
butler-sos    | 2022-08-21T18:13:43.461Z info: MAIN: Started Docker healthcheck server on port 12398.
butler-sos    | 2022-08-21T18:13:43.462Z info: MAIN: Starting Prometheus Butler SOS endpoint on 0.0.0.0:9842.
butler-sos    | 2022-08-21T18:13:43.464Z verbose: PROM: Setting up Prometheus client for server: sense1
butler-sos    | 2022-08-21T18:13:43.465Z verbose: PROM: Setting up Prometheus client for server: sense2
butler-sos    | 2022-08-21T18:13:43.482Z info: PROM: Prometheus Butler SOS metrics server now listening on port 9842
butler-sos    | 2022-08-21T18:13:43.483Z info: PROM: Prometheus Node.js metrics server now listening on port 0.0.0.0:9001
butler-sos    | 2022-08-21T18:13:45.080Z verbose: --------------------------------
butler-sos    | 2022-08-21T18:13:45.081Z verbose: Iteration # 1, Uptime: 0 months, 0 days, 0 hours, 0 minutes, 2.007 seconds, Heap used 31.56 MB of total heap 60.81 MB. External (off-heap): 2.98 MB. Memory allocated to process: 102.28 MB.
influxdb      | [httpd] 172.24.0.2 - - [21/Aug/2022:18:13:45 +0000] "POST /write?db=senseops&p=&precision=n&rp=&u= HTTP/1.1 " 204 0 "-" "-" feaf181f-217c-11ed-8004-0242ac180003 44267
butler-sos    | 2022-08-21T18:13:45.137Z verbose: MEMORY USAGE INFLUXDB: Sent Butler SOS memory usage data to InfluxDB
butler-sos    | 2022-08-21T18:13:45.198Z verbose: UPTIME NEW RELIC: Sent Butler SOS memory usage data to New Relic account 123456789 ("Ptarmigan Labs NR account")
...
...
From a separate shell we can then ensure that the expected Docker containers are running:
➜  ~ docker ps
CONTAINER ID   IMAGE                             COMMAND                  CREATED              STATUS                        PORTS                                            NAMES
2311d17d1285   ptarmiganlabs/butler-sos:latest   "docker-entrypoint.s…"   About a minute ago   Up About a minute (healthy)                                                    butler-sos
a22307d12263   influxdb:1.8.10                   "/entrypoint.sh infl…"   About a minute ago   Up About a minute             0.0.0.0:8082->8082/tcp, 0.0.0.0:8086->8086/tcp   influxdb
81df665545d0   grafana/grafana:latest            "/run.sh"                About a minute ago   Up About a minute             0.0.0.0:3000->3000/tcp                           grafana
➜  ~
That’s great, we now have a single command (docker-compose -f docker-compose_fullstack_influxdb.yml up -d for background/daemon mode) to bring up all the tools needed to monitor a Qlik Sense cluster!
Now, let’s see if any data has arrived in InfluxDB.
Let’s check this by going into Grafana, which is available on port 3000.
First time logging into a new Grafana instance you can use the default admin account (username=admin, password=admin).
You will be asked to change that password during first login.
First add a data source in Grafana, pointing it to the local InfluxDB server.
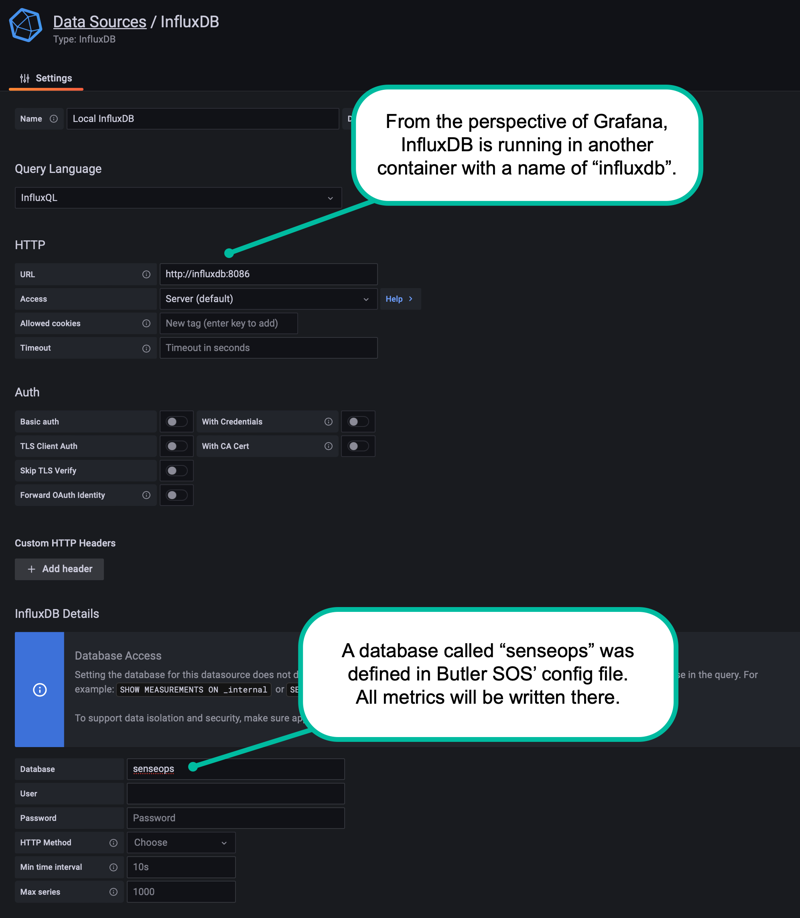
Adding an InfluxDB data source in Grafana
Now we can create a basic chart in Grafana, showing for example Butler SOS’ own memory usage.
After a while we should see some data in the chart:
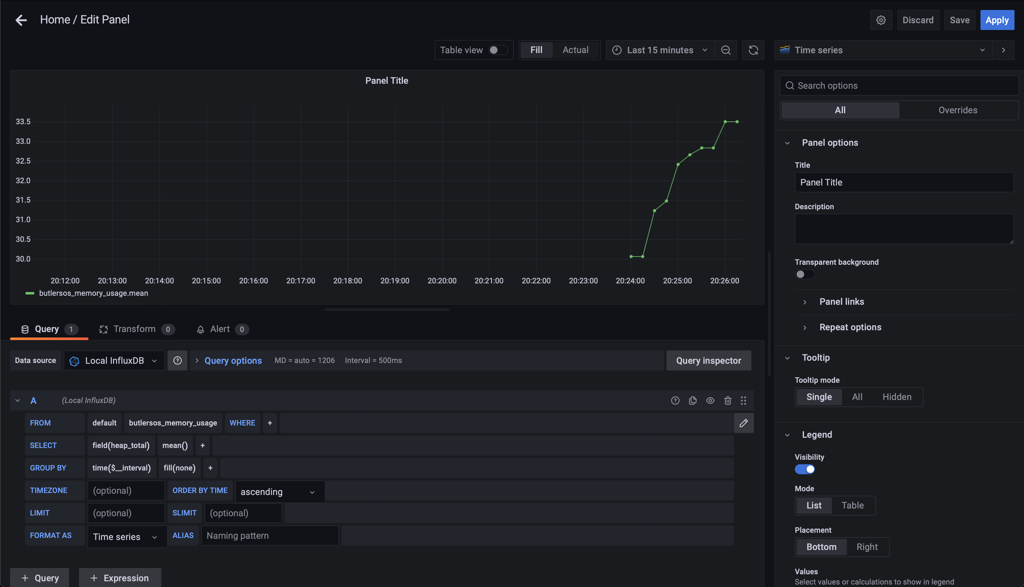
Butler SOS' own memory usage, stored in InfluxDB and visualized in Grafana
Need to stop the entire stack of tools?
Easy - just run docker-compose -f docker-compose_fullstack_influxdb.yml down:
➜  butler-sos-docker docker-compose -f docker-compose_fullstack_influxdb.yml down
Stopping butler-sos ... done
Stopping influxdb   ... done
Stopping grafana    ... done
Removing butler-sos ... done
Removing influxdb   ... done
Removing grafana    ... done
Removing network butler-sos-docker_senseops
➜  butler-sos-docker
➜