Monitoring Butler SOS
Options for monitoring Butler SOS itself.
Monitoring Butler SOS
Once Butler SOS is running it’s a good idea to also monitor it. Otherwise you stand the risk of not getting notified if Butler SOS for some reason misbehaves.
Butler SOS will log data on its memory usage to InfluxDB if
- The config file’s
Butler-SOS.uptimeMonitor.enableandButler.uptimeMonitor.storeInInfluxdb.butlerSOSMemoryUsageproperties are both set totrue. - The remaining InfluxDB properties of the config file are correctly configured.
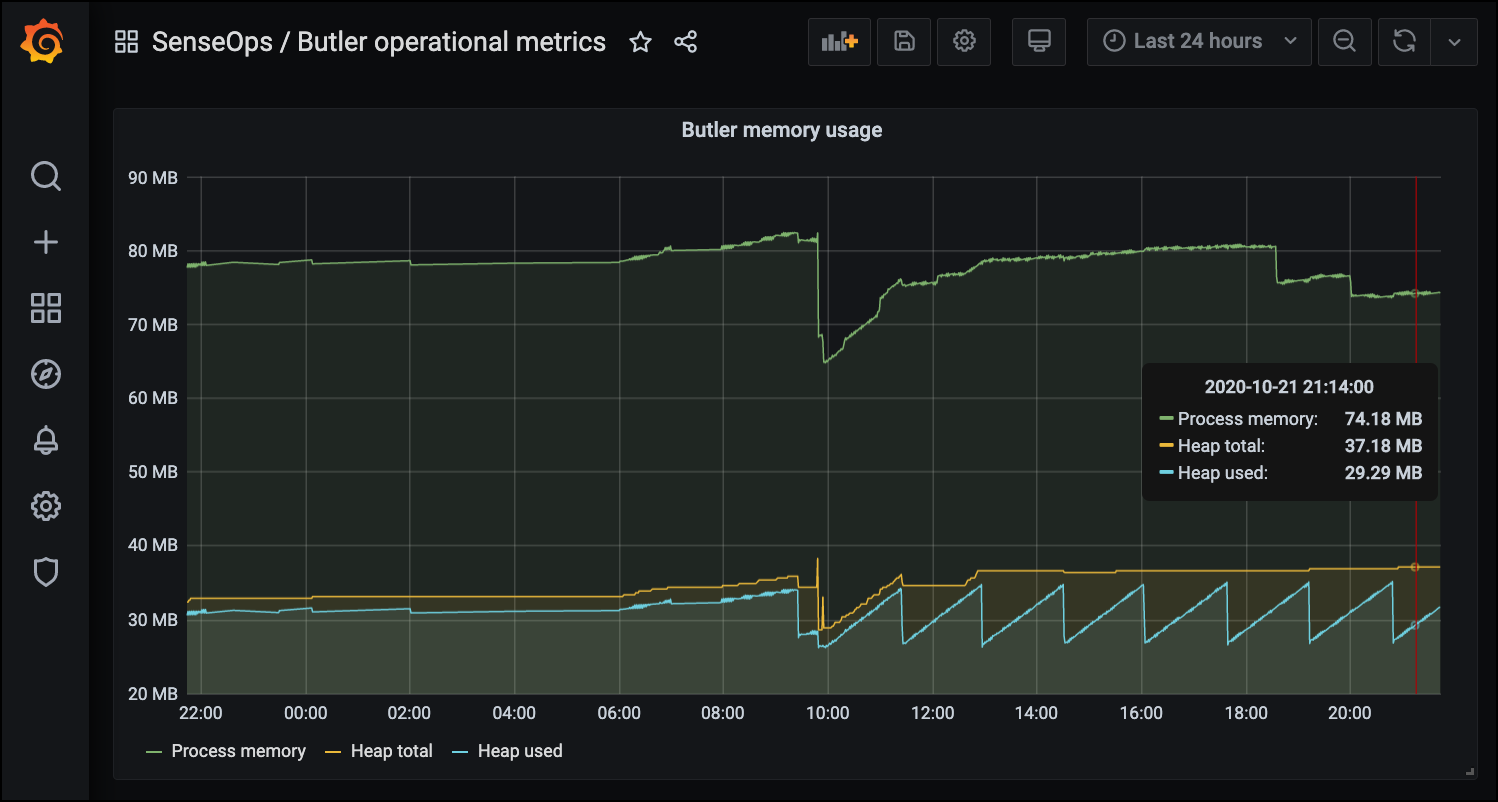
Assuming everything is correctly set up, you can then create a Grafana dashboard showing Butler SOS’ memory use over time.
You can also set up alerts in Grafana with notifications going to most popular IM tools and email.
A Grafana dashboard can look like this. This particular chart is for the Butler tool, but the concept for Butler SOS is the same.

There is a sample Grafana dashboard in Butler SOS’ GitHub repo.