Engine Performance Log Events
Caution Required
Due to the risk of overwhelming the InfluxDB database with a large number of performance log events, this feature is disabled by default in the sample config file.
If you want to use this feature, you must enable it first.
It's also recommended to start small and gradually increase the number of performance log events captured, to make sure the InfluxDB database can handle the load.
For example, start by capturing only a few specific types of objects types, methods etc for a limited set of apps, and then gradually increase/customize from there if needed.
What's This?
"Performance log events" are regular log events generated by the Qlik Sense engine service.
They get a special name in Butler SOS because they contain detailed performance data about the engine's operations, something that can be very useful when monitoring the performance of the Qlik Sense engine.
These events make it possible to monitor how the engine is performing in close to real time.
Butler SOS can capture all or some of these events and store them in InfluxDB, where they can be used to create dashboards in Grafana - just like any other events or metrics captured by Butler SOS.
How It Works
Once a log event has been identified as a performance log event (by looking at the event name, which is qseow-qix-perf in this case), Butler SOS will extract the data of interest from the event.
The data is then checked against a set of rules/filters to determine if the event should be stored in full detail in InfluxDB (=accepted) or not (=rejected).
For rejected events, a counter is incremented to keep track of how many events have been rejected.
The counters are written to InfluxDB at regular intervals, controlled by the Butler-SOS.qlikSenseEvents.influxdb.writeFrequency setting in the config file.
Once the data has been accepted, it is immediately stored in InfluxDB with a set of tags and fields, as described below.
Filtering of Log Events
There are two kinds of filters that can be defined in the config file:
- Filters that apply to all apps
- App specific filters that apply to specific apps
An event will be accepted if it matches either or both of the above filter types.
If an event does not match either of the two filter types, it will be rejected.
Filters Applying to All Apps
Global filters are defined in the Butler-SOS.logEvents.enginePerformanceMonitor.monitorFilter.allApps section of the config file.
All references to config file settings below are relative to this section.
The all-app filter consists of several parts/subfilters:
- Apps for which events should be excluded, based on app ID and/or app name
- Object types to include/exclude
- Methods to include/exclude
An event must match all of the subfilters to be accepted by the all-app filter.
Enabling/Disabling
It is possible to enable/disable monitoring of all apps via the enable setting. If disabled no events will be accepted via the global all-apps filter type.
Excluding Apps
The appExclude[] array can be used to exclude specific apps from monitoring.
The effect is that events from all apps, except the apps listed in appExclude[], will be accepted (unless the event is rejected by some of the other all-app filters).
appExclude[] can contain zero or more objects, each with either an appId or an appName property, or both.
If both properties are present, both must match the event's data for it to be considered a match.
Filtering by Object Type
The objectType section can be used to filter events based on the object type of the event.
"Object types" are things like barchart, sheet, map, but also internal Sense objects like AppPropsList and appprops.
- If
objectType.allObjectTypesis set totrue, all object types are monitored, except those listed inallObjectTypesExclude[].someObjectTypesInclude[]is not used in this case.
- If
objectType.allObjectTypesis set tofalse, only the object types listed insomeObjectTypesInclude[]will result in events being accepted.allObjectTypesExclude[]is not used in this case.
Put differently: You can either start by including all object types and then specify which ones to exclude, or start with an empty list and add the object types you want to include.
Filtering by Method
"Methods" refer to the various operations that the Sense engine performs.
Examples include Global::OpenApp, Global::GetProgress, Doc::GetAppLayout, Doc::CreateSessionObject.
The concepts for filtering by method are the same as for filtering by object type (see above).
Filter Applying to Specific Apps
If the all-app filters are not useful (they may generate too much data, for example), it is possible to define app-specific filters in the Butler-SOS.logEvents.enginePerformanceMonitor.monitorFilter.appSpecific section of the config file.
All references to config file settings below are relative to this section.
App-specific filters are defined in the array app[].
It includes zero or more objects, each of which contains the following subfilters:
- Apps to include, based on app ID and/or app name.
- Object types to include/exclude
- App objects to include/exclude
- Methods to include/exclude
The concepts for including all (and then excluding some) or starting with an empty list and adding what you want to include are the same as for the all-app filters.
Enabling/Disabling
It is possible to enable/disable app specific monitoring via the enable setting. If disabled no events will be accepted via the app specific filter type.
Including Apps
The app[].include[] contains the app IDs and/or app names of the apps to include in the filter.
Example:
appSpecific:
  enable: true # Should app specific monitoring be done?
  app:
    - include: # What apps should be monitored?
        # If both appId and appName are specified, both must match
        - appId: d7cf16f9-6a95-462a-9ff1-a6d413326de4
        - appName: Budget 2025
        - appId: 6931136d-c234-4358-a40c-e37153aba7c9
          appName: Sales basket analysis
Filtering by Object Type
The objectType section can be used to filter events based on the object type of the event.
The concepts for filtering by object type are the same as for the all-app filters.
Filtering by App Object
The appObject section can be used to filter events based on the object ID of the app object that the event is related to.
This is useful if you want to monitor only specific objects within an app, for example certain charts or tables.
Getting the ID of an app object is a bit tricky, but for charts, tables and other UI elements it can be done in a few reasonably easy ways.
The below works for Qlik Sense 2024-May - your mileage may vary for other versions.
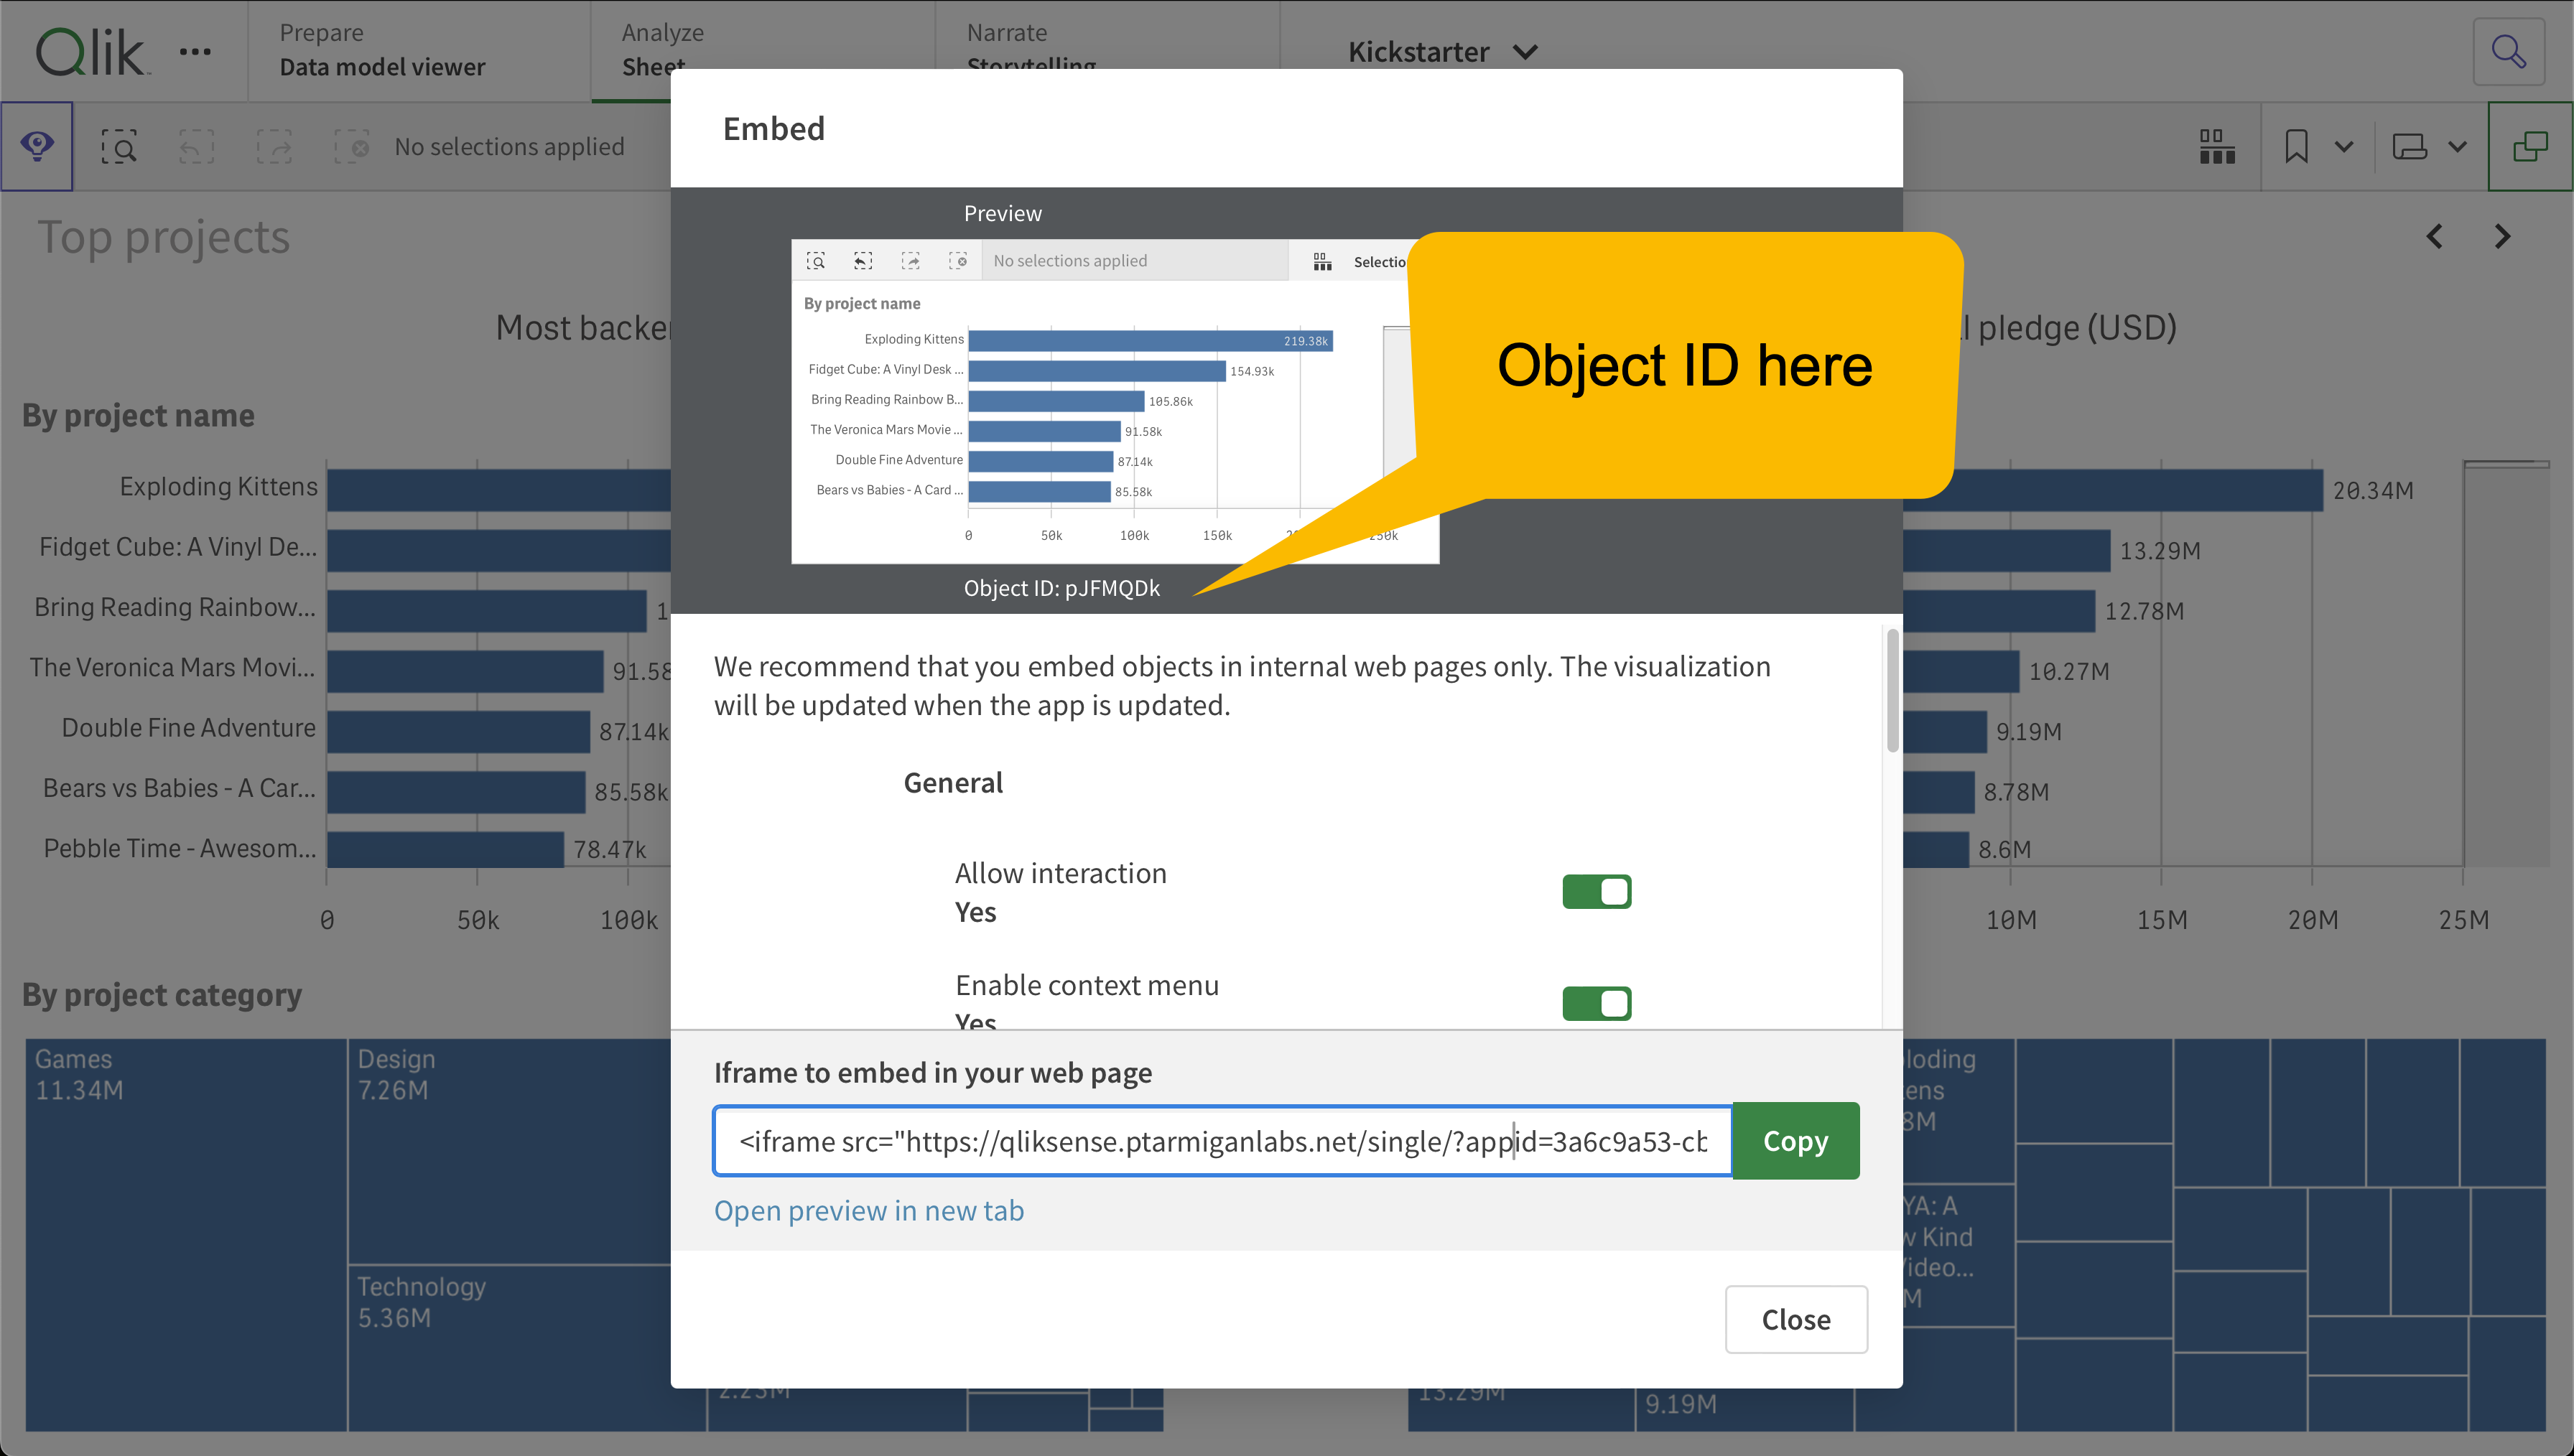
Share Object from Within App
- Open the app, then move to the sheet the chart is on.
- Right click the chart and select "Share". Click "Embed".
- The object ID is shown under the preview image of the chart. It is also available in the Iframe URL as the
objparameter.

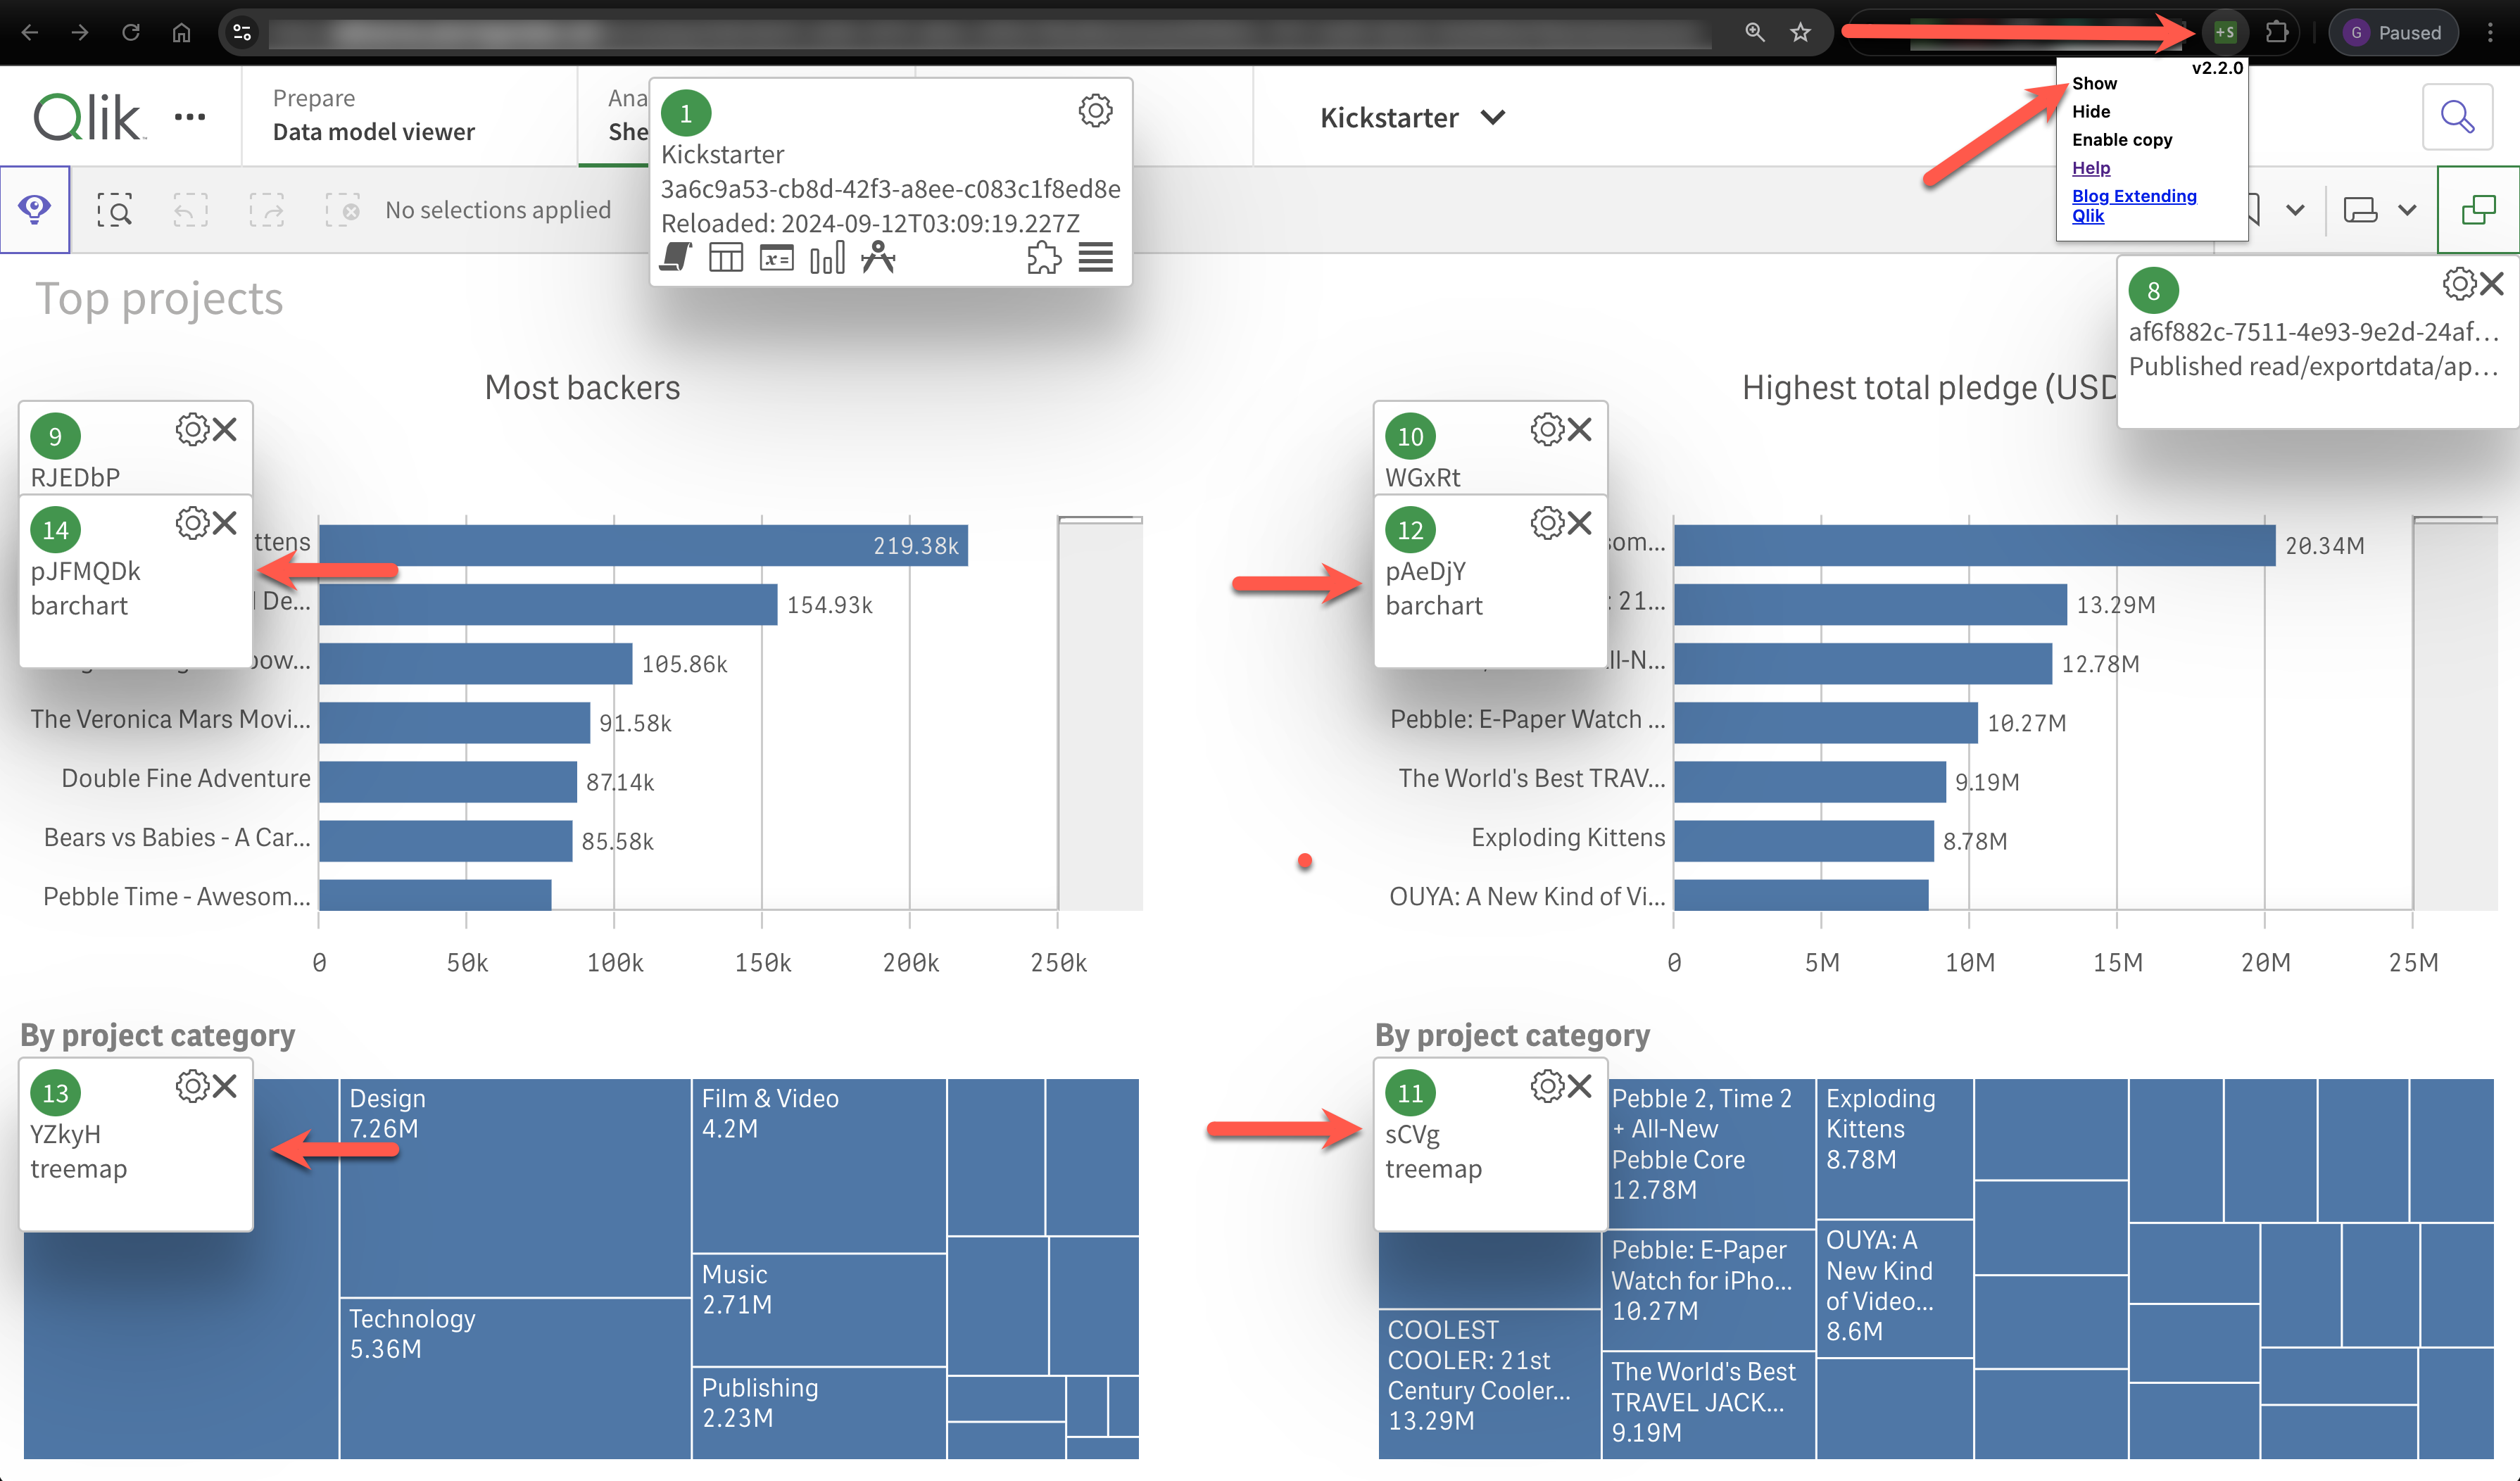
Use a Chrome Extension
This works if you are using Chrome and have the Add Sense extension installed.
- Open the app, then move to the sheet the chart is on.
- Click the Add Sense icon in the Chrome toolbar, then "Show" in the menu that appears.
- Popup windows will appear with information - including the object ID - about all UI objects on the sheet.

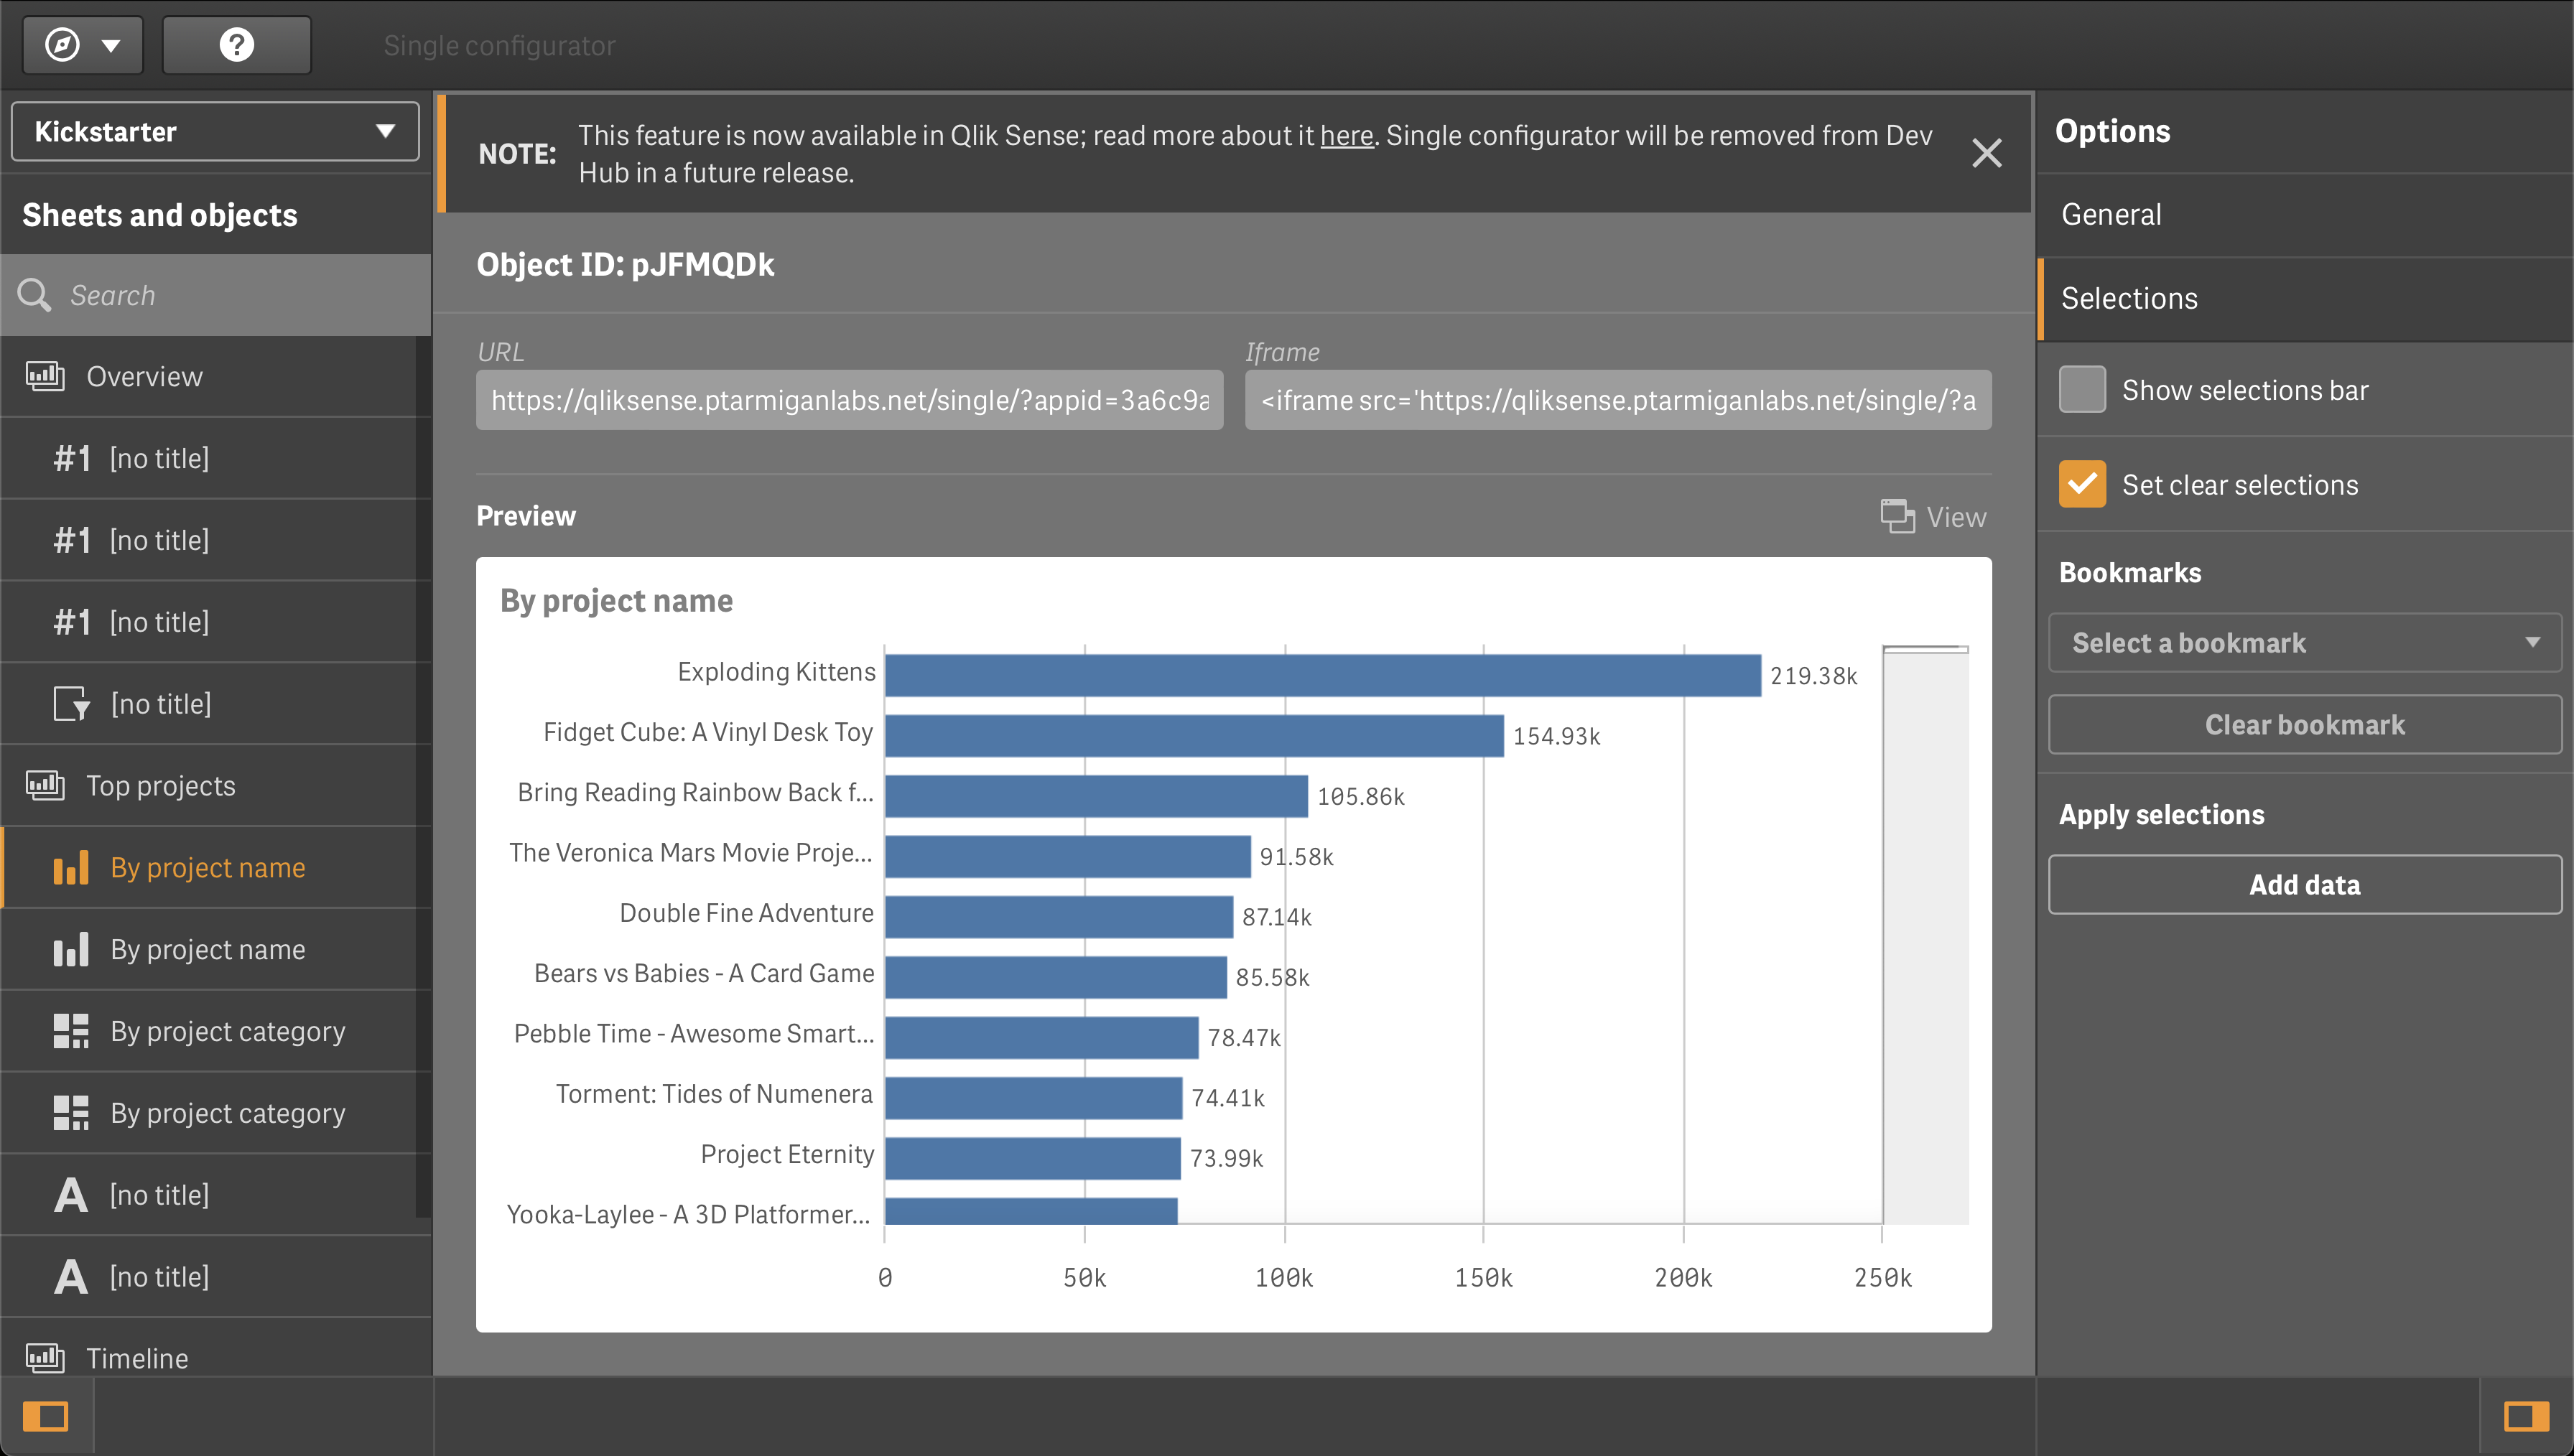
Use the "Single Configurator" in the Qlik Sense Dev Hub
While it is possible to get the object ID from the Dev Hub, it is not recommended as the Dev Hub will be removed in a future version of Qlik Sense.
Still, if you are using a version of Sense that has the Dev Hub, you can get the object ID like this:
- Open the Dev Hub, then the "Single configurator" tool.
- Select the app and the object you want to get the ID for in the drop-down to the left.
- Select the chart or table you are interested in. The object ID is found in the URL.

The concepts for filtering by app object are the same as for other filter types.
Filtering by Method
The method section can be used to filter events based on the method that generated the event.
The concepts for filtering by method are the same as for other filter types.
Metrics for Accepted Performance Log Events
The accepted performance log events stored in InfluxDB are described in the reference documentation.
Metrics for Rejected Performance Log Events
The rejected performance log events stored in InfluxDB are described in the reference documentation.
Settings in Config File
Template Config
The config snippet below comes from the production_template.yaml file.
Being a template, it contains examples on how configuration may be done - not necessarily how it should be done.
For example, the env/DEV and foo/bar tags are optional and can be changed to something else, or removed all together if not used.
Butler-SOS:
  ...
  ...
  # Log events are used to capture Sense warnings, errors and fatals in real time
  logEvents:
    ...
    ...
    enginePerformanceMonitor:           # Detailed app performance data extraction from log events
      enable: false                     # Should app performance data be extracted from log events?
      appNameLookup:                    # Should app names be looked up based on app IDs?
        enable: false
      trackRejectedEvents:
        enable: false                   # Should events that are rejected by the app performance monitor be tracked?
        tags:                           # Tags are added to the data before it's stored in InfluxDB
          # - name: env
          #   value: DEV
          # - name: foo
          #   value: bar
      monitorFilter:                    # What objects should be monitored?
        allApps:
          enable: false                 # Should all apps be monitored?
          appExclude:                   # What apps should be excluded from monitoring?
            # - appId: 5b817efe-472d-43ce-8a31-6cce34af7de9
            # - appName: Sales forecast
            # - appId: f42d6b16-8faf-45ca-a783-59f9da47db6e
            #   appName: Inventory analysis
          objectType:
            allObjectTypes: true        # Should all object types be monitored?
            allObjectTypesExclude:      # If allObjectTypes is set to true, these are excluded
              # - LoadModelList
              # - <Unknown>
              # - linechart
              # - map
            someObjectTypesInclude:     # What object types should be included?
              # - LoadModelList
              # - sheet
              # - barchart
          method:
            allMethods: true            # Should all methods be monitored?
            allMethodsExclude:          # If allMethods is set to true, these are excluded
              # - Global::OpenApp
              # - Doc::GetAppLayout
              # - Doc::CreateSessionObject
            someMethodsInclude:         # What methods should be included?
              # - GenericObject::GetLayout
              # - GenericObject::GetHyperCubeContinuousData
        appSpecific:
          enable: false                 # Should app specific monitoring be done?
          app:
            - include:                  # What apps should be monitored?
                # - appId: d7cf16f9-6a95-462a-9ff1-a6d413326de4
                # - appName: Budget 2025
                # - appId: 6931136d-c234-4358-a40c-e37153aba7c9
                #   appName: Sales basket analysis
              objectType:
                allObjectTypes: true
                allObjectTypesExclude:
                  # - table
                  # - map
                someObjectTypesInclude:
                  # - sheet
                  # - barchart
                  # - linechart
                  # - map
              appObject:
                allAppObjects: true     # Should all app objects be monitored?
                allAppObjectsExclude:   # If allAppObjects is set to true, these are excluded
                  # - objectId: AaBbCc
                  # - objectId: DdEeFf
                someAppObjectsInclude:  # What app objects should be included?
                  # - objectId: YJEpPT
              method:
                allMethods: true
                allMethodsExclude:
                  # - Global::OpenApp
                  # - Doc::GetAppLayout
                  # - Doc::CreateSessionObject
                someMethodsInclude:
                  # - GenericObject::GetLayout
                  # - GenericObject::GetHyperCubeContinuousData
  ...
  ...
Log Appender XML Files
Sample log appender files are available in the ZIP file available from the download page, in subfolders engine/proxy/repository/scheduler of config/log_appender_xml/ folder.
Note that the log appender files contain slightly different information for each Sense service (engine/proxy/repository/scheduler)!
Also keep in mind that the log appender files must be called LocalLogConfig.xml and placed in these directories on all Sense servers:
C:\ProgramData\Qlik\Sense\EngineC:\ProgramData\Qlik\Sense\ProxyC:\ProgramData\Qlik\Sense\RepositoryC:\ProgramData\Qlik\Sense\Scheduler
Selective Deployment
If you have more than one Sense server you strictly speaking don't have to deploy log appenders to all servers.
If you are only interested in receiving log events from some servers and/or services (engine, proxy, repository, scheduler) - deploy the log appender files there.