Track App Open Times
This example shows how to use Butler SOS to track how long it takes to open apps on a Qlik Sense server.
Overview
Goal
The goal is to show how to use Butler SOS to track how long it takes to open apps on a Qlik Sense server.
This is useful for several reasons:
- Baseline establishment - Know how long it usually takes to open apps on your server, and track changes over time
- Identify slow apps - Find apps that are slow to open and investigate why
- Alerting - Set up Grafana alerts when app opening time exceeds certain thresholds
- Verify user complaints - If end users complain about slow app opening times, use this data to verify if there's actually a problem
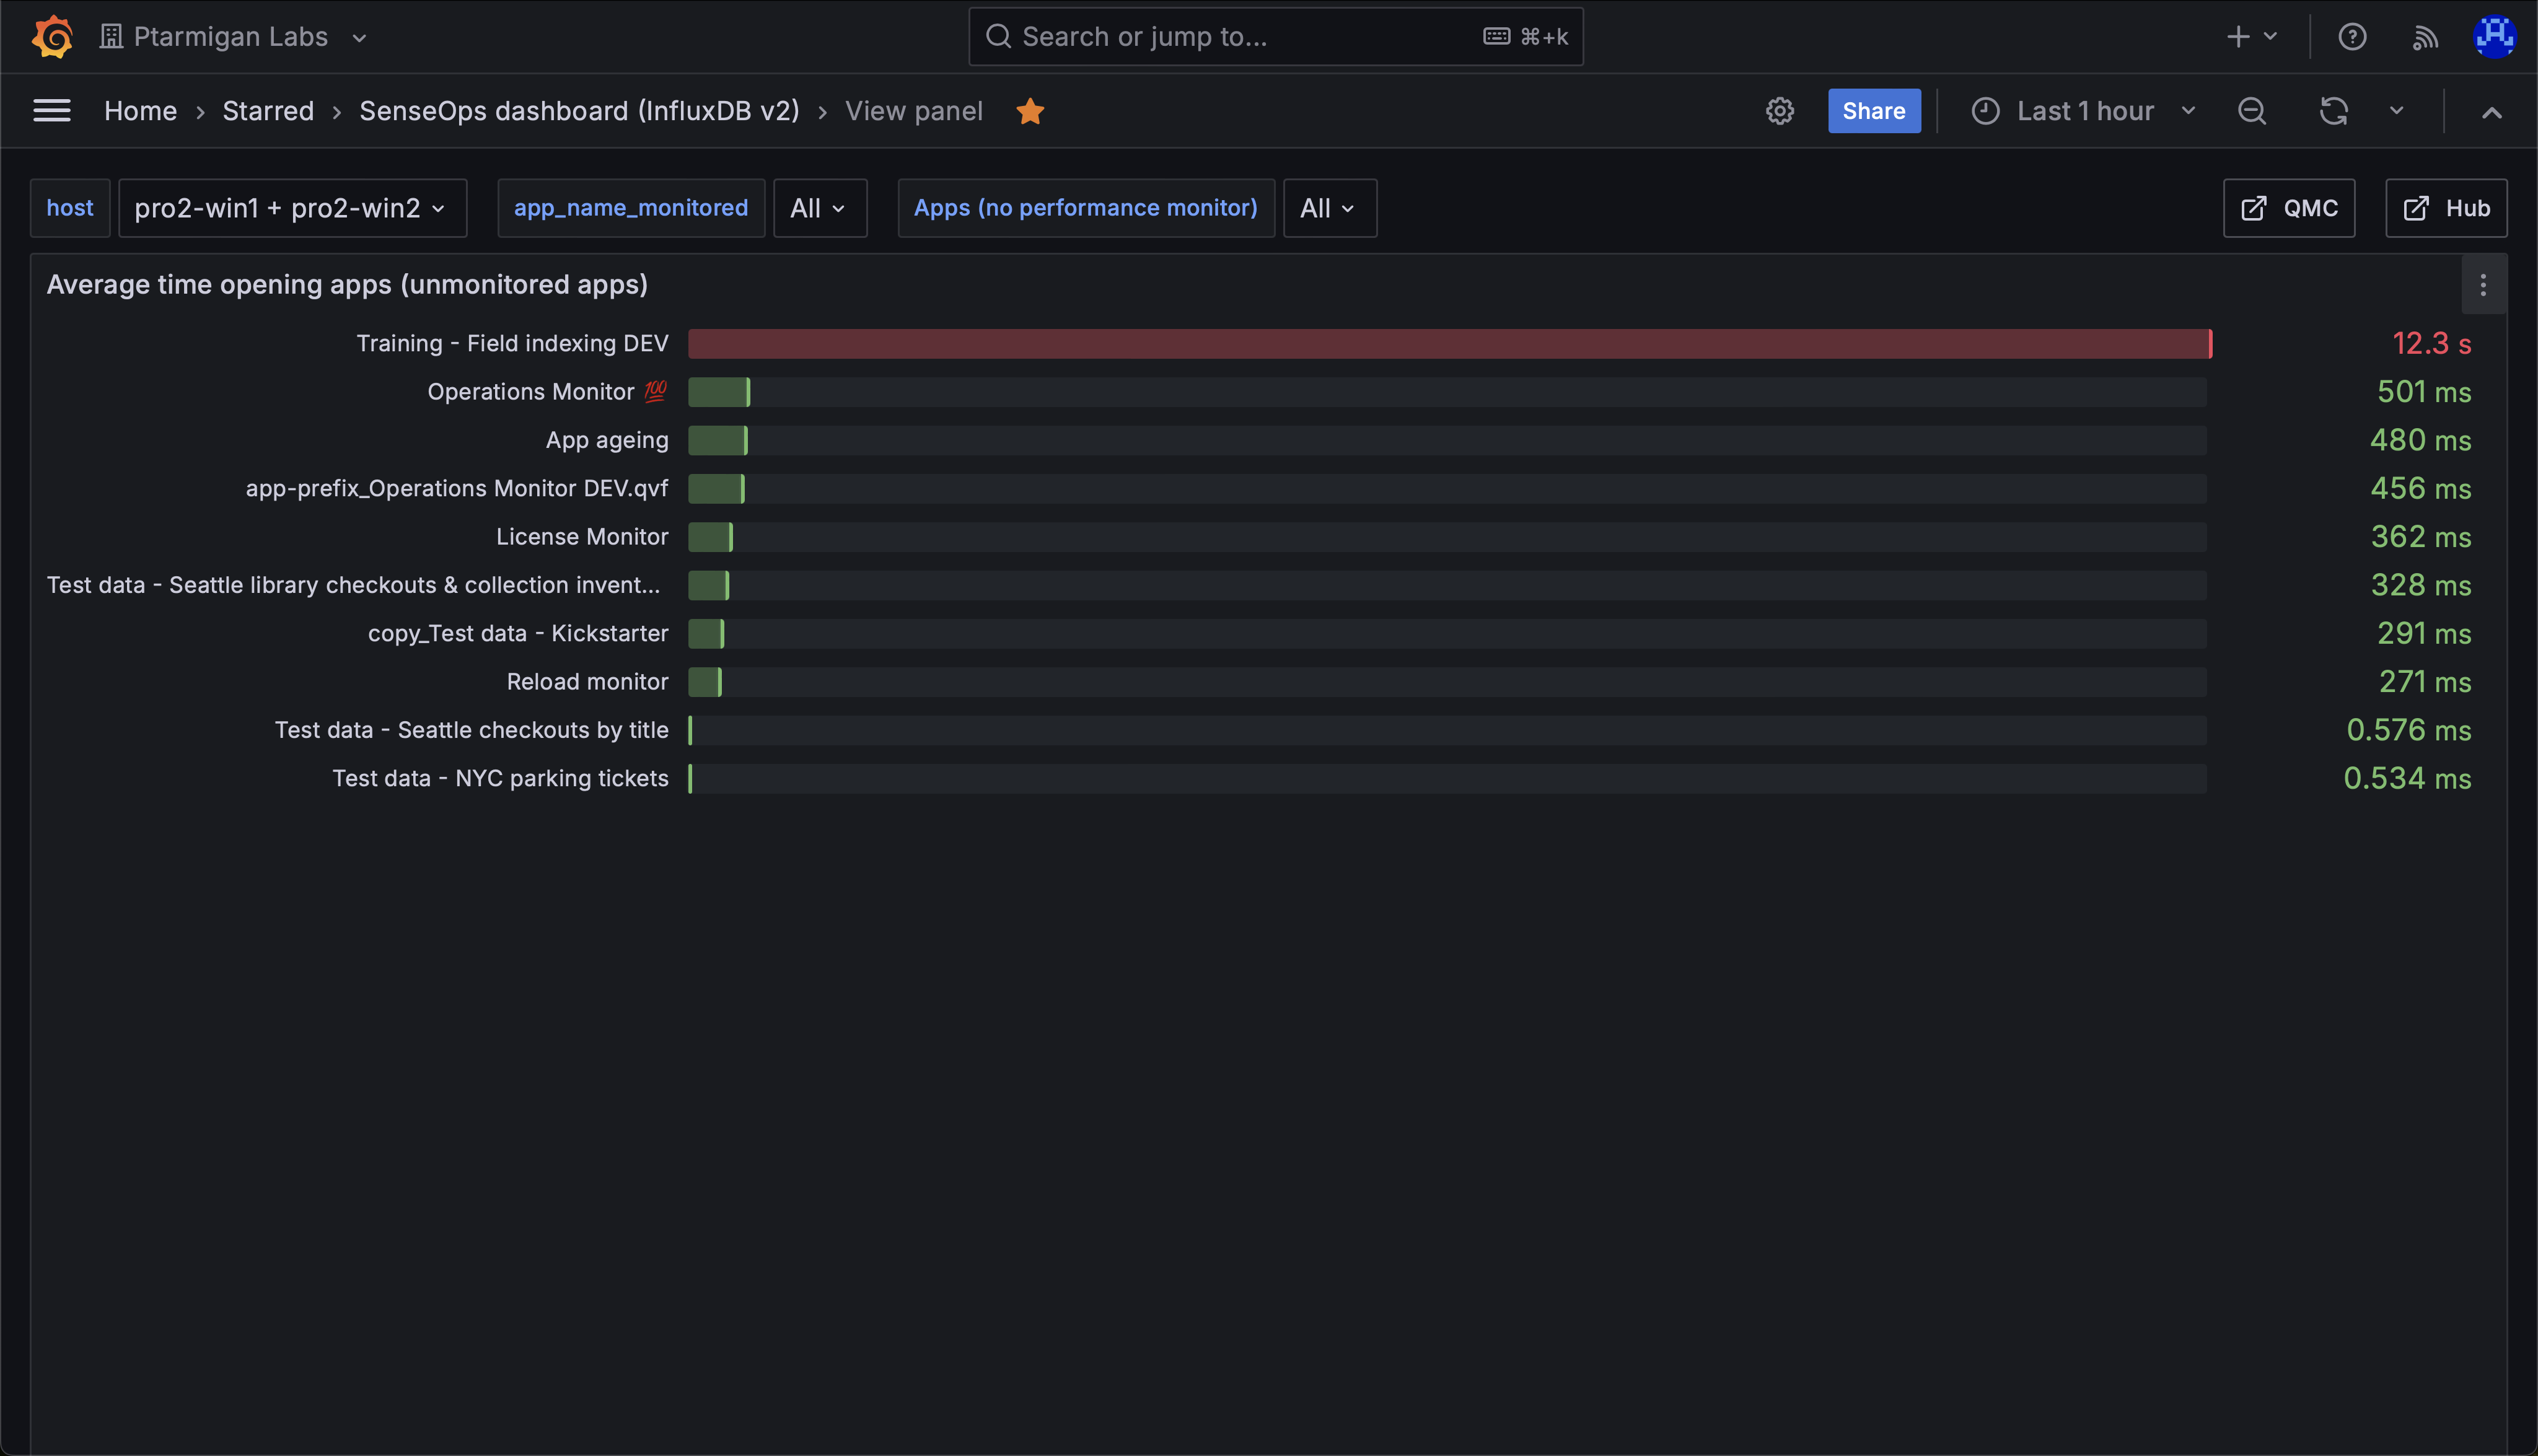 Chart showing mean time needed to open apps on a Qlik Sense server.
Prerequisites
- Butler SOS 11.0 or later. Download from GitHub releases.
- Store the data collected by Butler SOS in an InfluxDB v1 or v2 database. InfluxDB setup instructions.
- XML appender files deployed on the Sense servers you want to monitor.
- A reasonably recent version of Grafana.
- Data connections set up in Grafana to the InfluxDB database.
Configure Butler SOS
There are several ways to track app opening times:
- Enable tracking of rejected performance log events - Butler SOS will track the number of events and processing time for these events.
- Enable detailed engine performance monitoring - Get detailed data that can be aggregated to create counters.
Rejected events explained
"Rejected events" are engine performance log events that do not meet the criteria set up in Butler SOS for detailed engine performance monitoring.
You can disable all detailed engine monitoring and only track rejected events - this still gives you counters for event count and processing time across various dimensions, including engine "method".
Or you can enable detailed monitoring for some apps and only track rejected events for others.
Database requirement
InfluxDB is the only supported database for this feature. See the config file format reference for details.
  # Shared settings for user and log events
  qlikSenseEvents:
    influxdb:
      enable: true                  # Store event data in InfluxDB?
      writeFrequency: 20000         # How often (milliseconds) should event counts be written?
    ...
    rejectedEventCount:             # Rejected events are correctly formatted events
                                    # that are rejected based on Butler SOS configuration.
      enable: true                  # Should rejected events be counted and stored?
      influxdb:
        measurementName: rejected_event_count
  ...
  # Log events configuration
  logEvents:
    udpServerConfig:
      serverHost: butler-sos.mycompany.net
      portLogEvents: 9996
    tags:
      - name: qs_tag1
        value: somevalue1
      - name: qs_tag2
        value: somevalue2
    ...
    enginePerformanceMonitor:
      enable: true
      appNameLookup:
        enable: true
      trackRejectedEvents:
        enable: true                # Track events rejected by the performance monitor?
        tags:
          - name: qs_tag1
            value: somevalue1
          - name: qs_tag2
            value: somevalue2
Configure Grafana
Create a Grafana chart that shows the average time it takes to open apps on your Sense server(s). You do this by filtering data for the engine method Global::OpenApp.
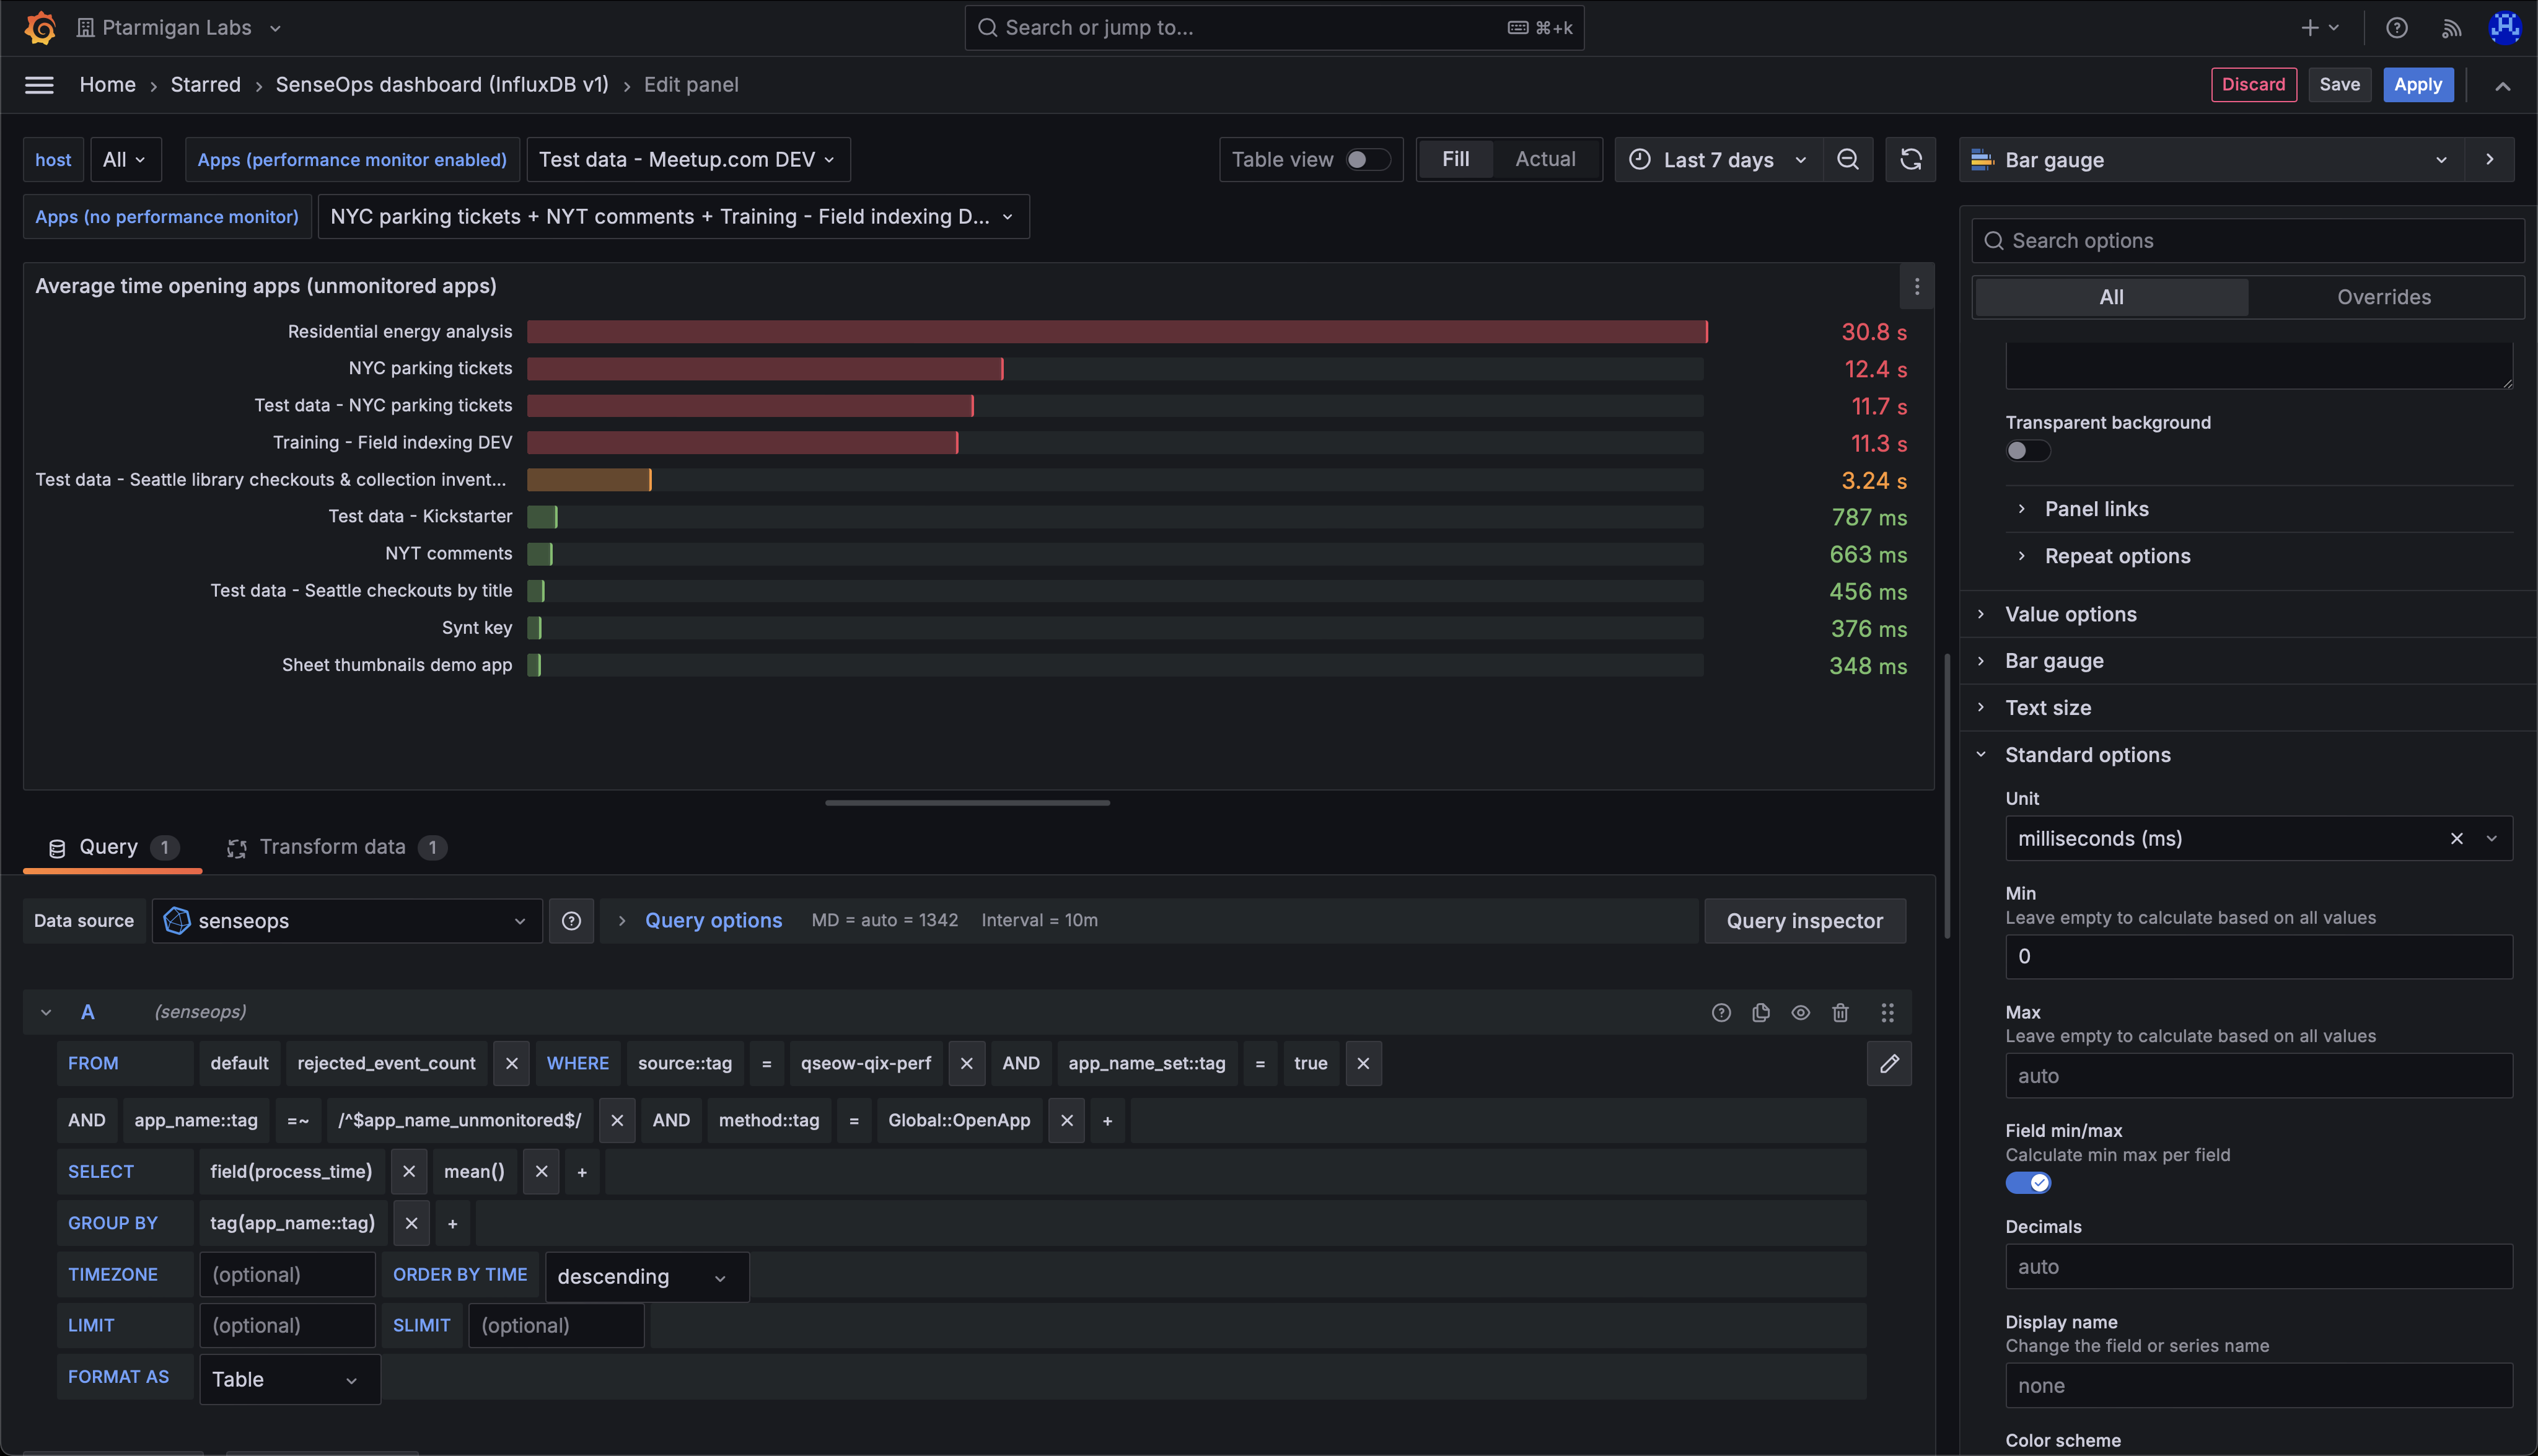 Definition of a Grafana chart showing the average time it takes to open apps on a Qlik Sense server.
Key Configuration Points
- Set the tag
methodtoGlobal::OpenApp- this is the engine method called when an app is opened in Qlik Sense - This method covers the entire time to open an app:
- For apps not in memory: includes time to load from disk (can be significant for large apps)
- For apps already in memory: time will be much shorter
- Use the
app_nametag to filter to specific apps
Grafana Variables
Use Grafana variables to easily change which apps to show data for:
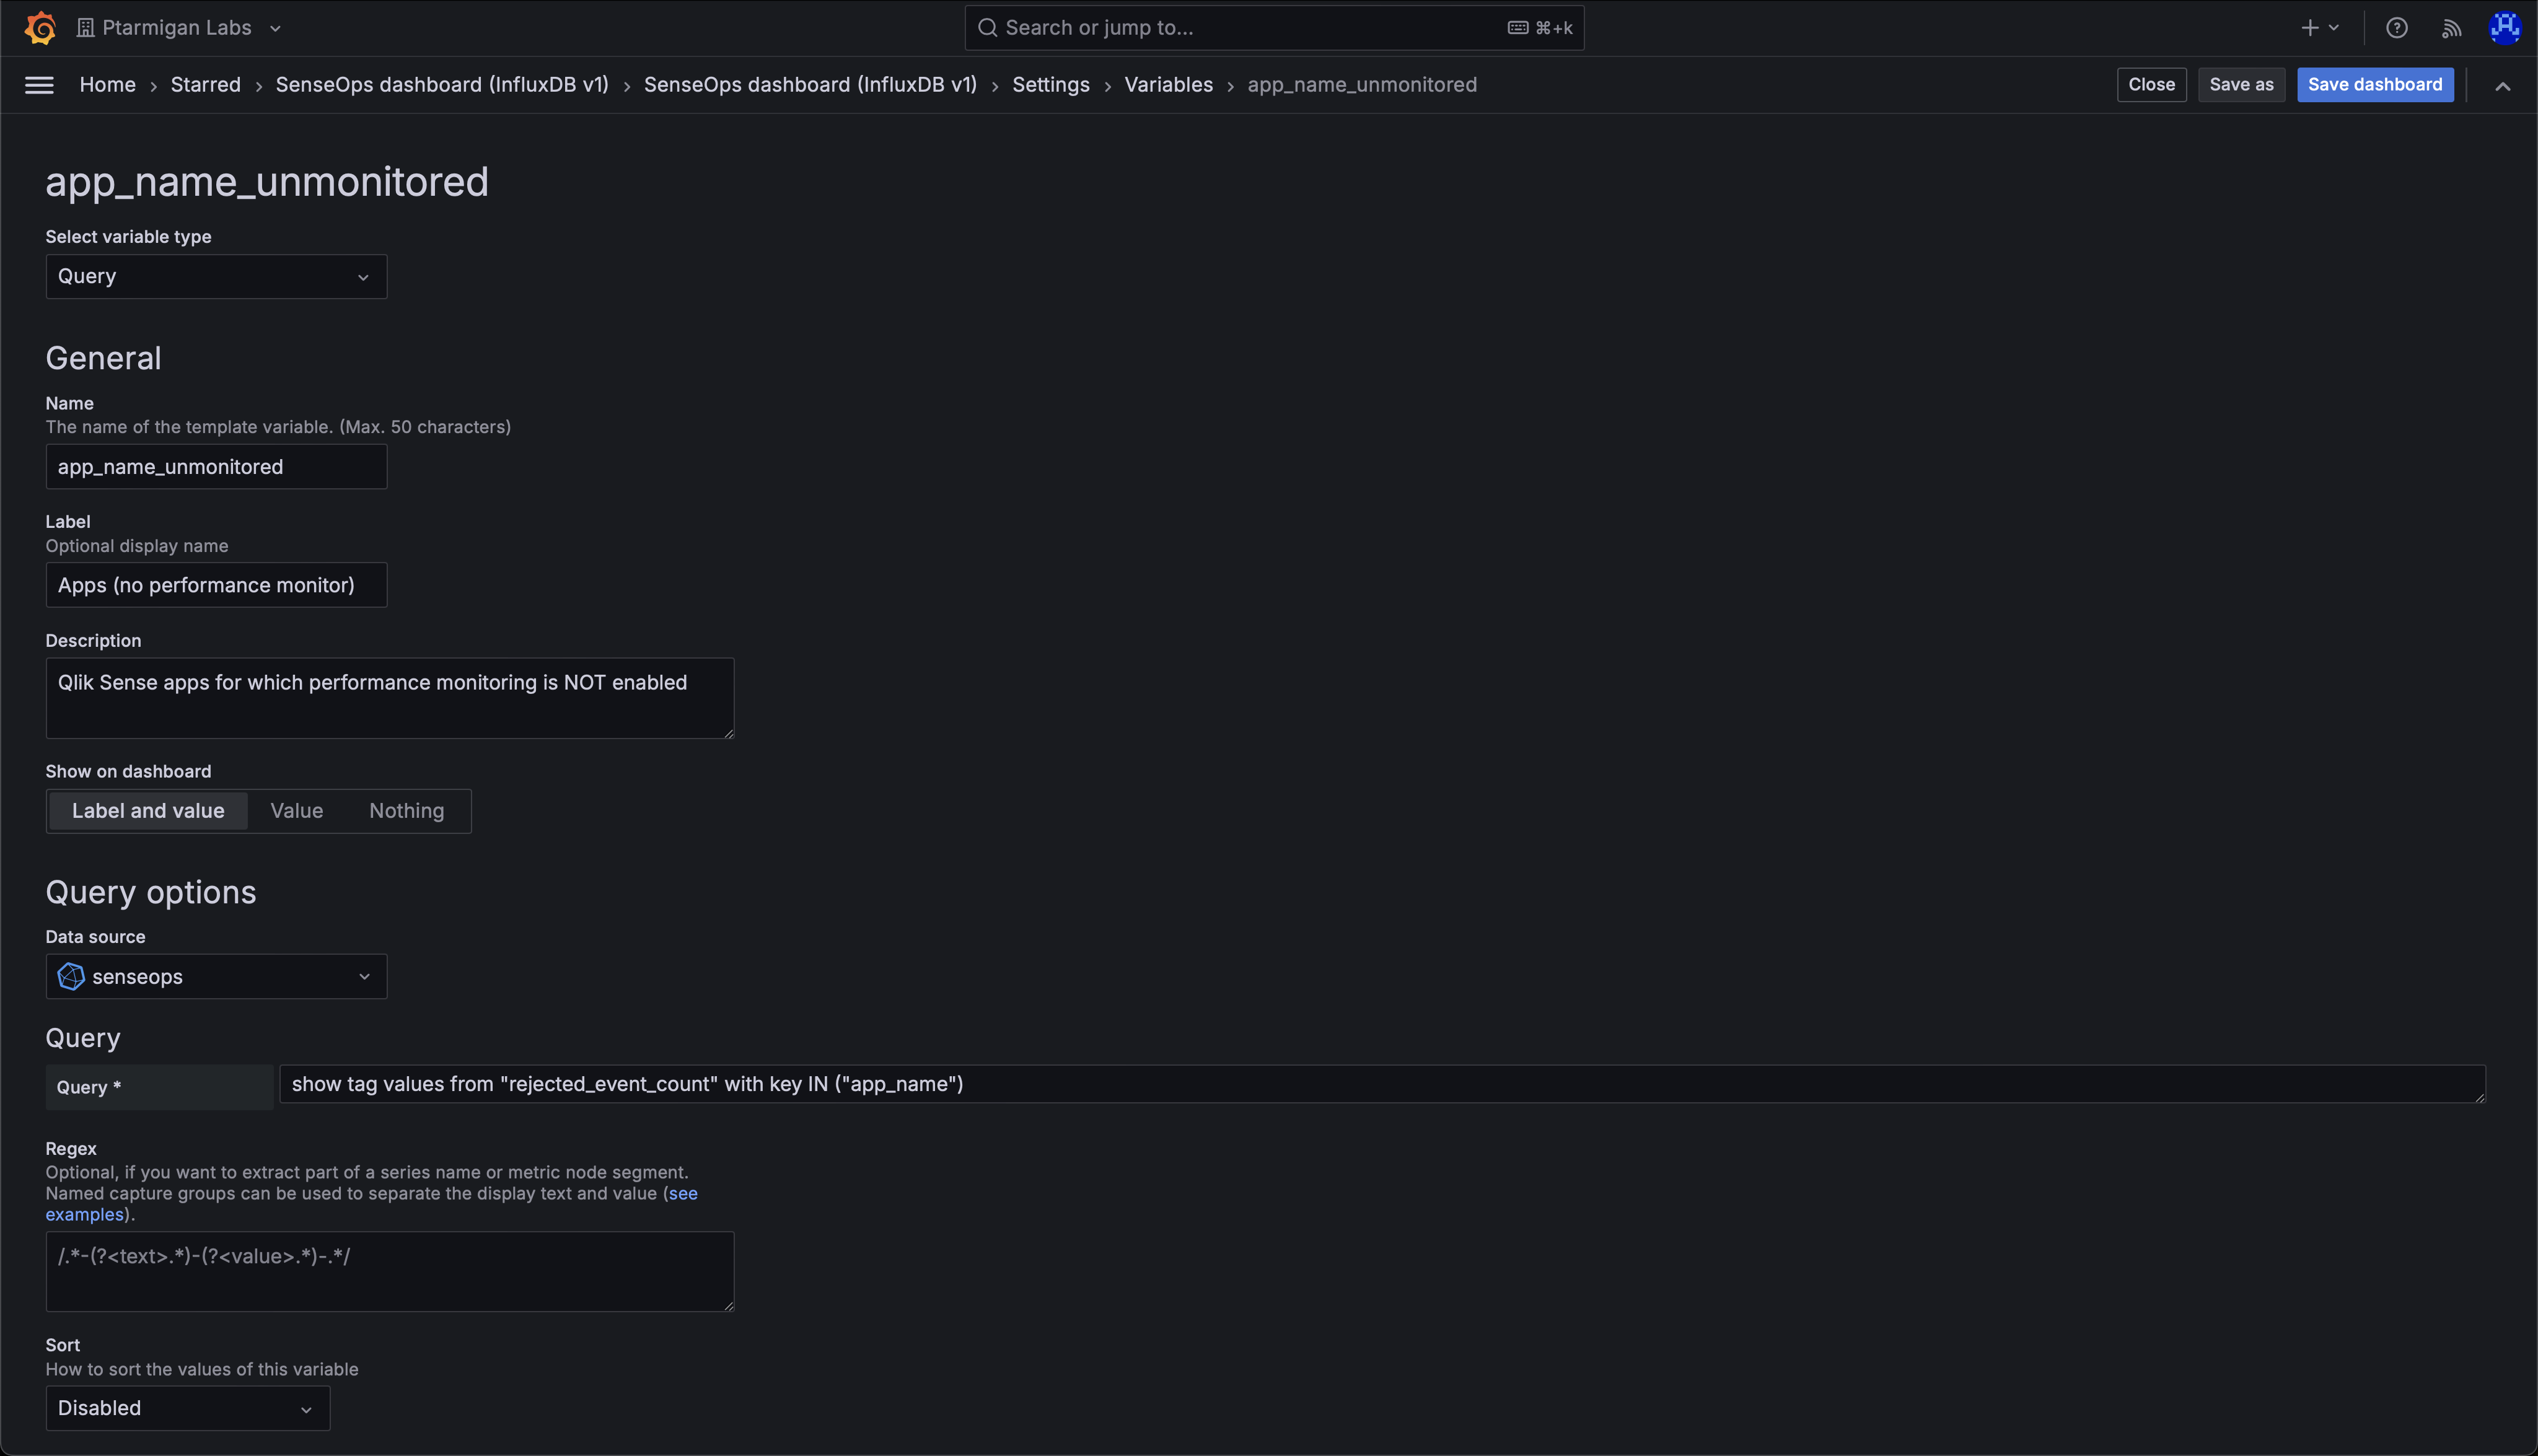 Create a Grafana variable that allows you to select which apps to show data for. Make sure to check the "Multi-value" and "Include All option" checkboxes.
Next Steps
Using the same concept but with different chart definitions, you can visualize the mean time for each method that Butler SOS tracks.
Combined with app-selection filter variables in Grafana, you can easily switch between different apps to see how long the various engine operations take in each of them.
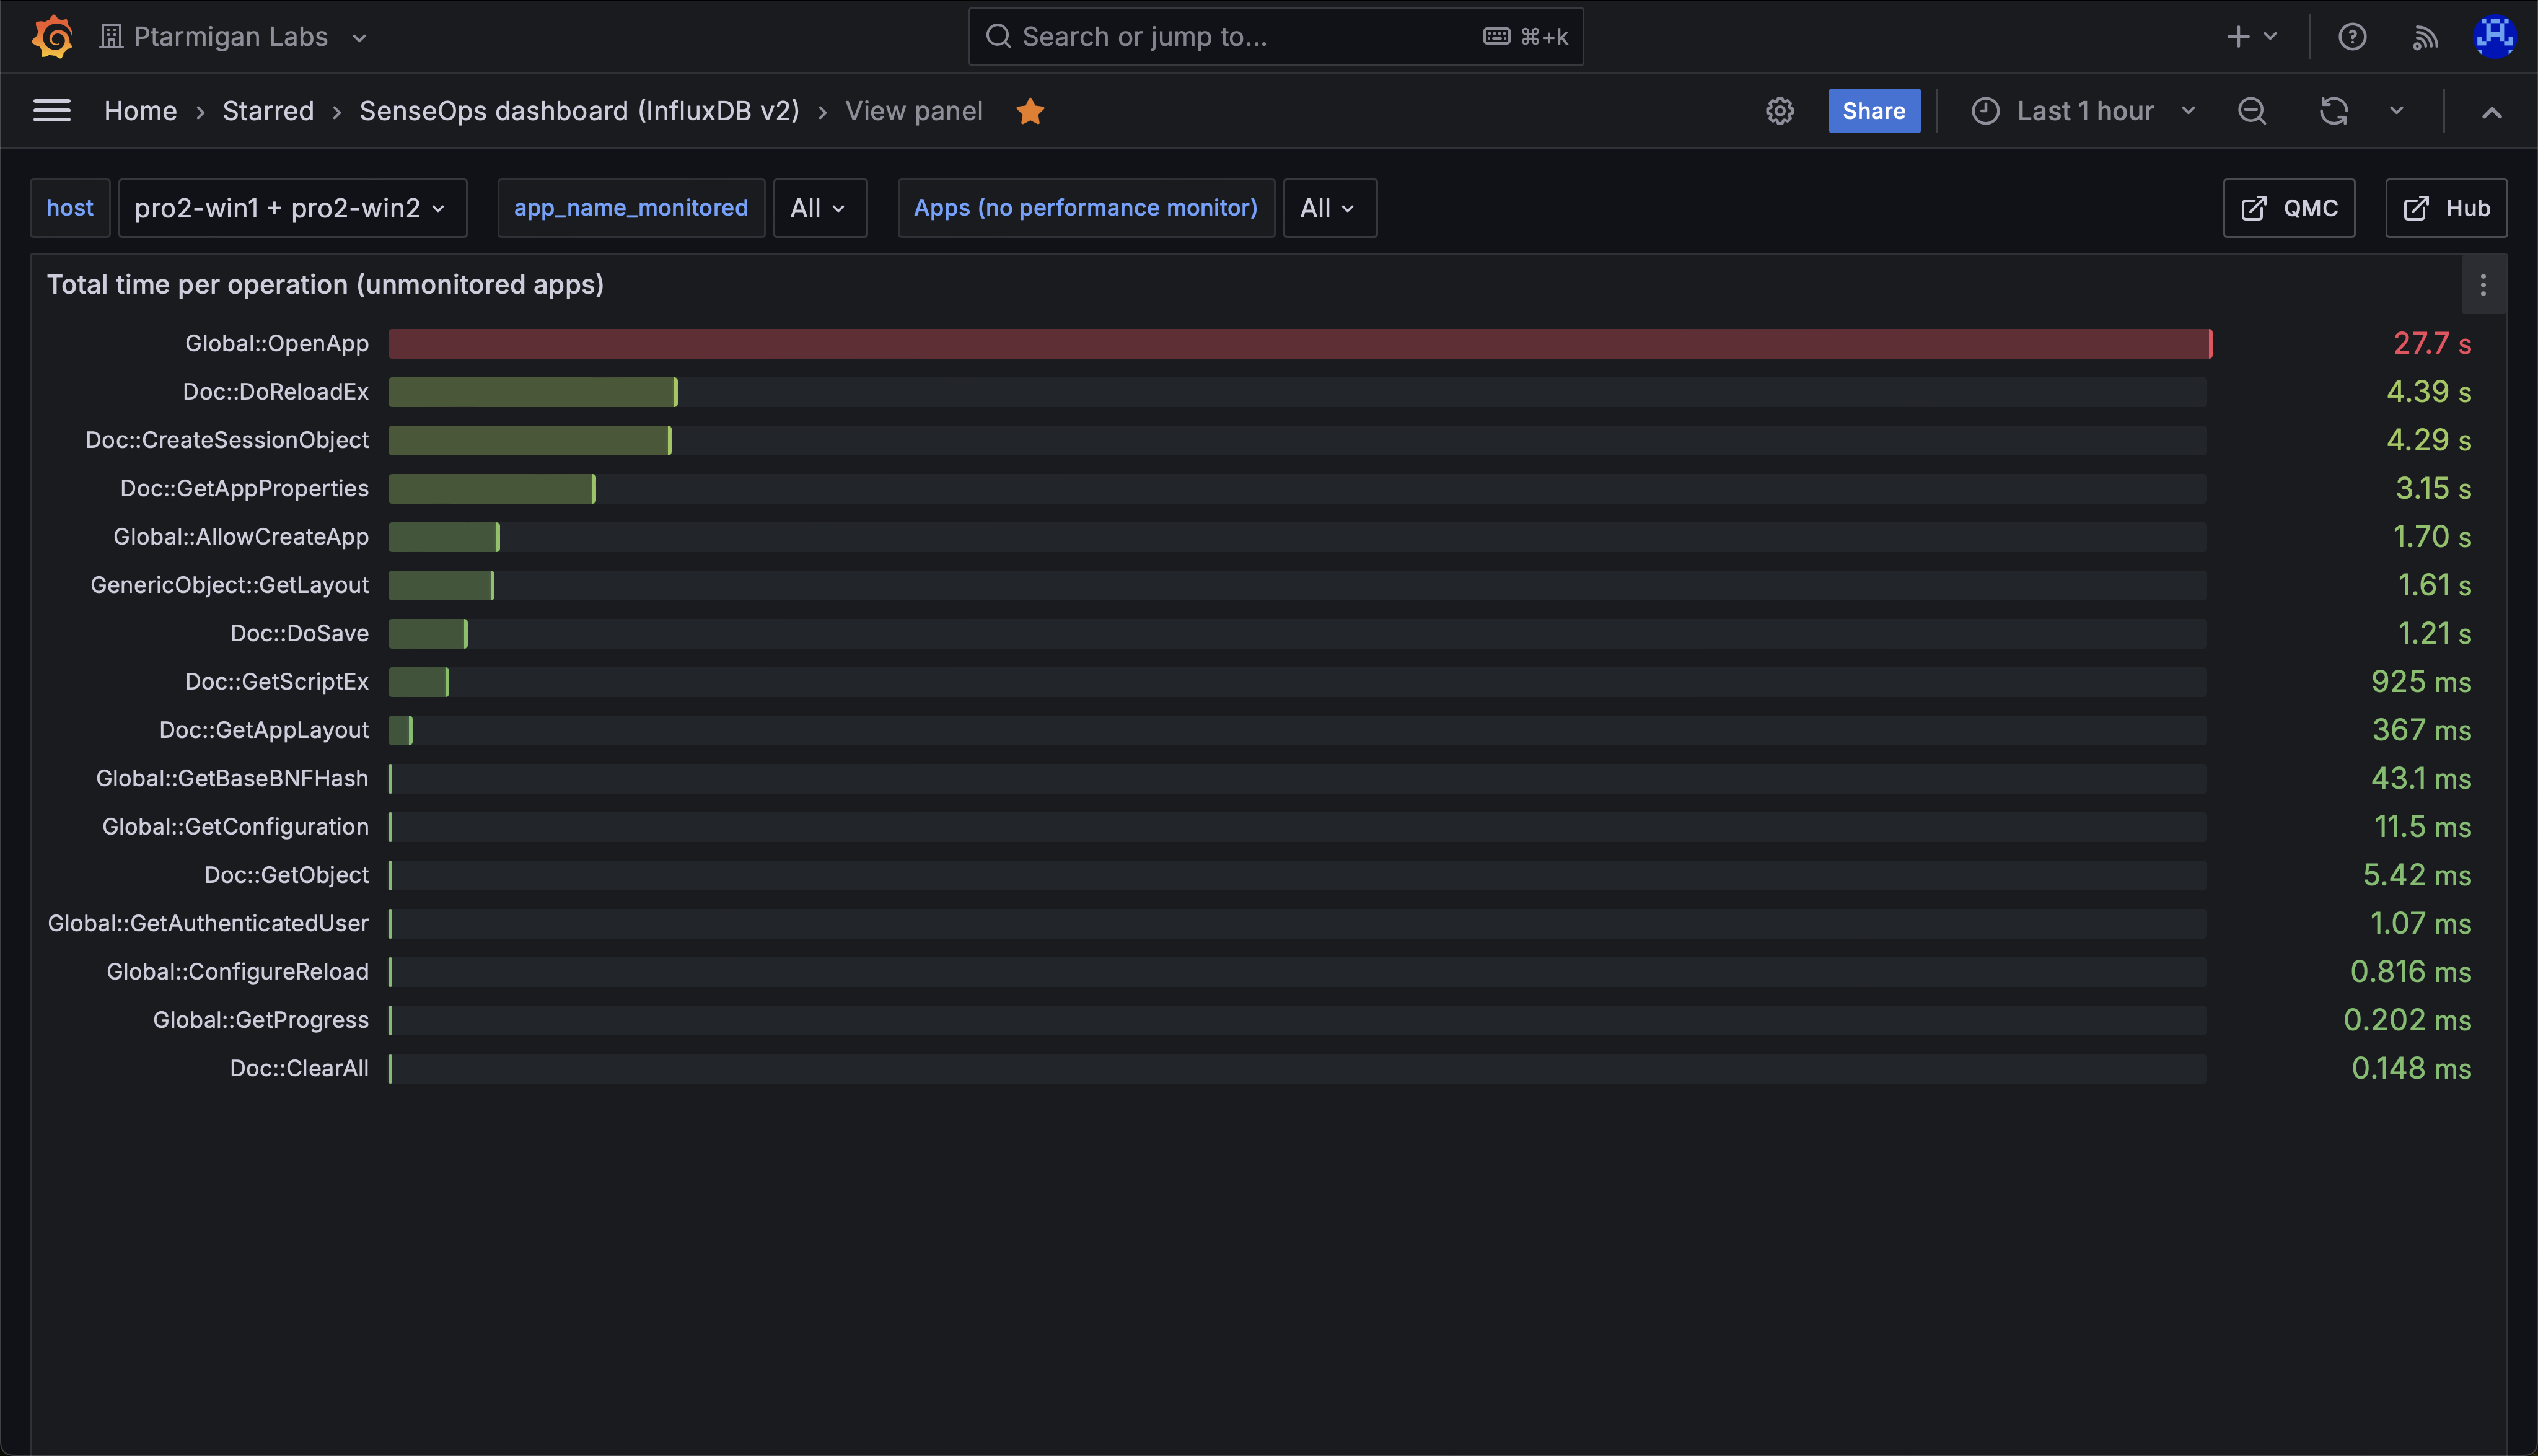 Chart showing mean time for all engine methods used during the selected time interval, for the selected app(s).
Related Topics
- Find Slow Updating Charts - Identify slow app objects
- Engine Performance Overview - Overview of performance monitoring
- Grafana Dashboards - More Grafana examples