Count User and Log Events
This example shows how to use Butler SOS to count user and log events received from one or more Qlik Sense servers.
Overview
Goal
The goal is to count how many user and log events are received from one or more Qlik Sense servers.
This can be useful for several reasons:
- Environment health monitoring - A sudden increase in the number of warnings, errors or fatals can be an early warning sign that something is wrong. The event counters can be seen as a kind of heartbeat of the Qlik Sense environment. Too fast - or too slow - can be a sign of trouble.
- Connectivity verification - The counters count all log and user events sent from the Qlik Sense servers to Butler SOS. They can be used to confirm that the Qlik Sense servers are indeed sending events to Butler SOS at all. Other, more detailed event data can then be used to drill down into the details of what is happening in the Qlik Sense environment.
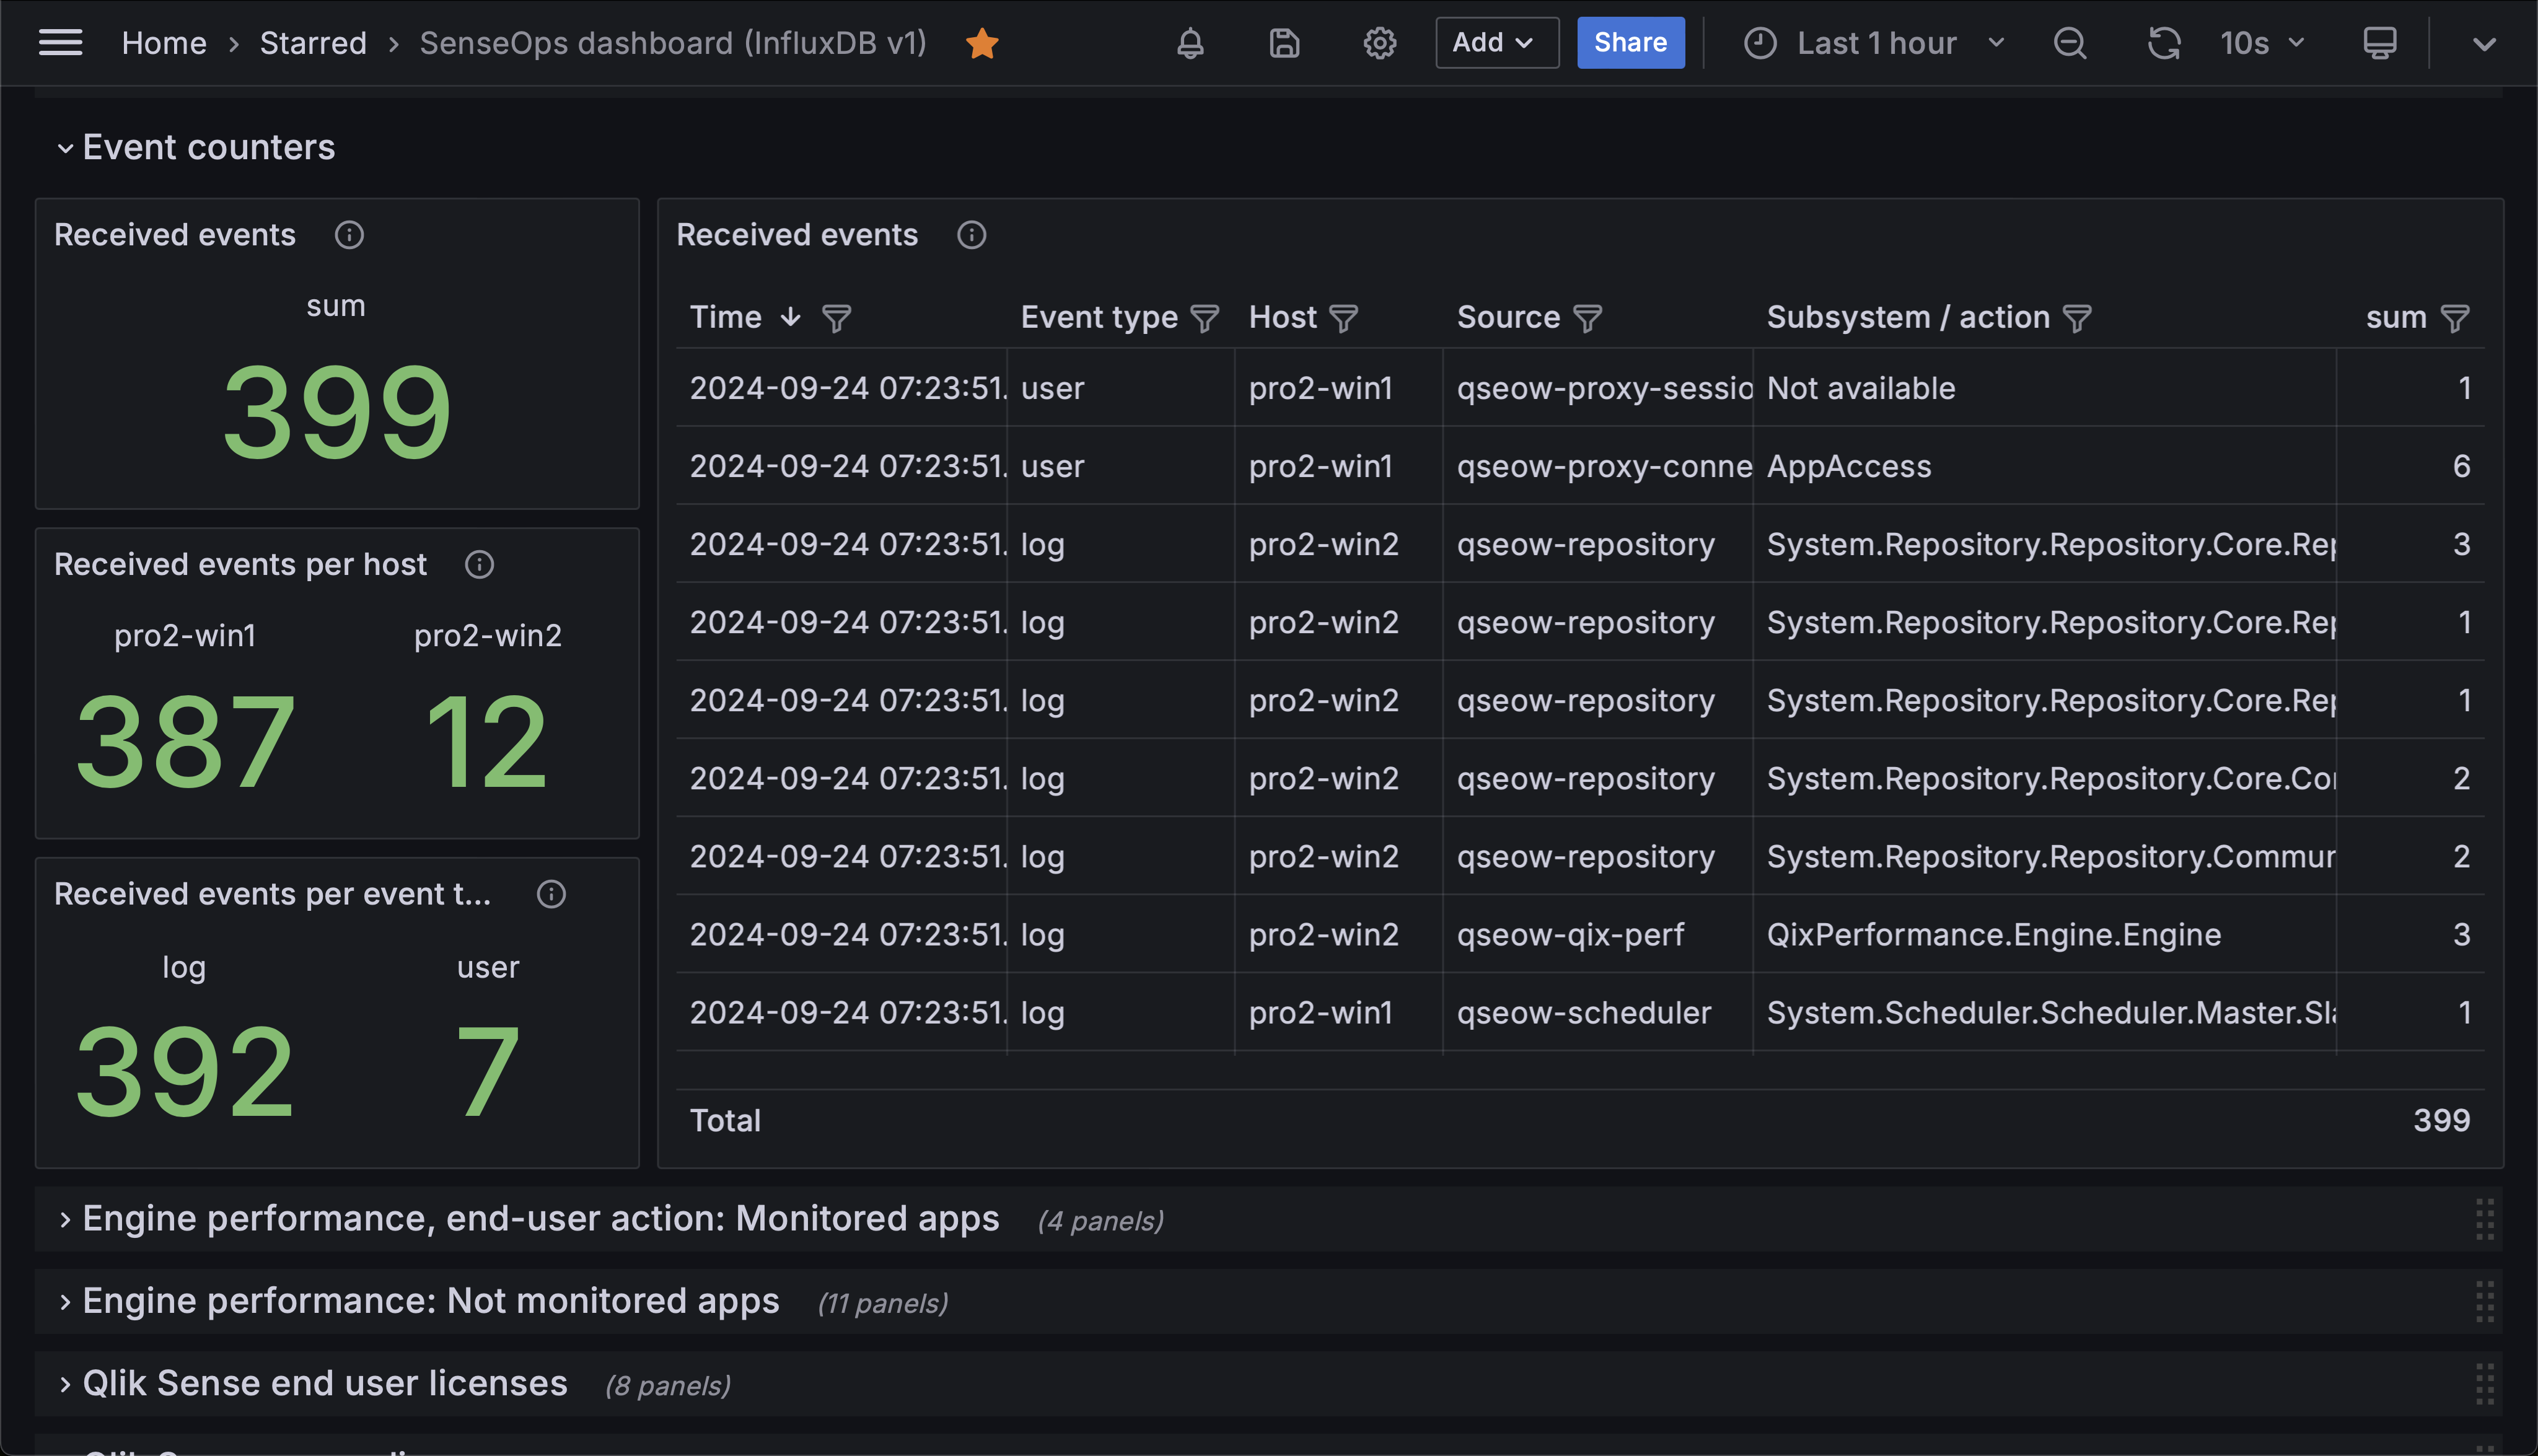 A set of Grafana panels showing the number of user and log events received from two Qlik Sense servers. The panels are broken down by event type (log or user) and by server. The table contains event count per host, Sense service and subsystem.
Prerequisites
- Butler SOS 11.0 or later. Download from GitHub releases.
- Store the data collected by Butler SOS in an InfluxDB v1 or v2 database. InfluxDB setup instructions.
- XML appender files deployed on the Sense servers you want to monitor. The appender files tell Sense to send log events to Butler SOS via UDP messages.
- A reasonably recent version of Grafana. At the time of writing, Grafana 11.2 is the latest version.
- Data connections set up in Grafana to the InfluxDB database where Butler SOS stores its data.
Configure Butler SOS
Database requirement
InfluxDB is the only supported database for this feature. See the config file format reference for details.
  # Shared settings for user and log events (see below)
  qlikSenseEvents:                  # Shared settings for user and log events (see below)
    influxdb:
      enable: true                  # Should summary (counter) of user/log events, and rejected events be stored in InfluxDB?
      writeFrequency: 20000         # How often (milliseconds) should event counts be written to InfluxDB?
  ...
  ...
  # Log events are used to capture Sense warnings, errors and fatals in real time
  # Shared settings for user and log events (see below)
  qlikSenseEvents:                  # Shared settings for user and log events (see below)
    influxdb:
      enable: true                  # Should summary (counter) of user/log events, and rejected events be stored in InfluxDB?
      writeFrequency: 20000         # How often (milliseconds) should rejected event count be written to InfluxDB?
    eventCount:                     # Track how many log and user events are received from Sense.
                                    # Some events are valid, some are not. Of the valid events, some are rejected by Butler SOS
                                    # based on the configuration in this file.
      enable: true                  # Should event count be stored in InfluxDB?
      influxdb:
        measurementName: event_count # Name of the InfluxDB measurement where event count is stored
        tags:                       # Tags are added to the data before it's stored in InfluxDB
          - name: qs_tag1
            value: somevalue1
          - name: qs_tag2
            value: somevalue2
Configure Grafana
Total count of user and log events received from two Qlik Sense servers
The upper left panel of the Grafana dashboard uses a two-layered query to get the data from InfluxDB in a format that Grafana can use.
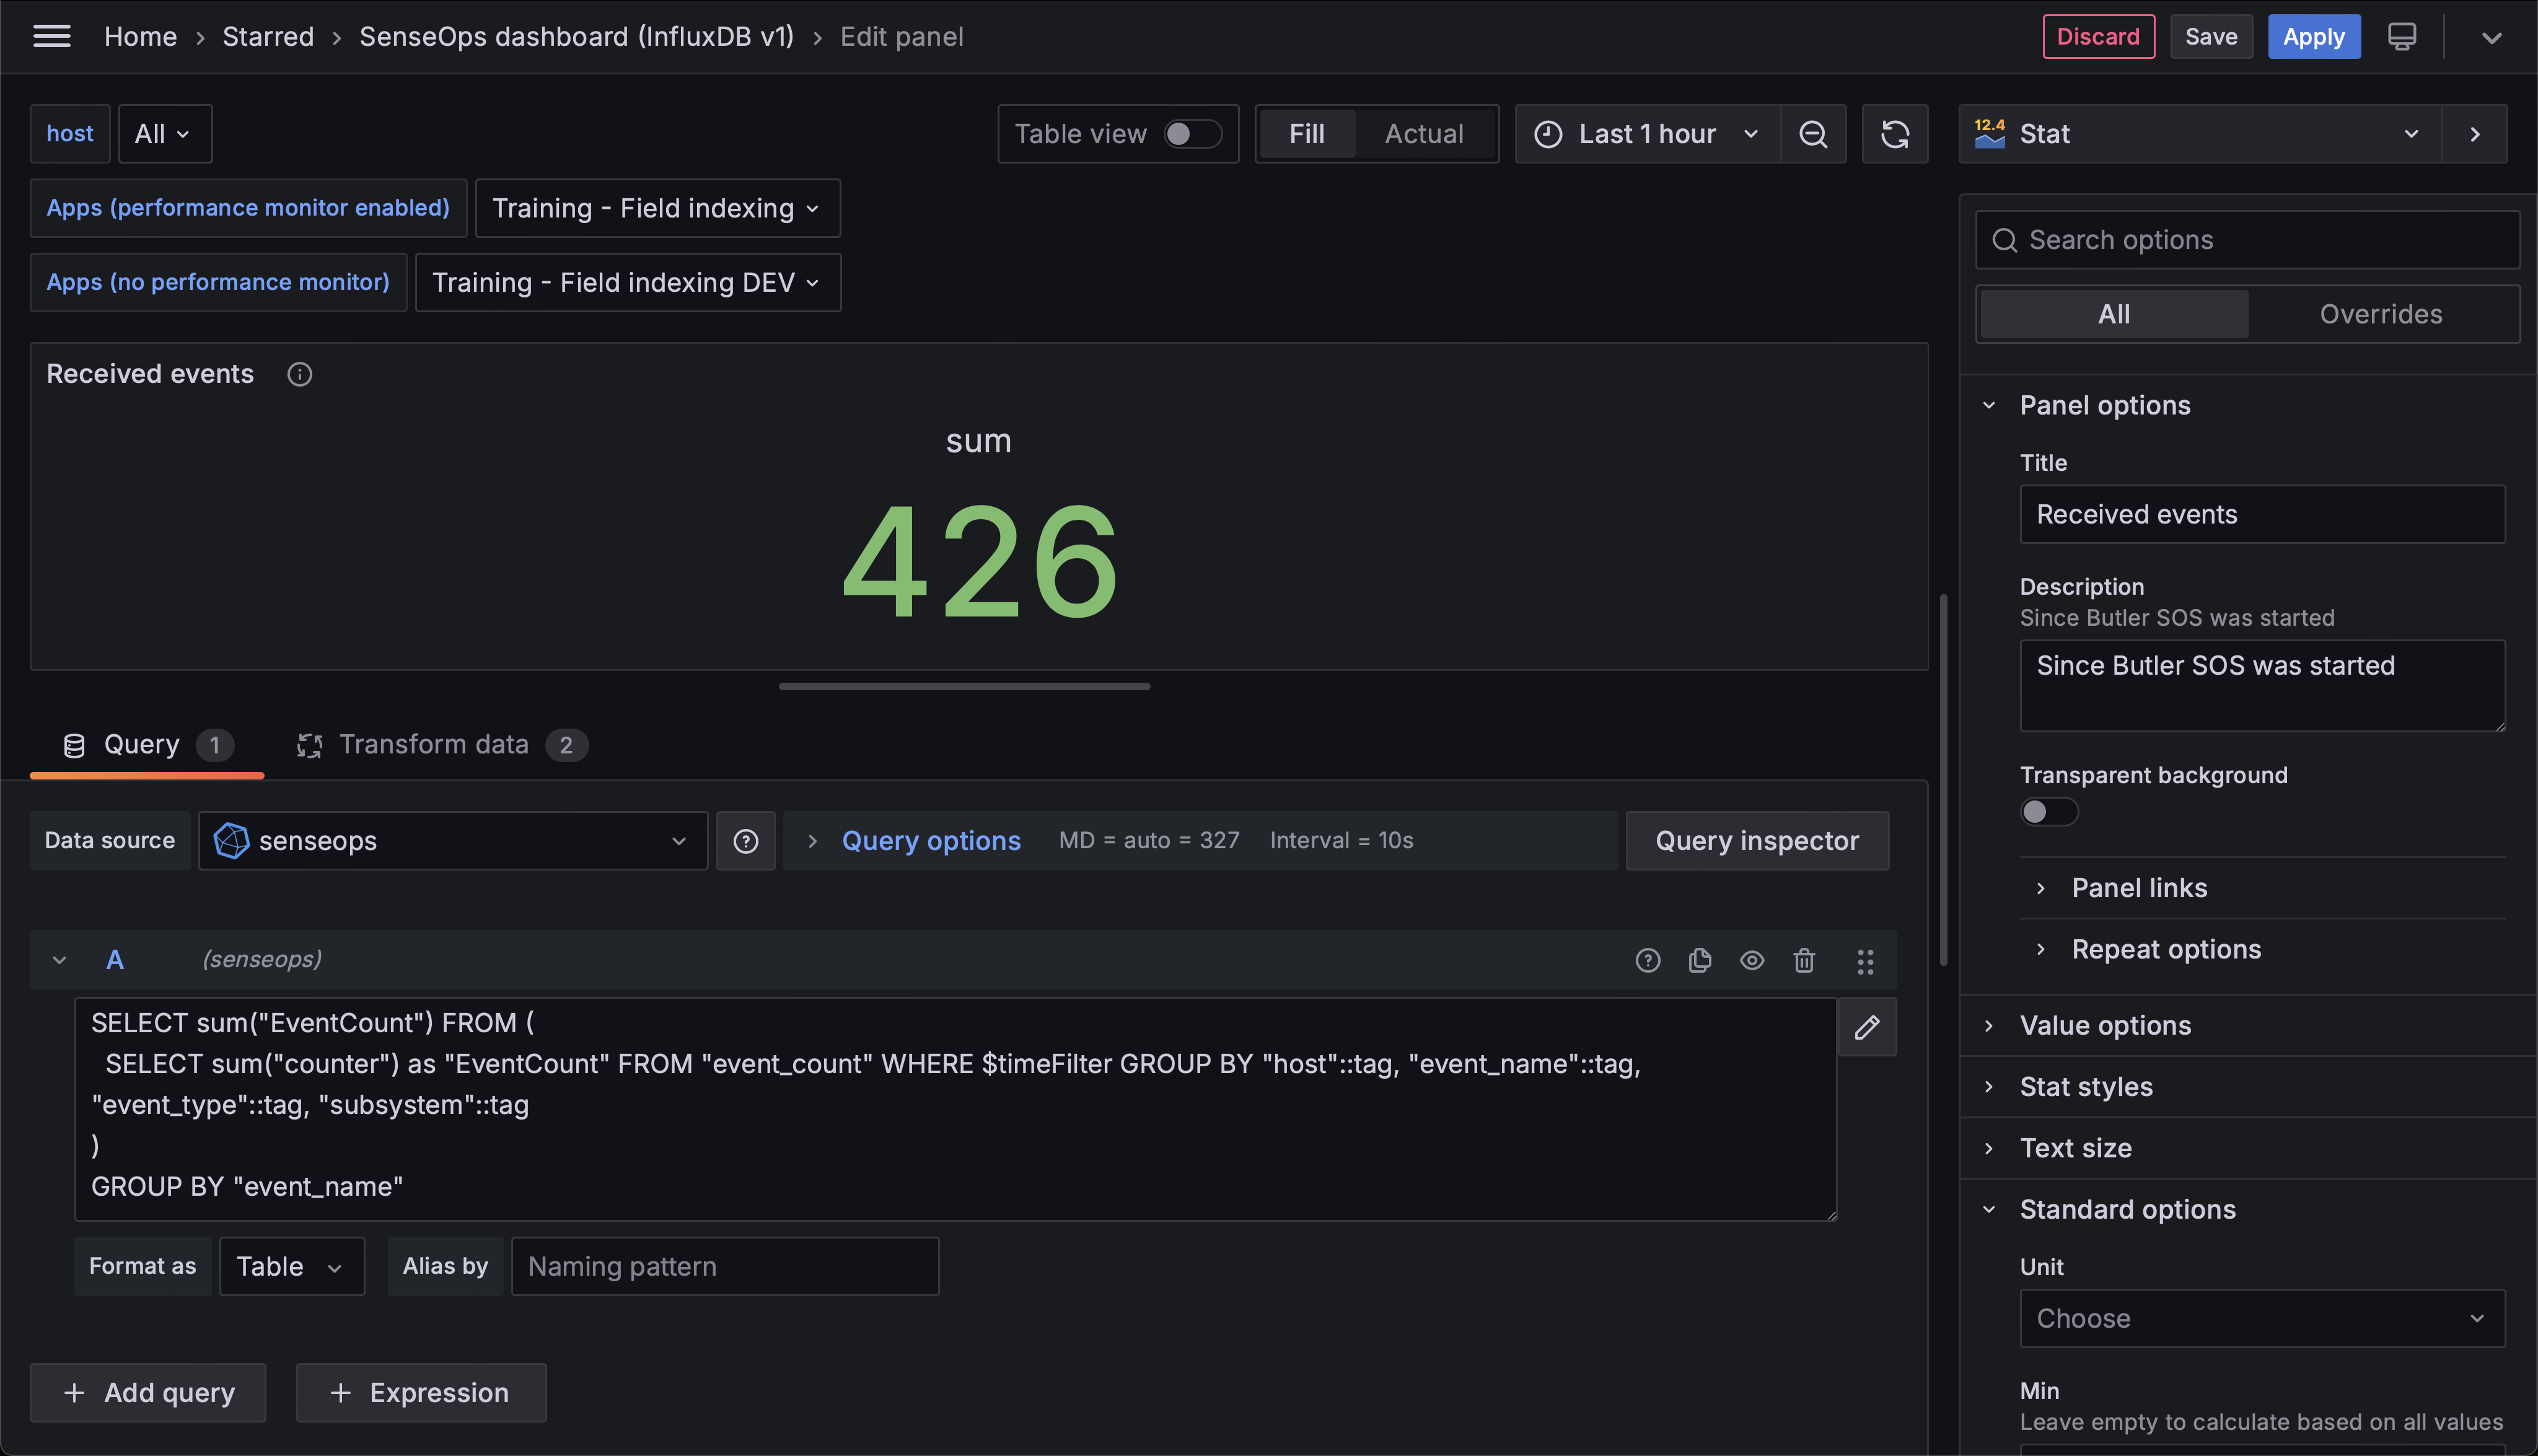 Total count of user and log events received from two Qlik Sense servers.
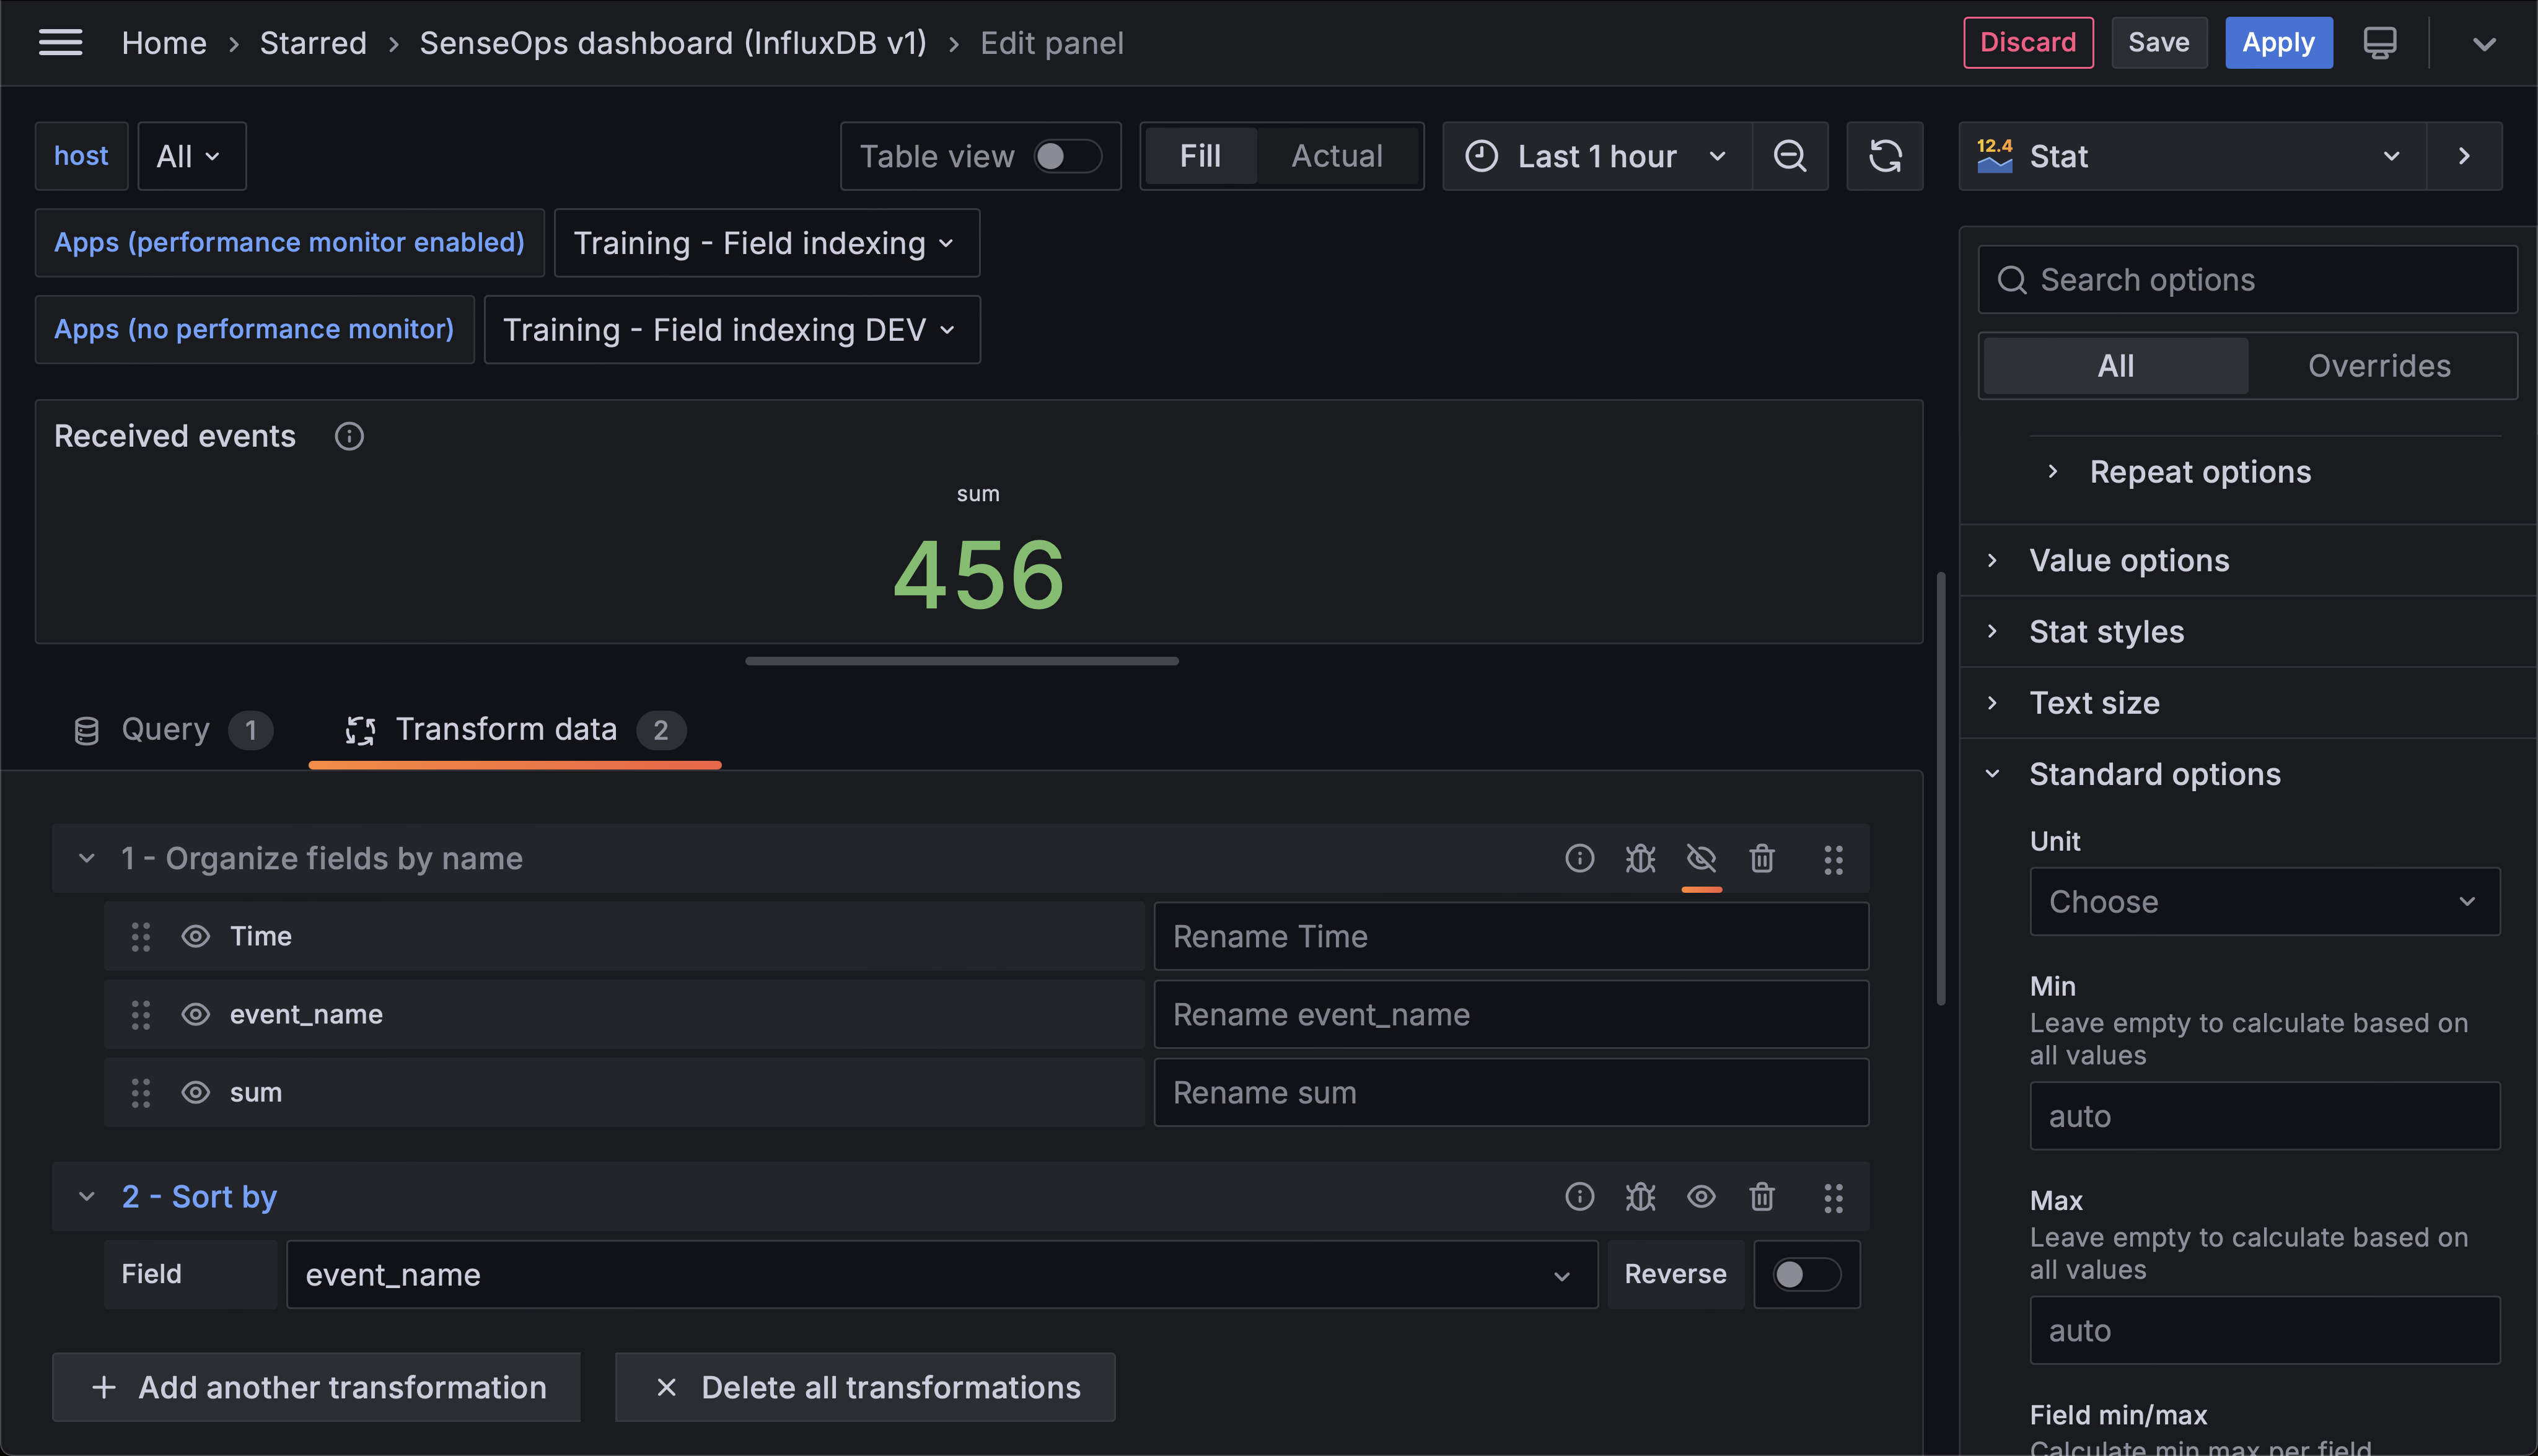 Transformations applied to the data before it's displayed in the Grafana panel. The sorting is done to make sure the data is displayed in the correct order.
Count of user and log events per host
The center left panel uses a similar query but with different grouping.
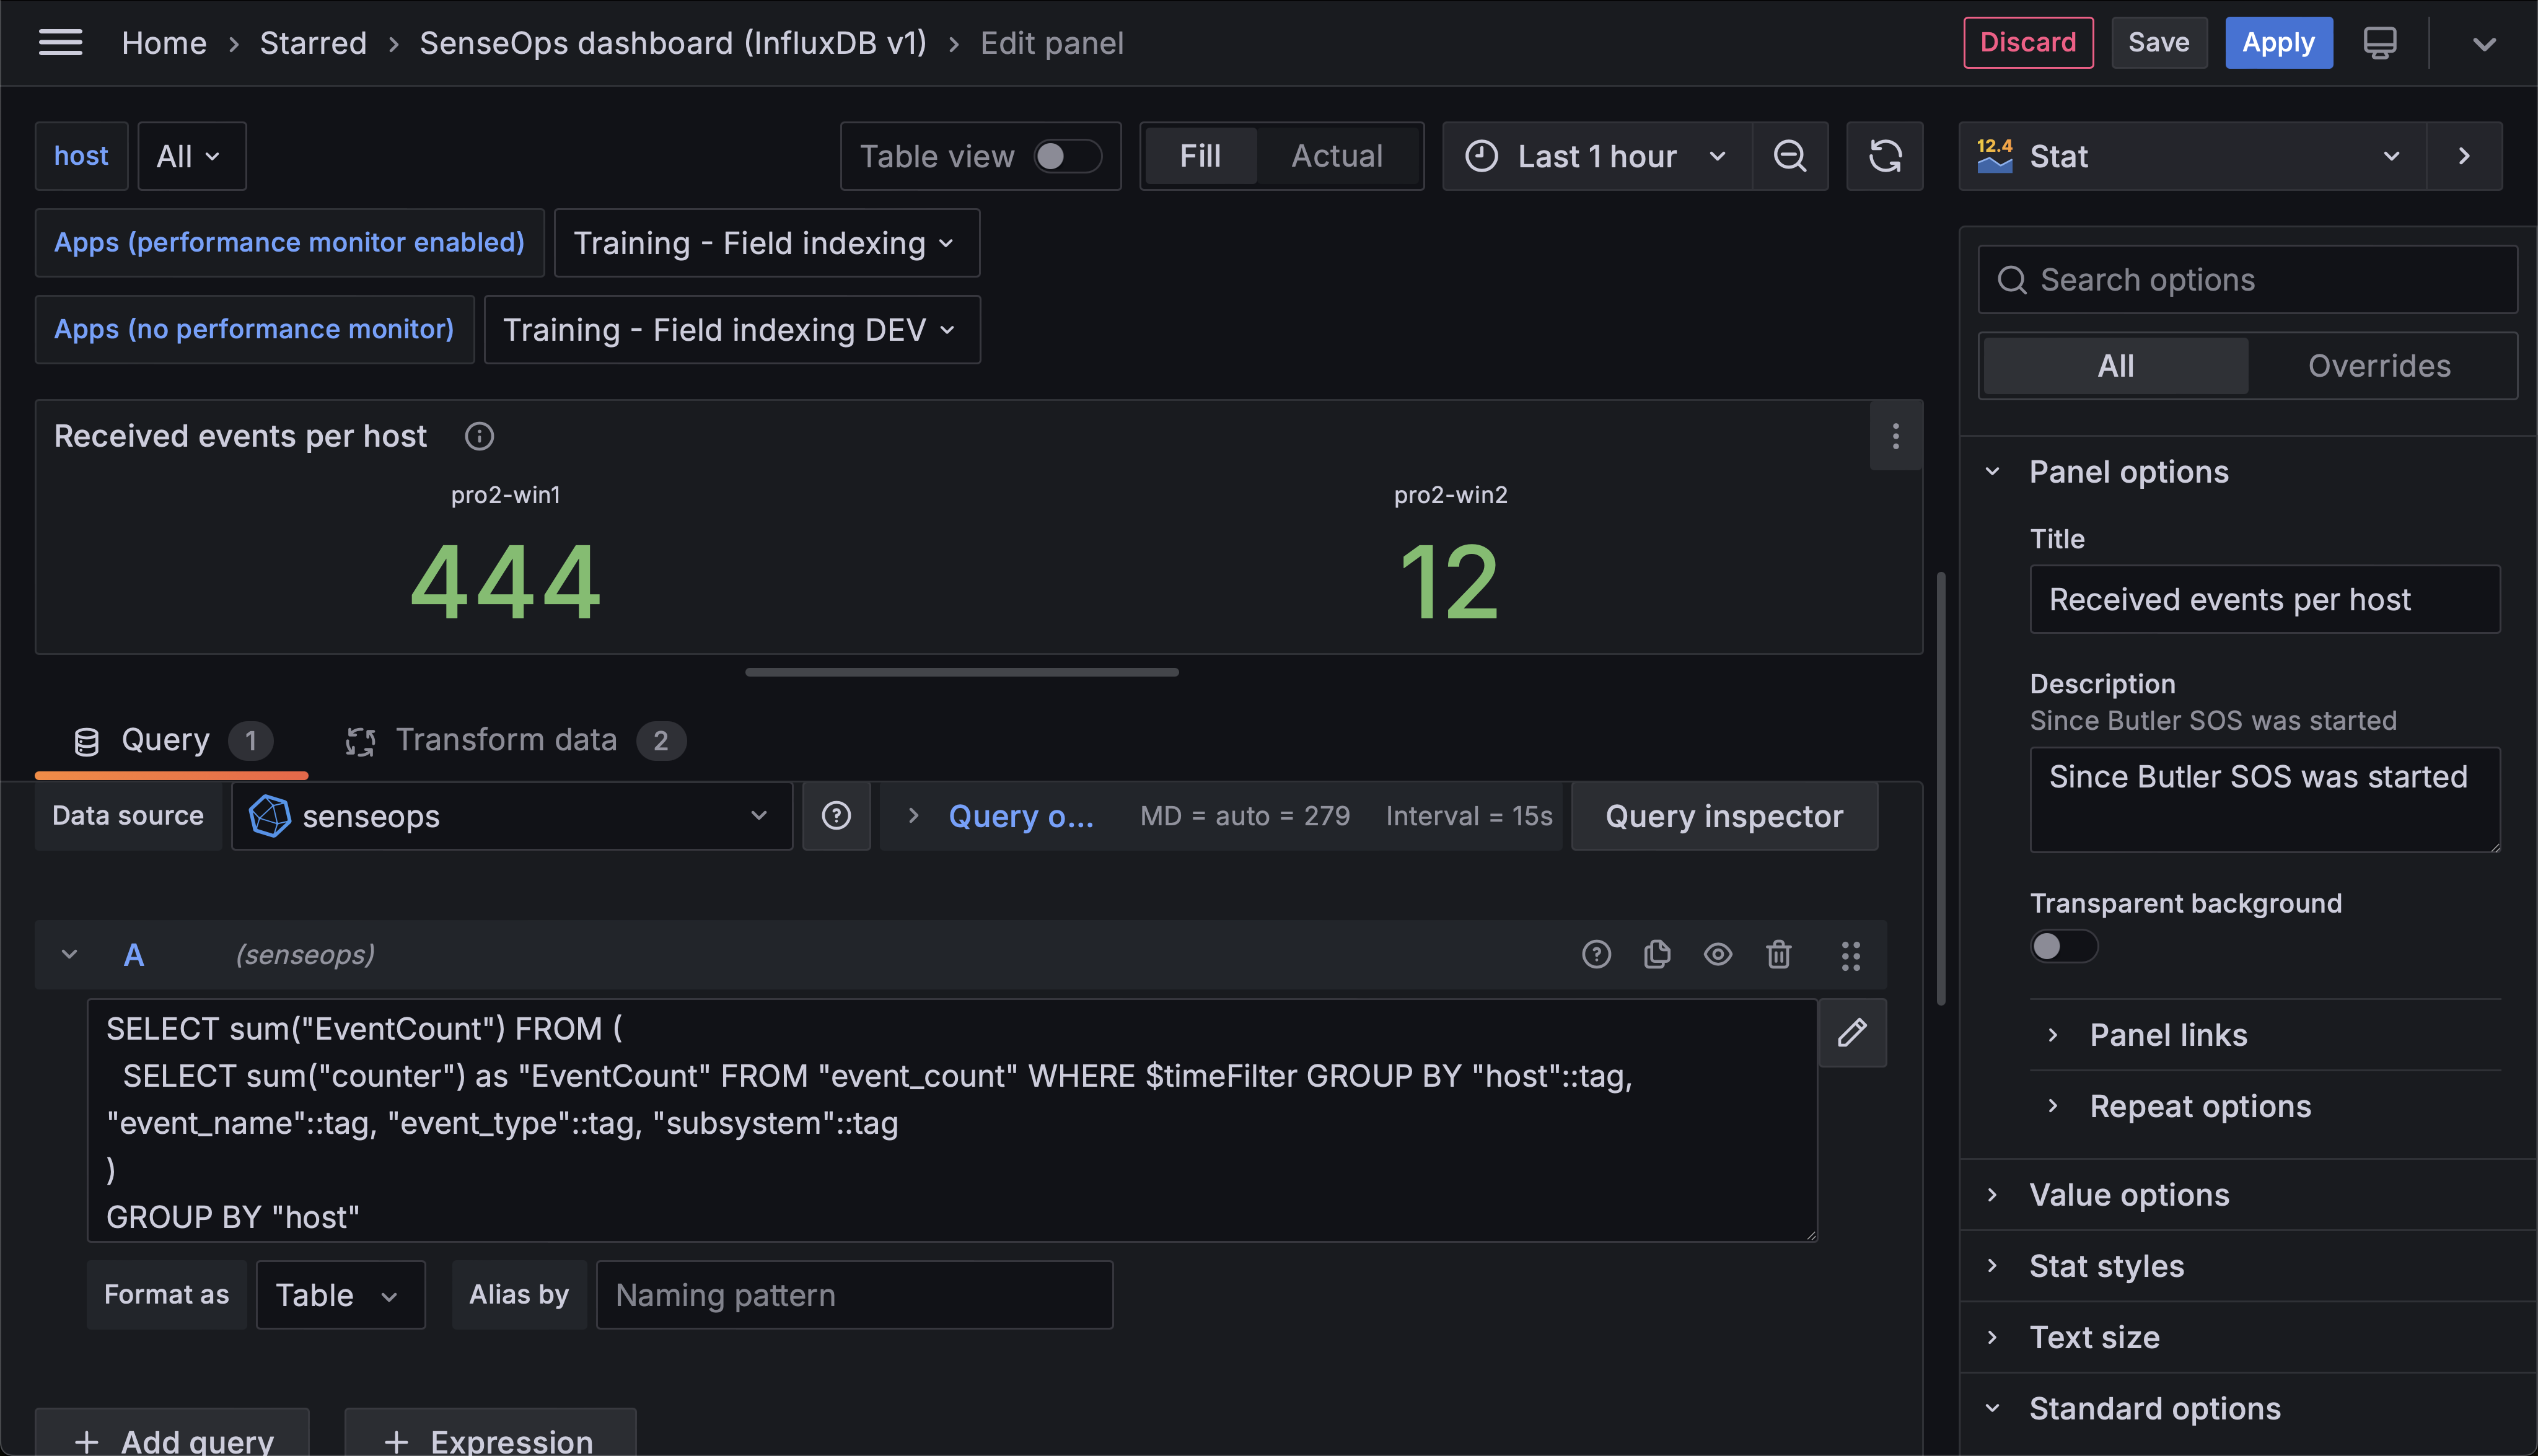 Count of user and log events per host.
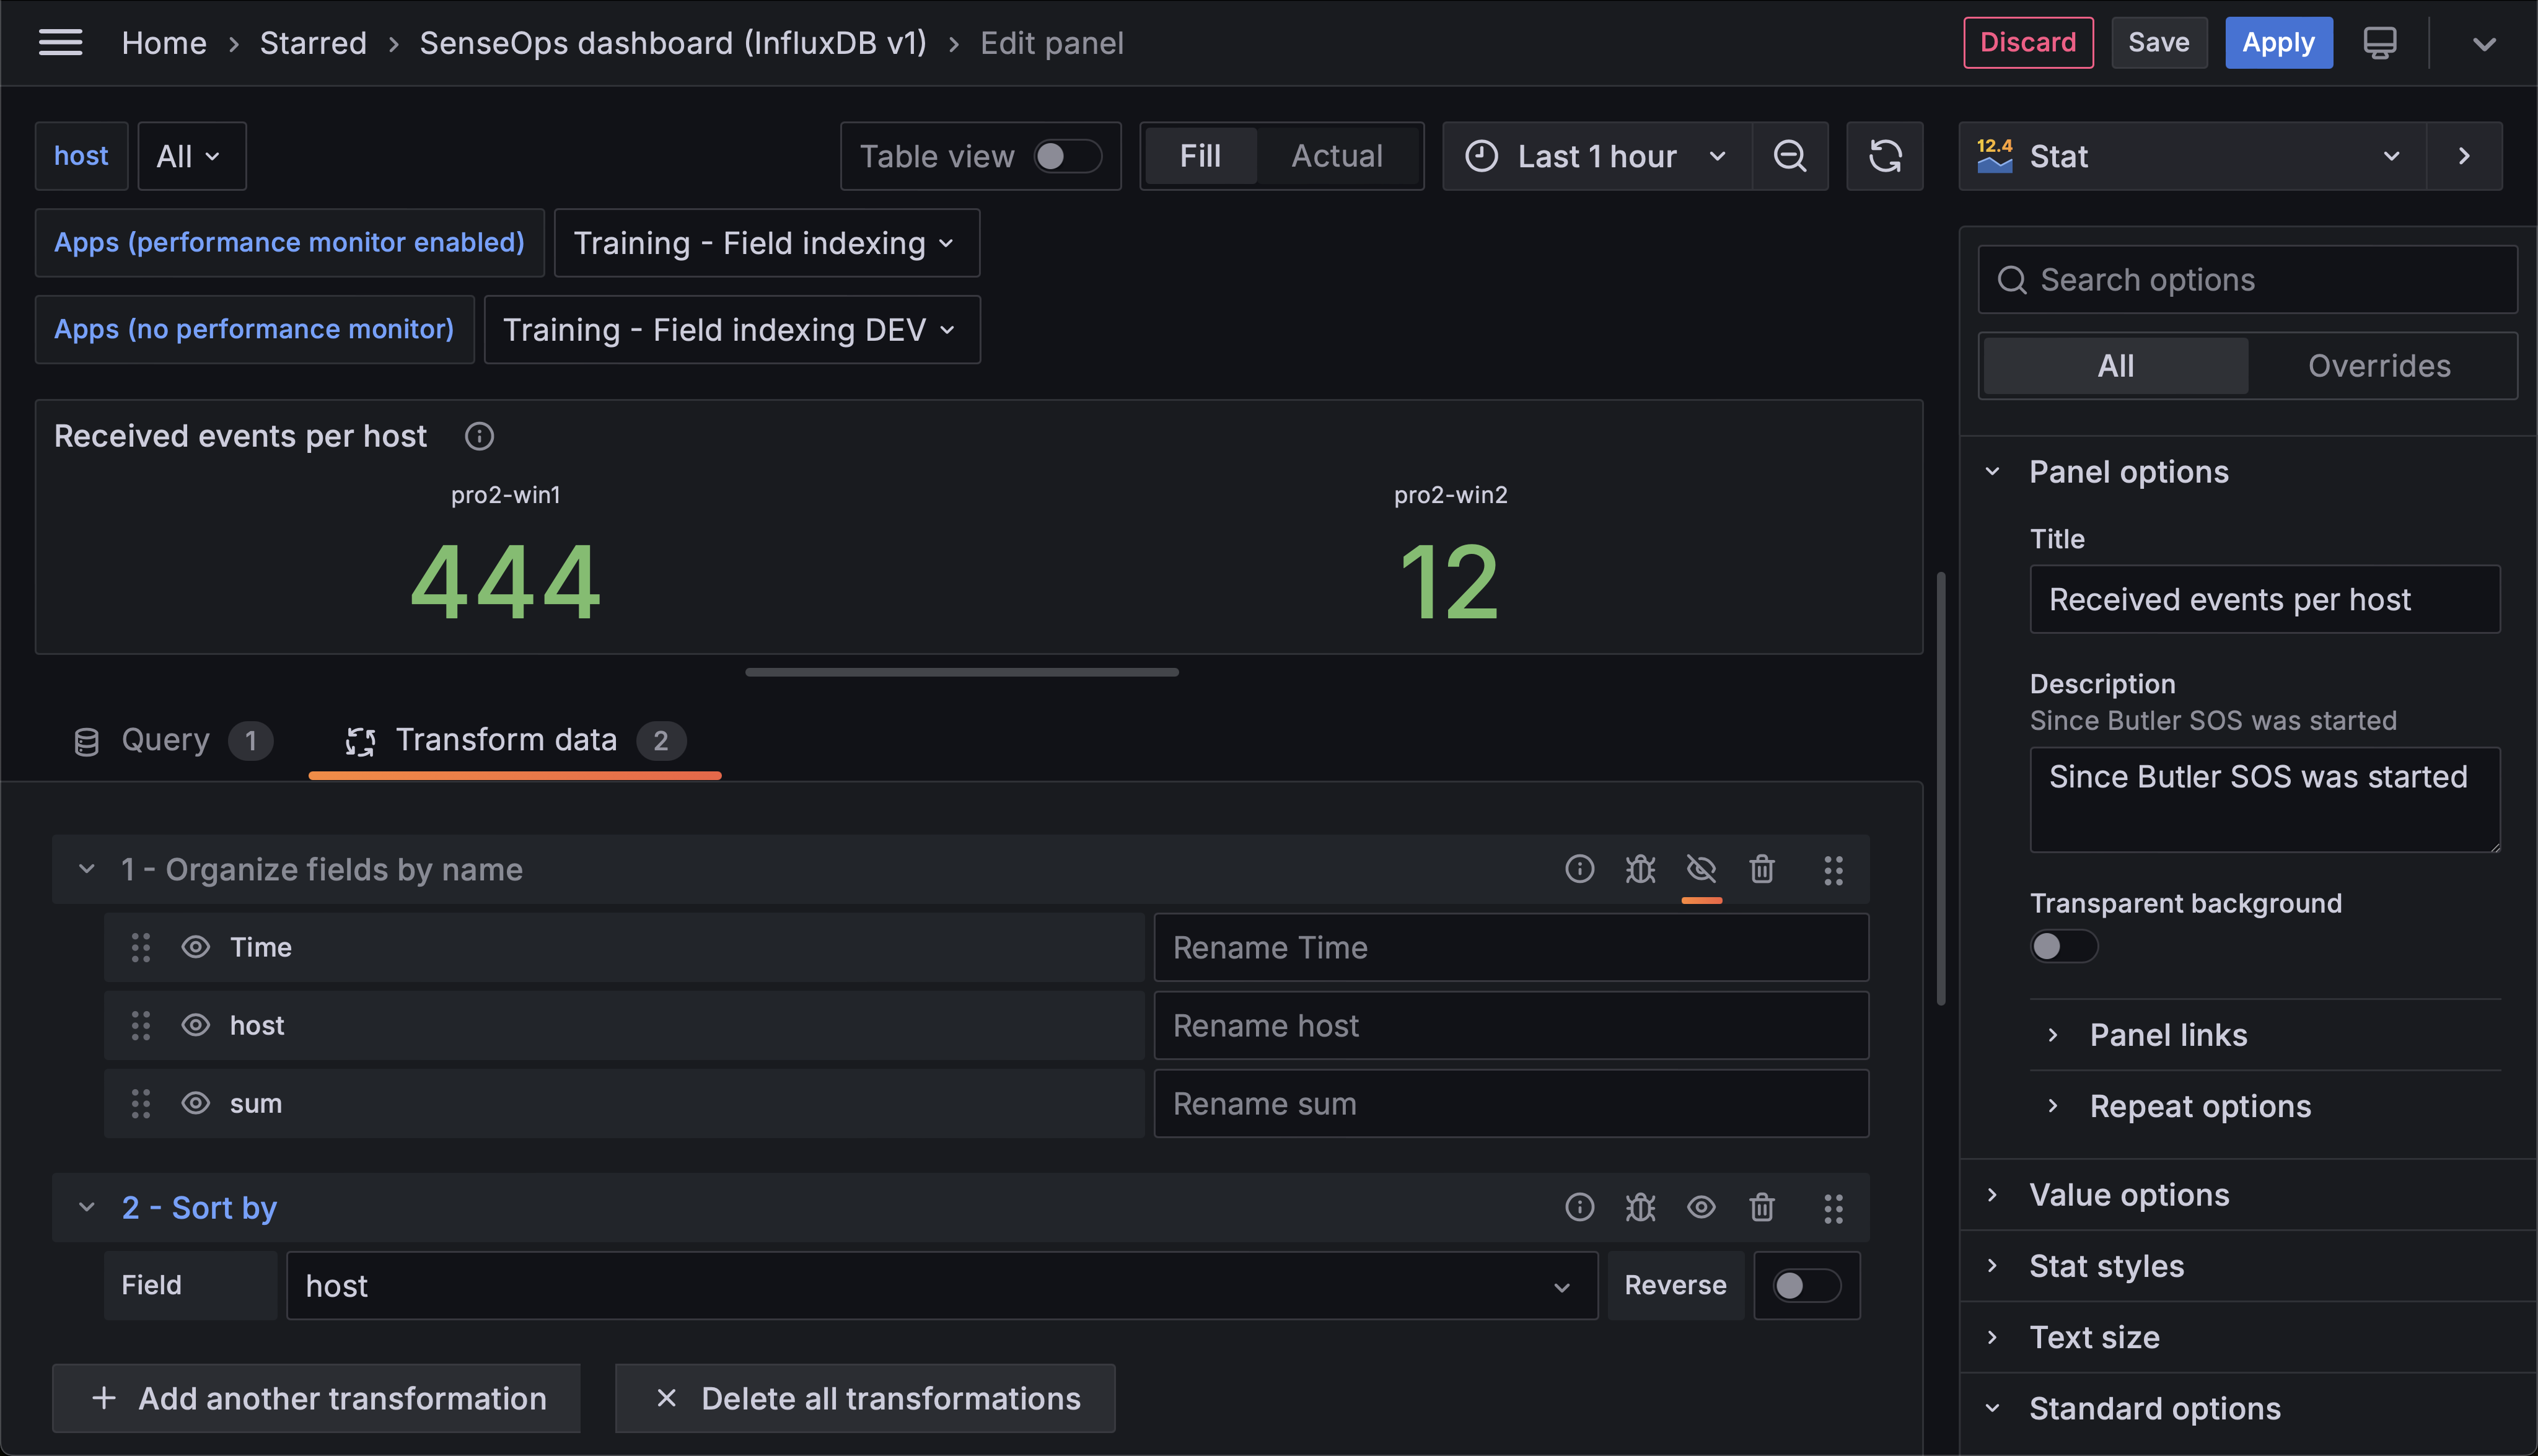 Transformations applied to the data before it's displayed in the Grafana panel.
Count of user and log events per event type
The lower left panel breaks down events by type.
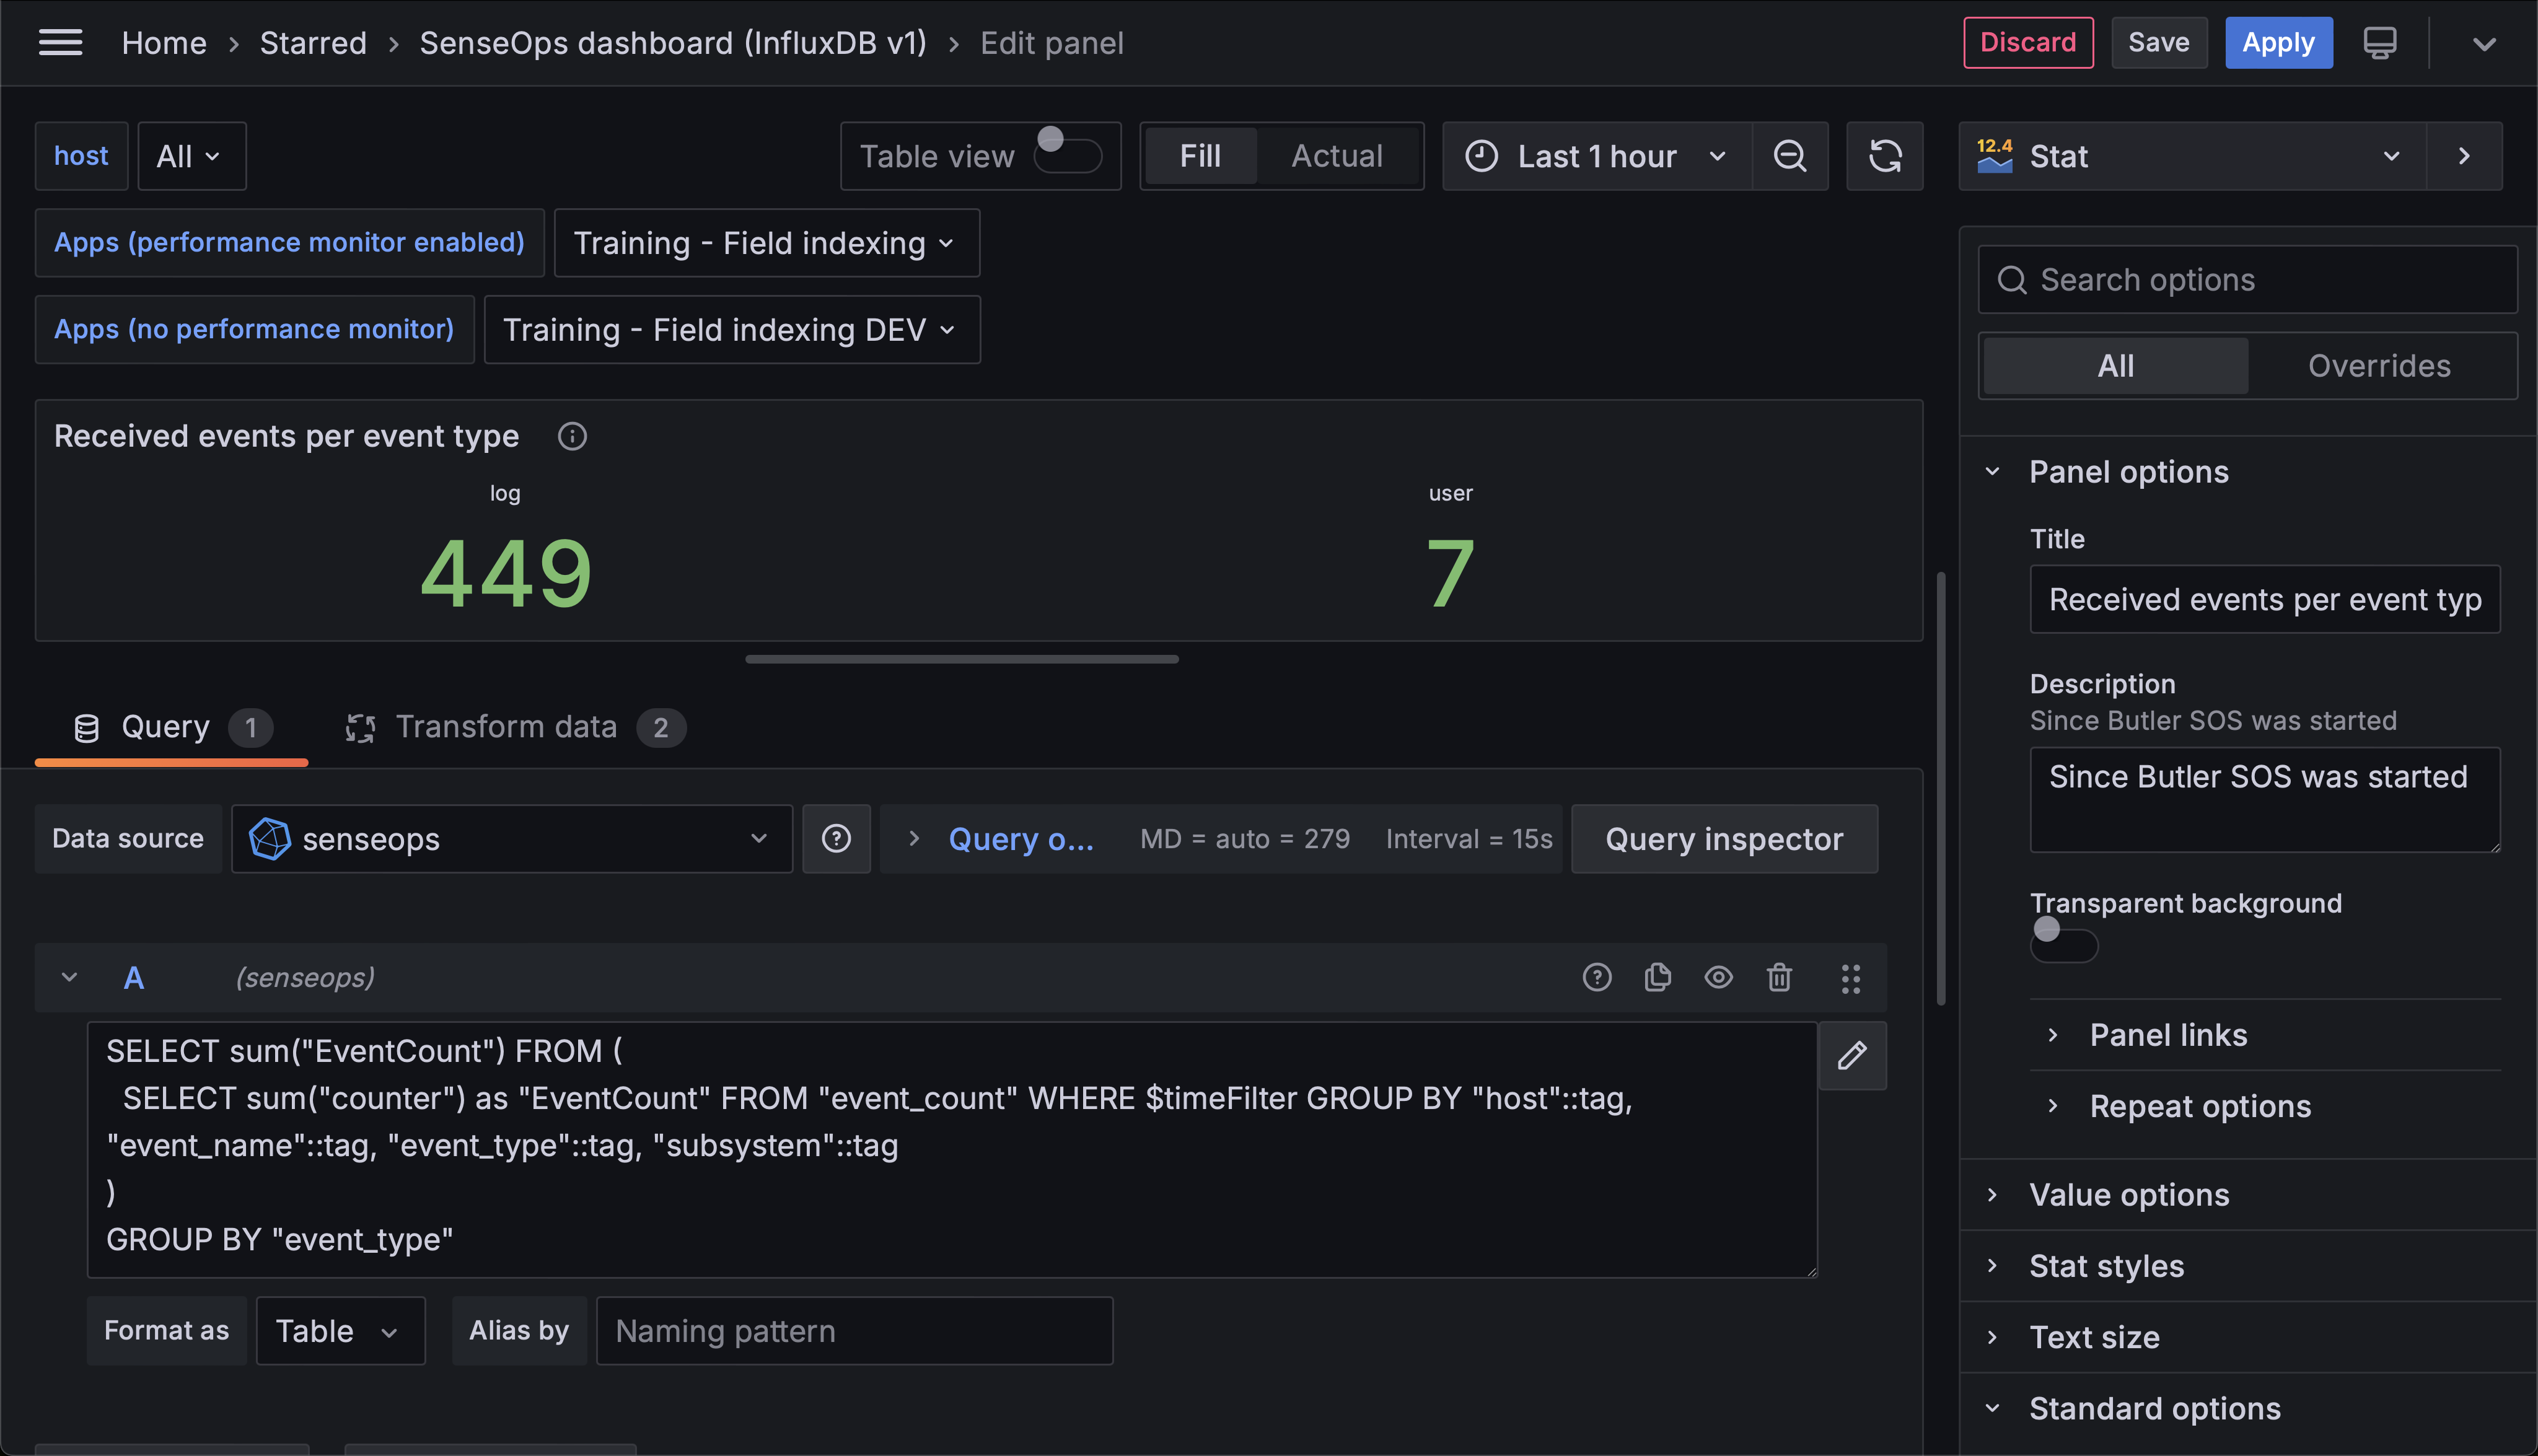 Count of user and log events per event type.
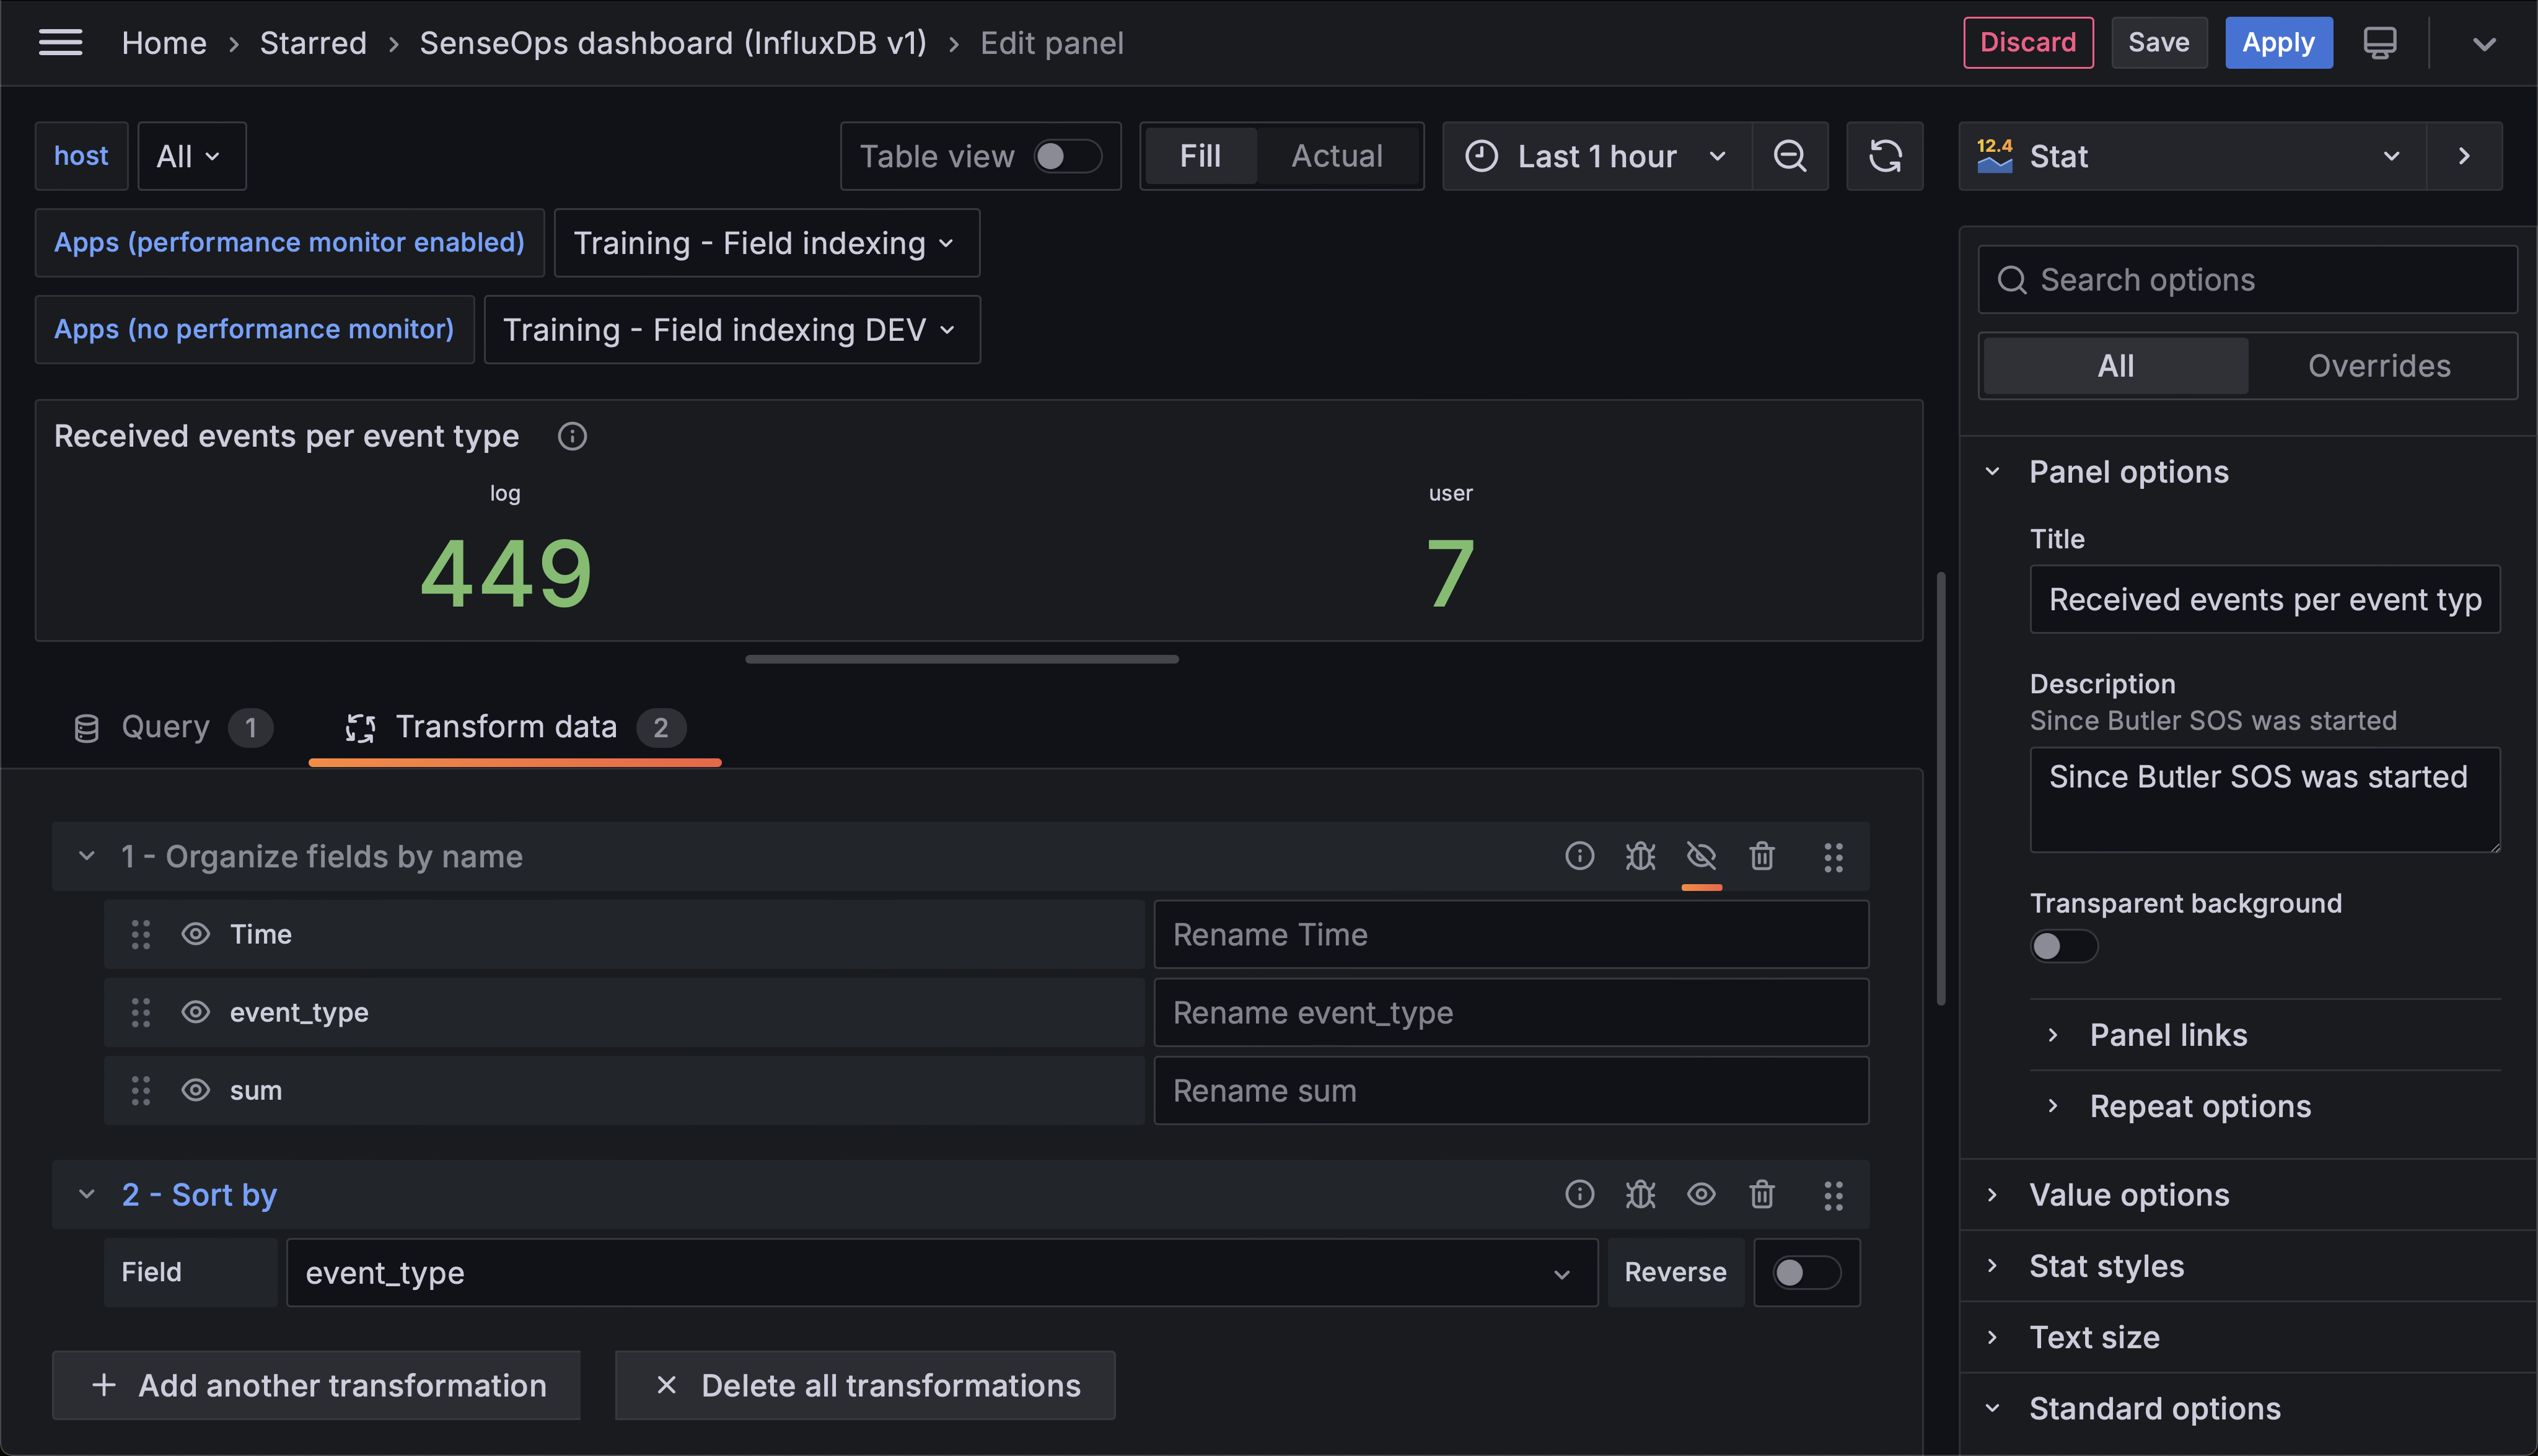 Transformations applied to the data before it's displayed in the Grafana panel.
Table of received events
A table view shows event counts per event type, host, Sense service/source and subsystem.
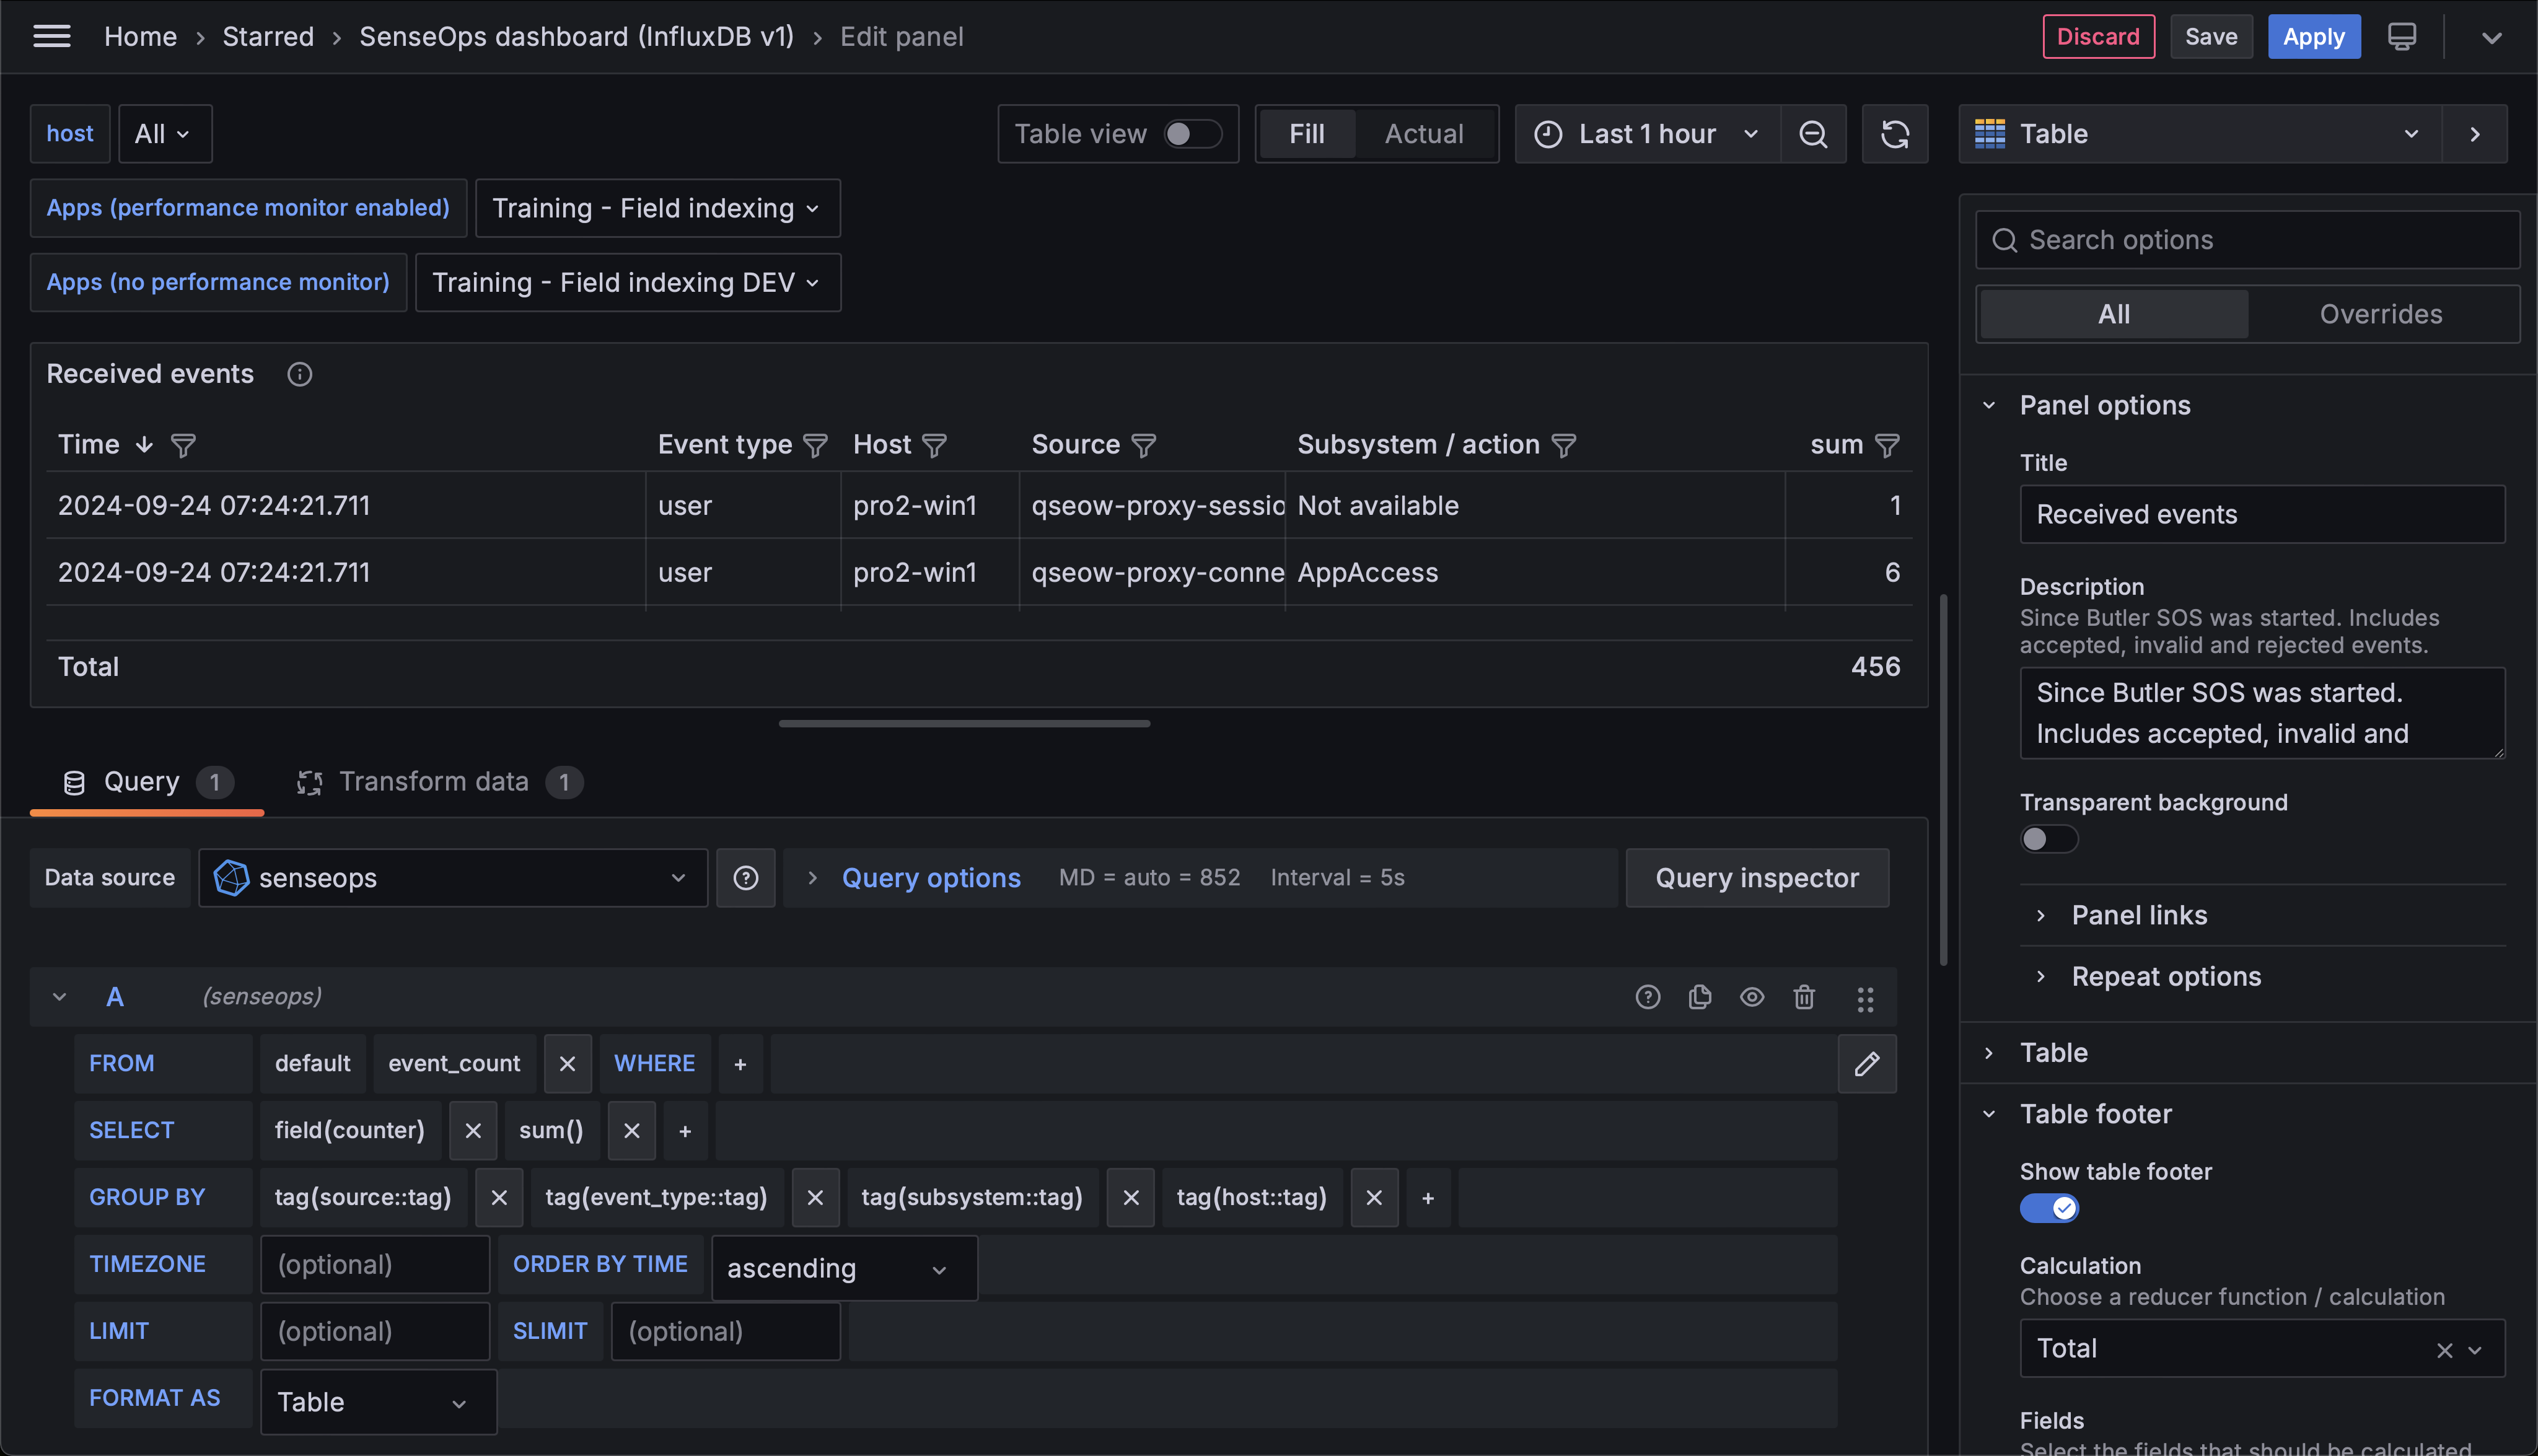 Table of received events and event count per event type, host, Sense service/source and subsystem.
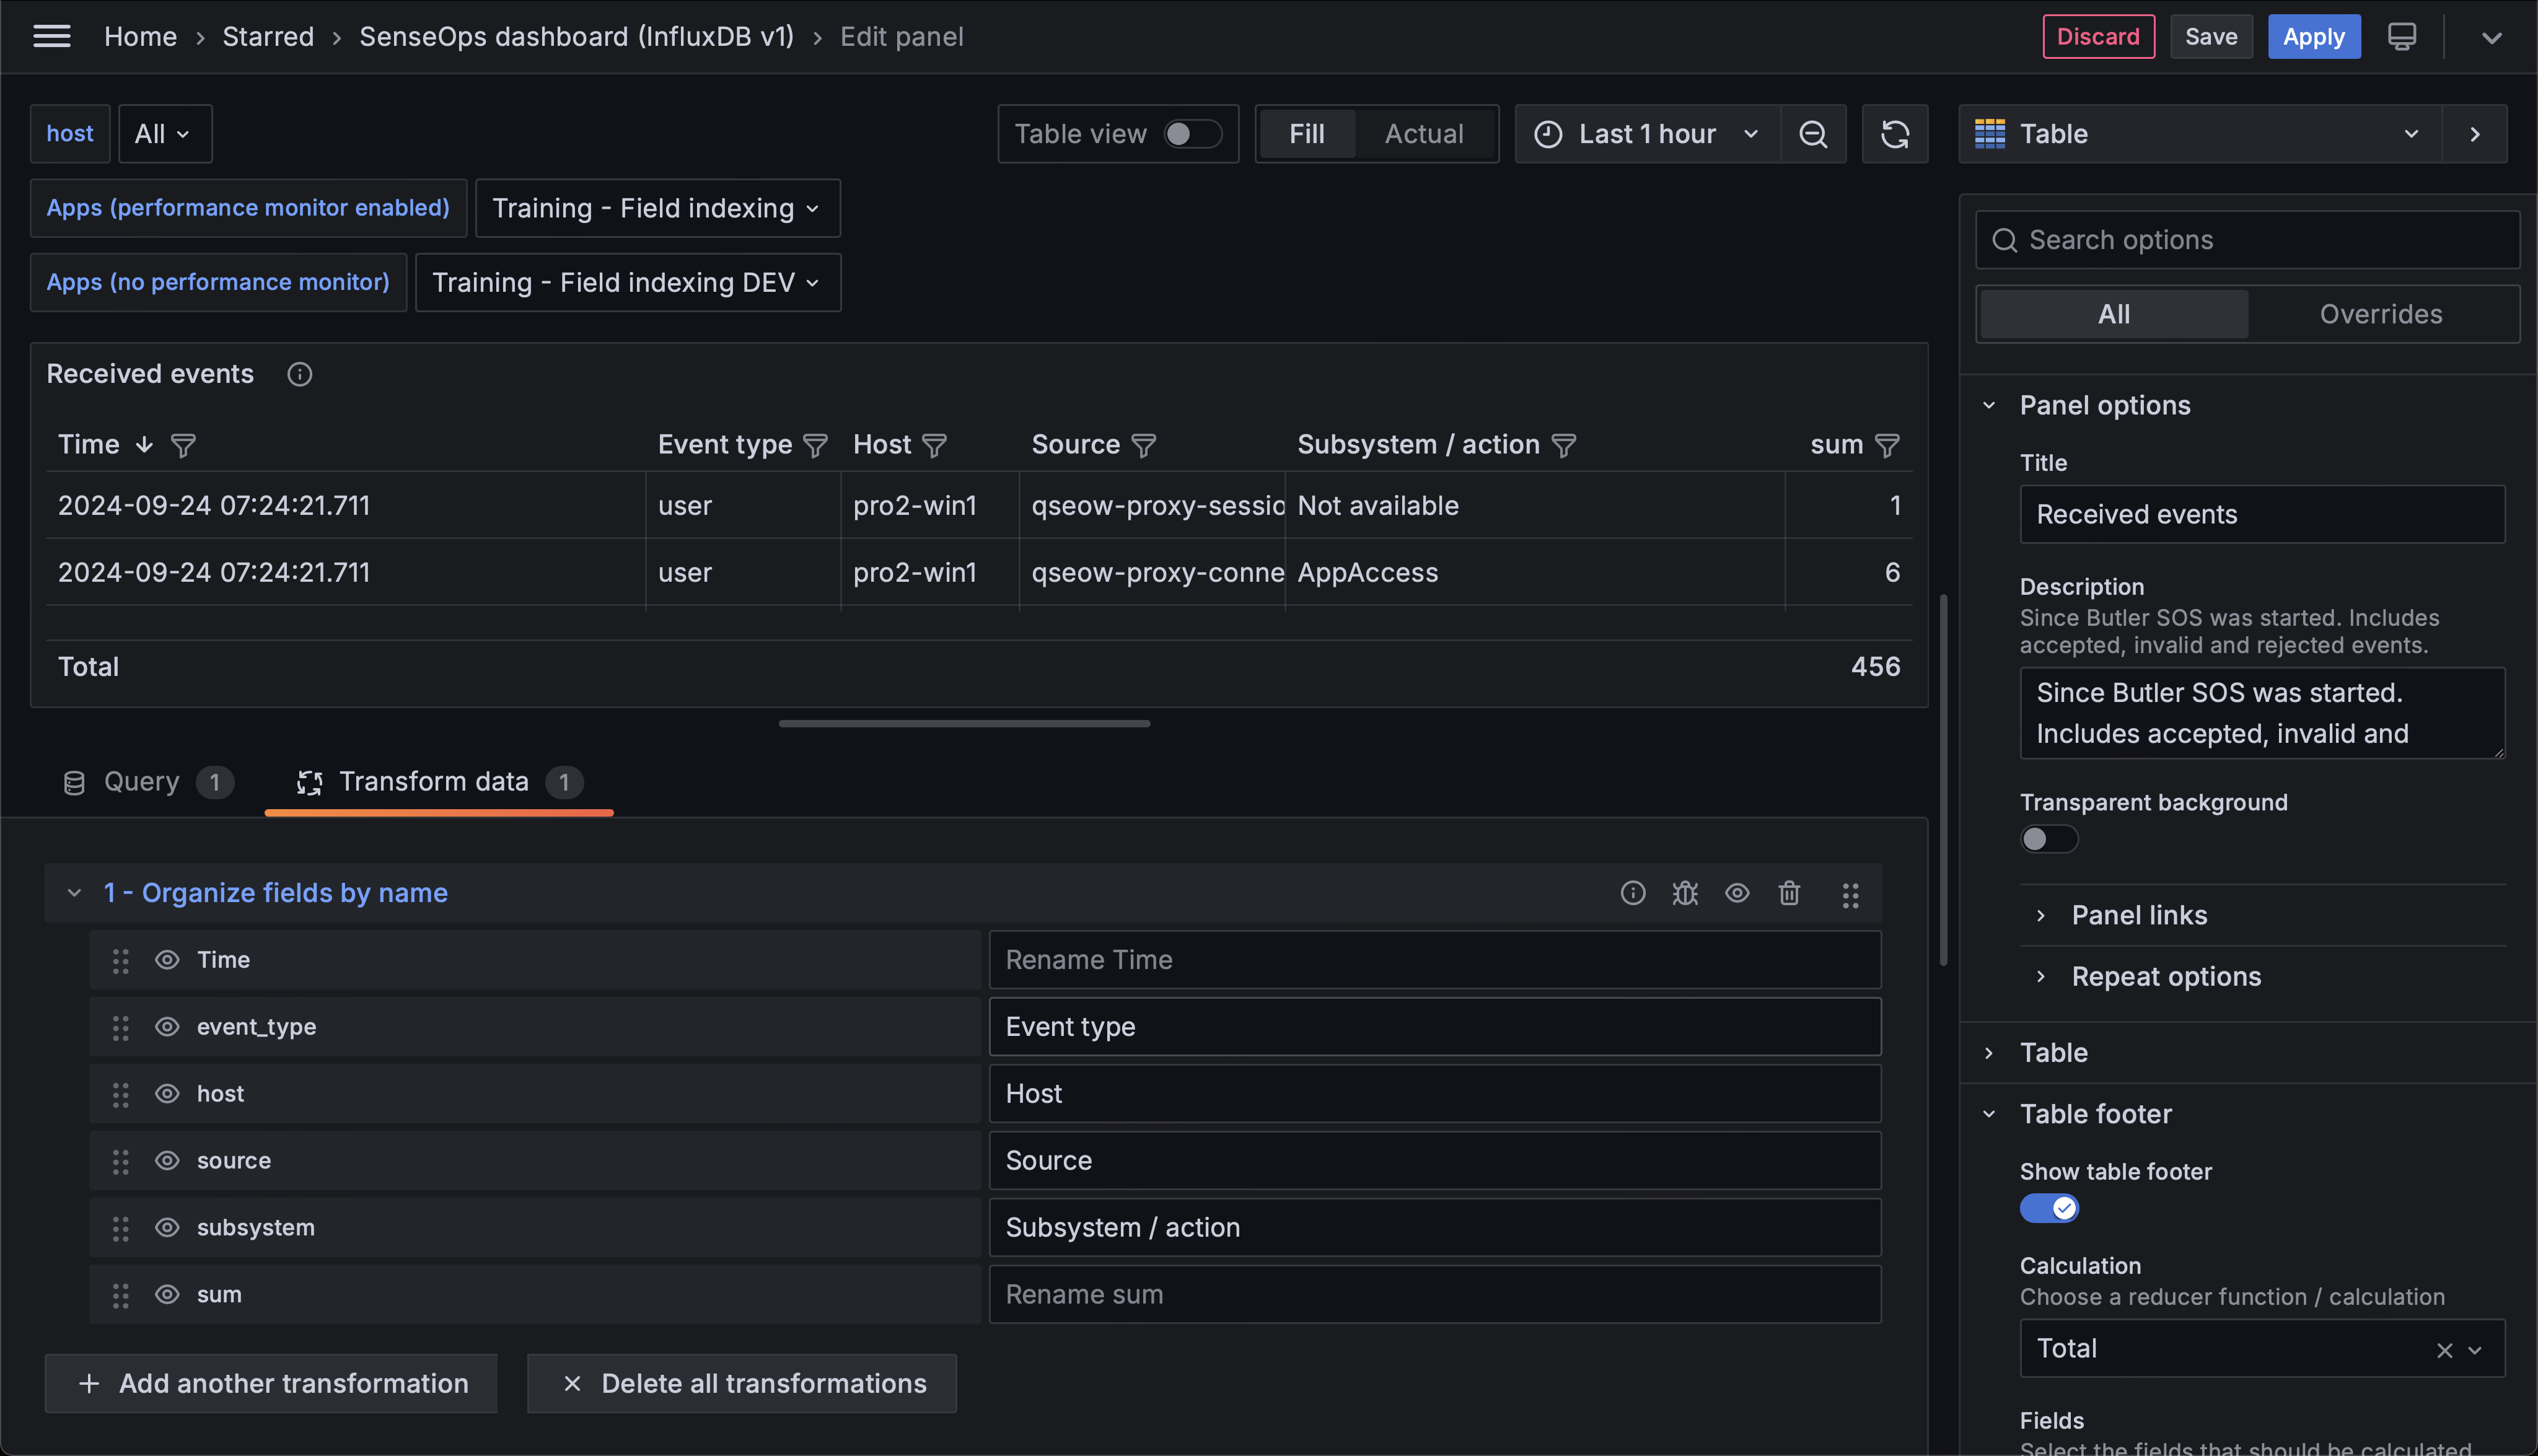 Transformations applied to the data before it's displayed in the Grafana panel.
Next Steps
- Learn about engine performance monitoring for more detailed app-level monitoring
- Explore Grafana dashboards for more visualization examples
- Review the available metrics to understand what data is available