Grafana 8 Dashboard
With version 8, Grafana further establishes its position as the leading open source platform for observability and real-time dashboards.
Butler SOS takes advantage of this, with a comprehensive monitoring dashboard.
Dashboard file
The screenshots below are taken from the Grafana 8 demo dashboard that's included in the Butler SOS repository.
Feel free to modify it to your specific needs.
Dashboard Installation
The dashboard file senseops_v7_0_dashboard.json was created using Butler SOS 7.0 and Grafana 8. It uses the new chart, data transformation and alerting features that were introduced in Grafana 8.
Sample dashboards are available in the Git repository. Before importing these to Grafana you should create a Grafana data source called "senseops", and point it to your InfluxDB database.
Dashboard Sections
Overview Metrics
The dashboard has a top section that's always expanded. A set of (by default) collapsed sections contain different kinds of metrics and log events.
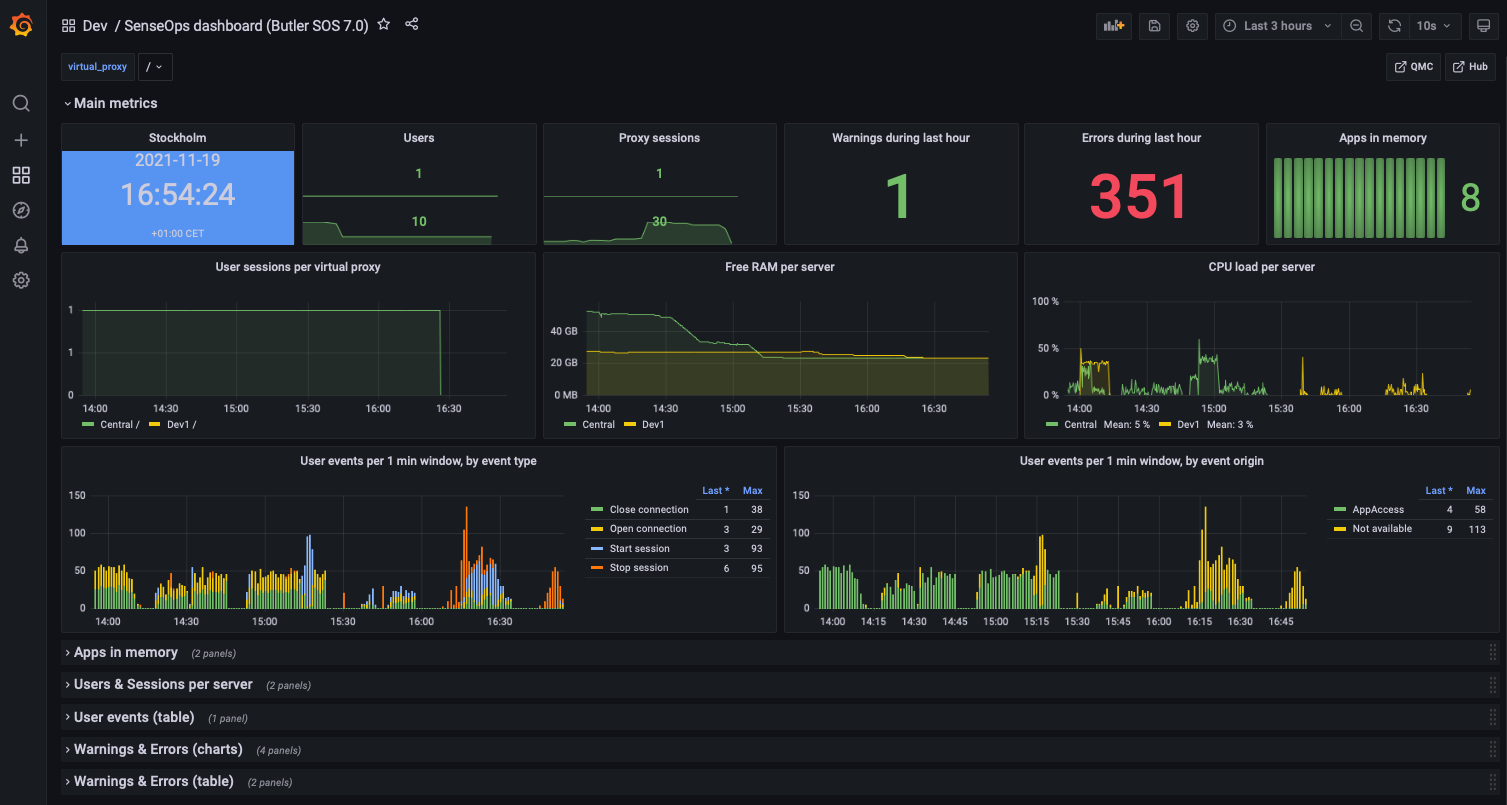 Top level metrics
Low memory alerts can be set using Grafana's alert feature. Such alerts can be sent as notifications to Slack, Teams, Pager Duty, email, etc.
Apps in Memory
From a sysadmin perspective it's often interesting to know what apps are loaded into memory on each Sense server.
For example, when a server is quickly losing RAM it's extremely useful to be able to zoom in to the very minute when the RAM drop occurs, then look at what apps were present in memory. One of those apps is probably not well designed, or is at least using a lot of memory.
The dashboard separates:
- Regular apps
- Session apps
You can also use Grafana's standard filtering features to narrow down on the server(s) of interest.
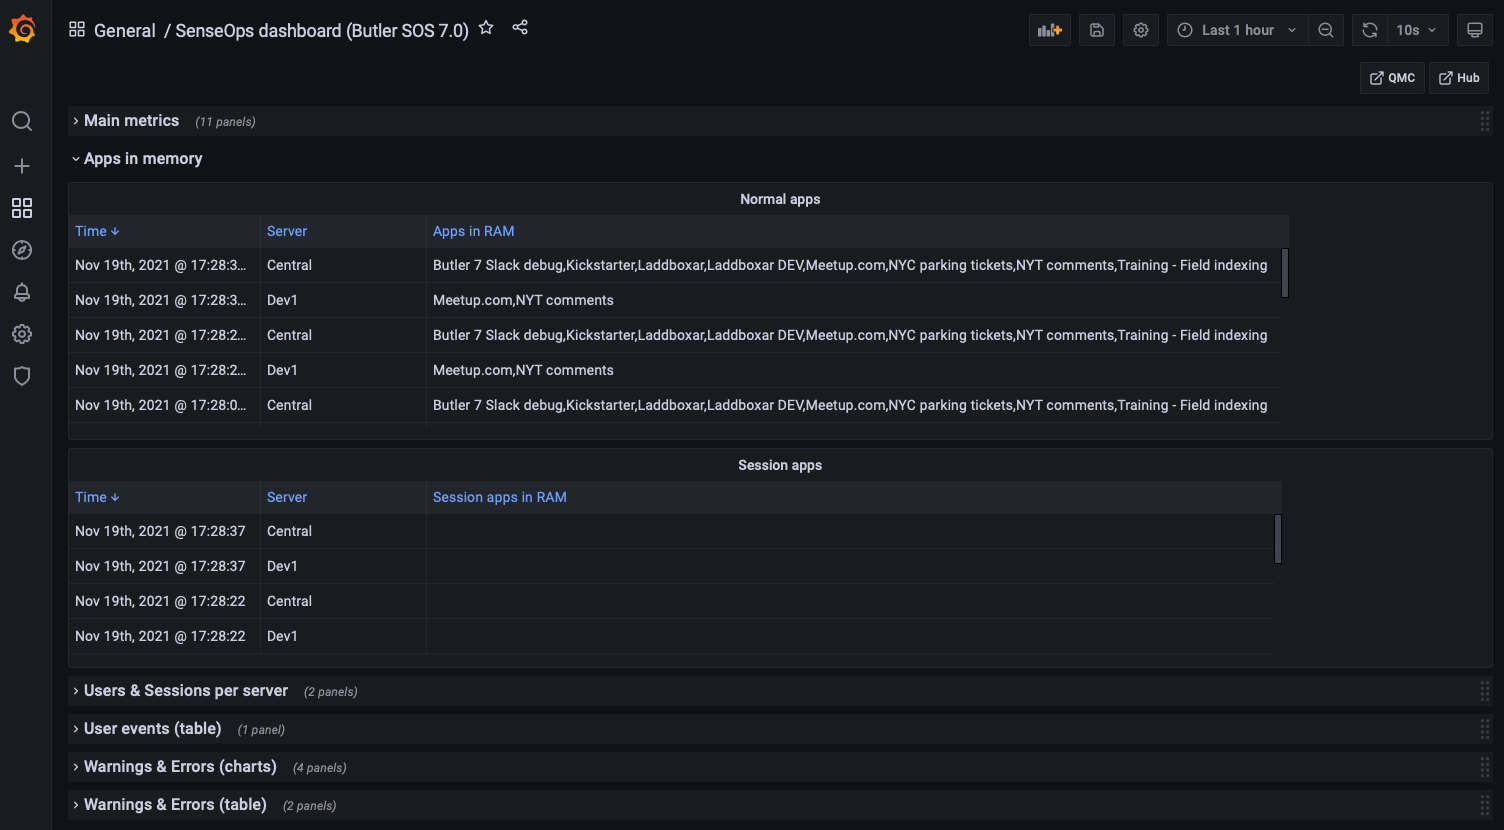 Apps loaded into memory
Users & Sessions per Server
If things really go wrong in a Qlik Sense Enterprise environment, connected users might be kicked out. It's important to know:
- How many users are connected at any time
- Detect sudden drops in user count
Another use case is maintenance windows: You want to know how many - and which - users are connected, so you can send them a message that maintenance is about to start.
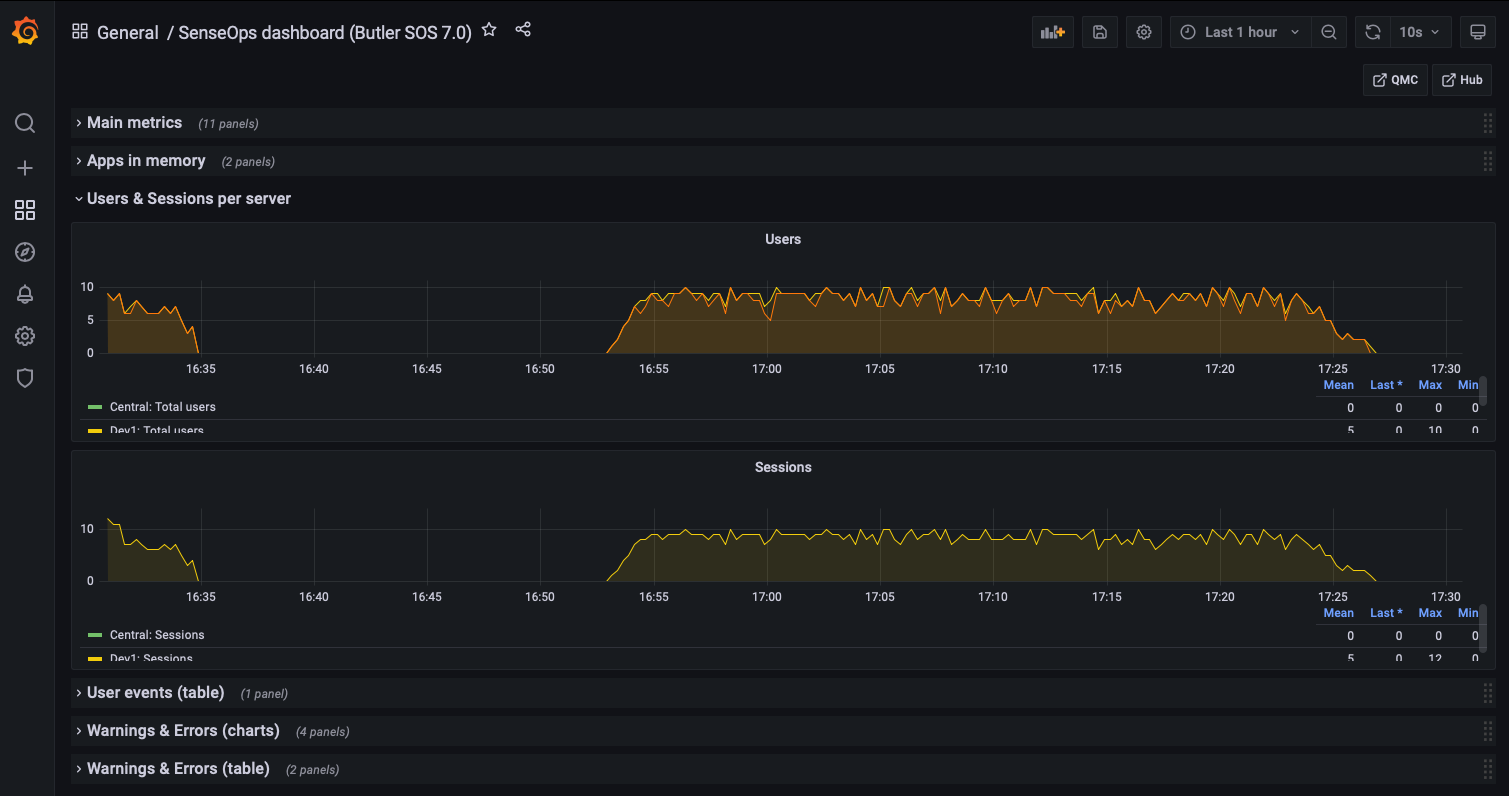 Users and sessions per server
User Events
If Butler SOS has been configured to handle user level events coming from Sense, these are shown here.
You get information about where the event took place and which user has:
- Logged in (started a session)
- Logged out (stopped a session)
- Timed out (stopped a session)
- Opened a connection to a new app
- Closed a connection to an app (for example closed a browser tab)
- ...and more
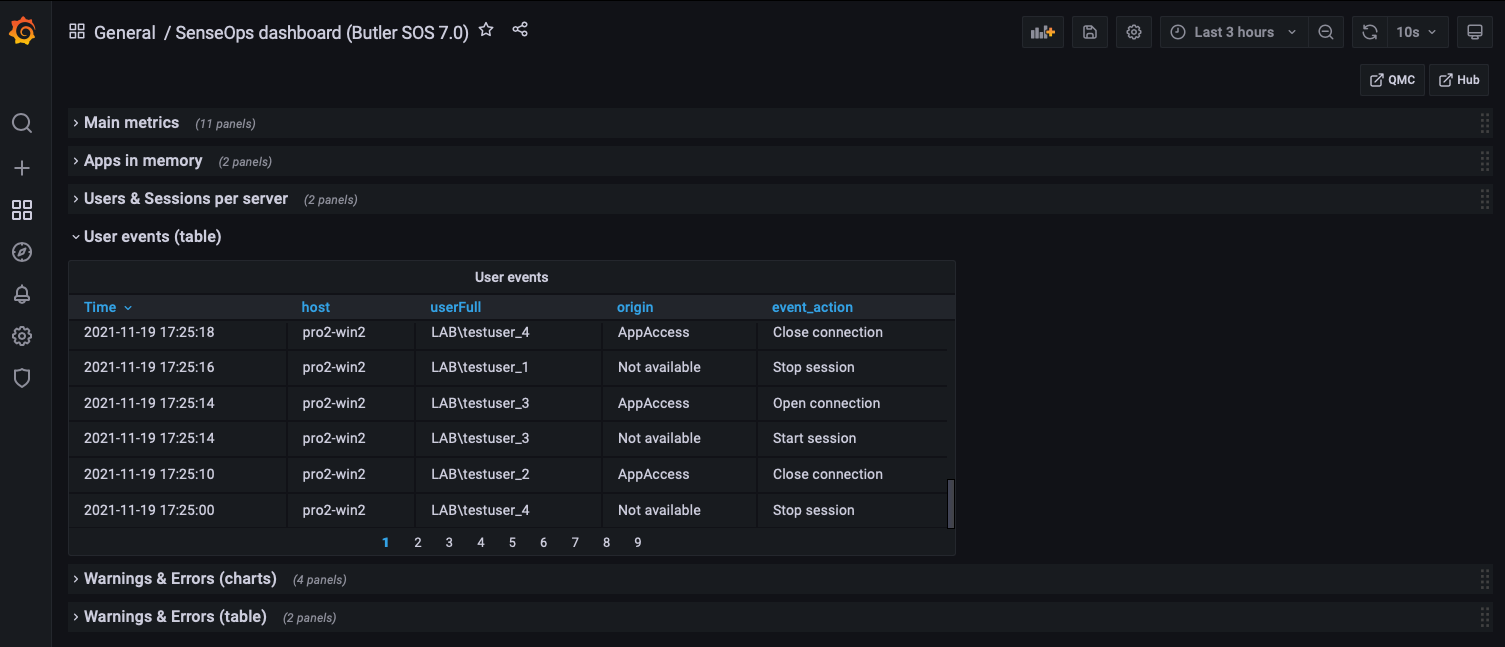 User events
Warnings & Errors
Starting with Butler SOS 7, the source of warning and error data is the log events feature (replacing the older log db approach).
Some of this information is also available in the standard Operations Monitor app in Qlik Sense Enterprise, but only in a retrospective way. Having access to it in close to real time makes it possible to act on developing issues quicker.
Charts provide overview while tables give the actual messages, as they appear in the log files.
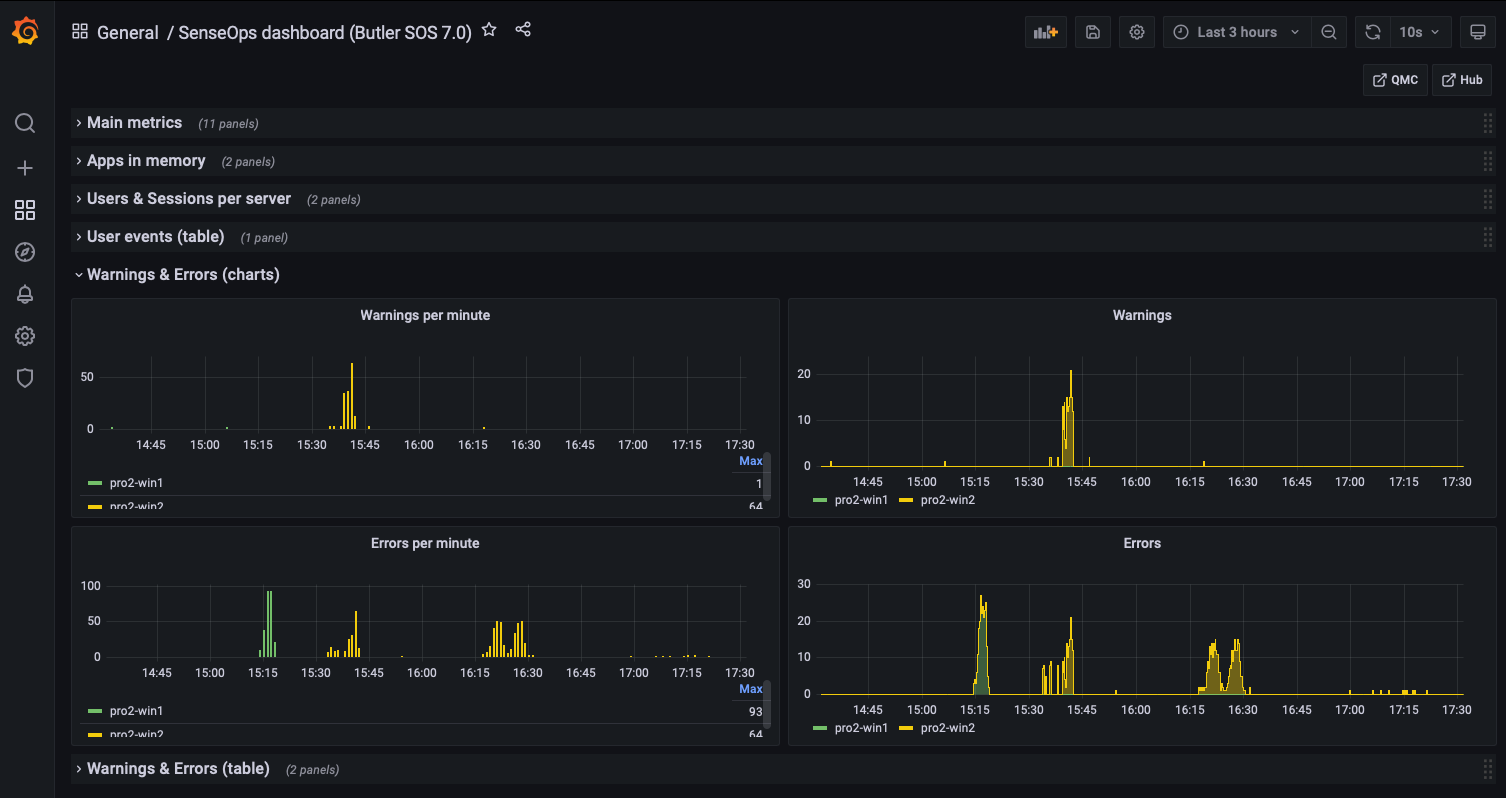 Error and warning charts
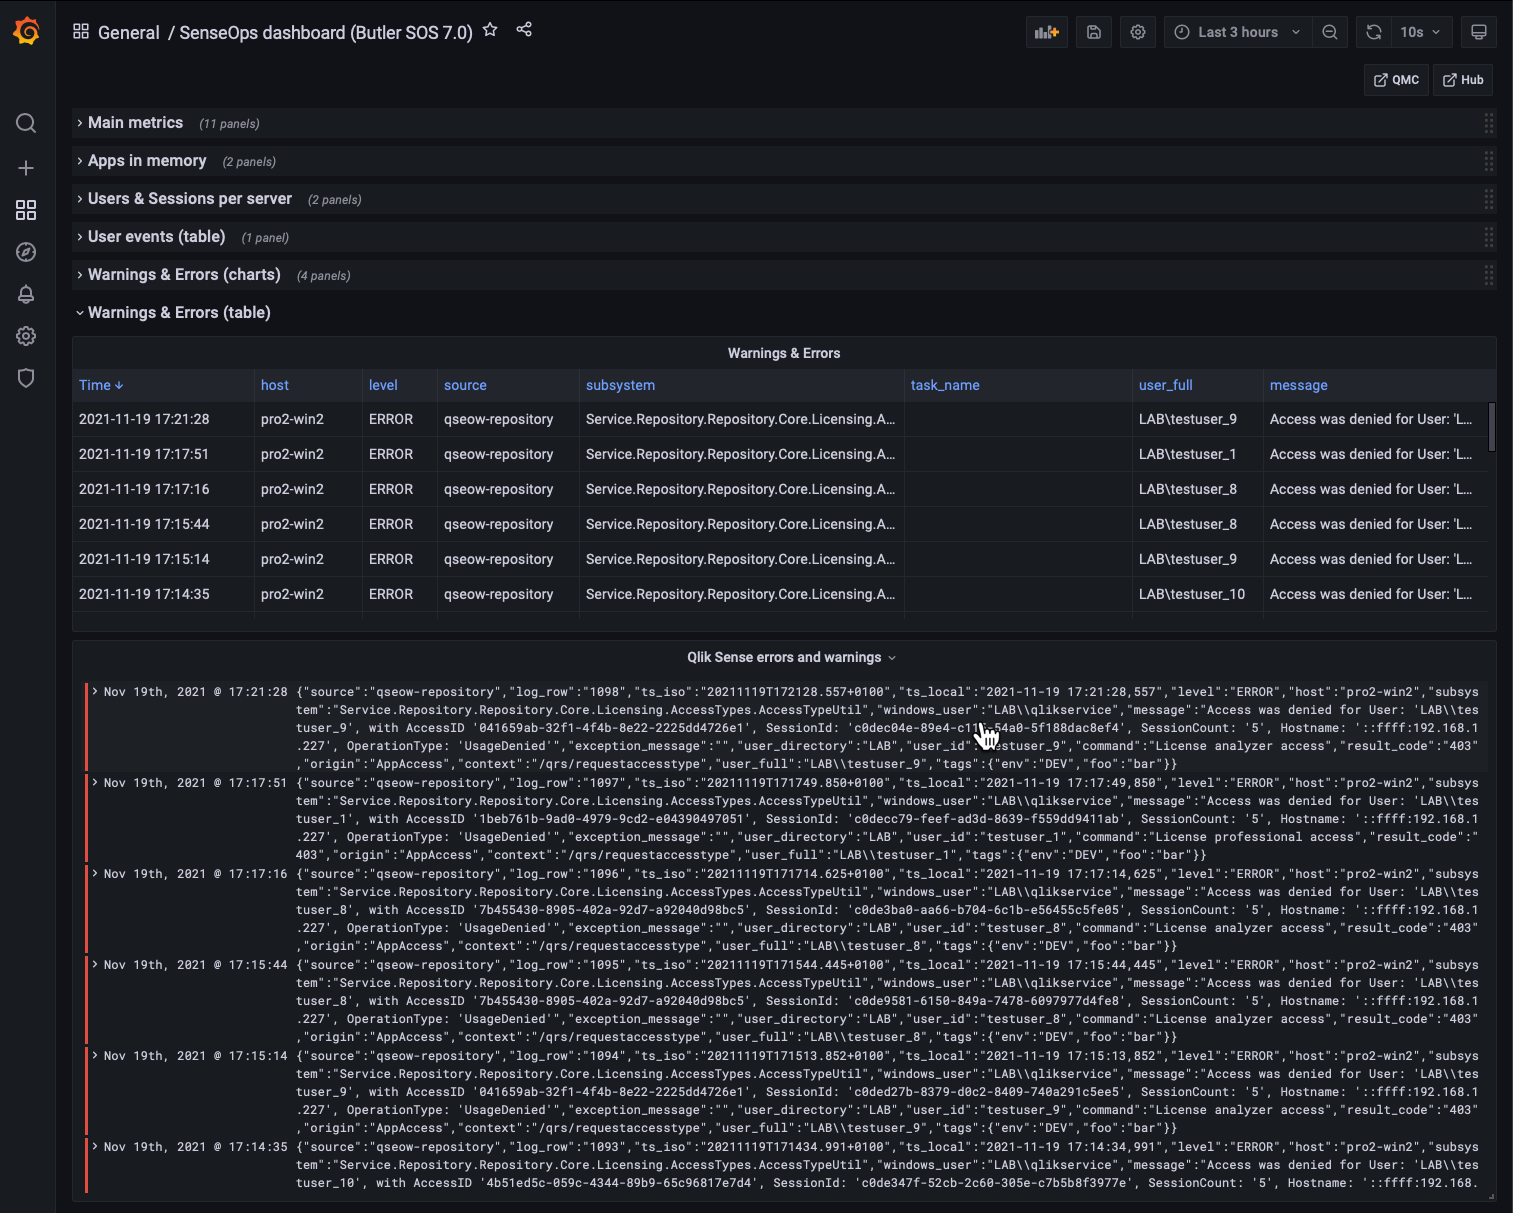 Error and warning tables
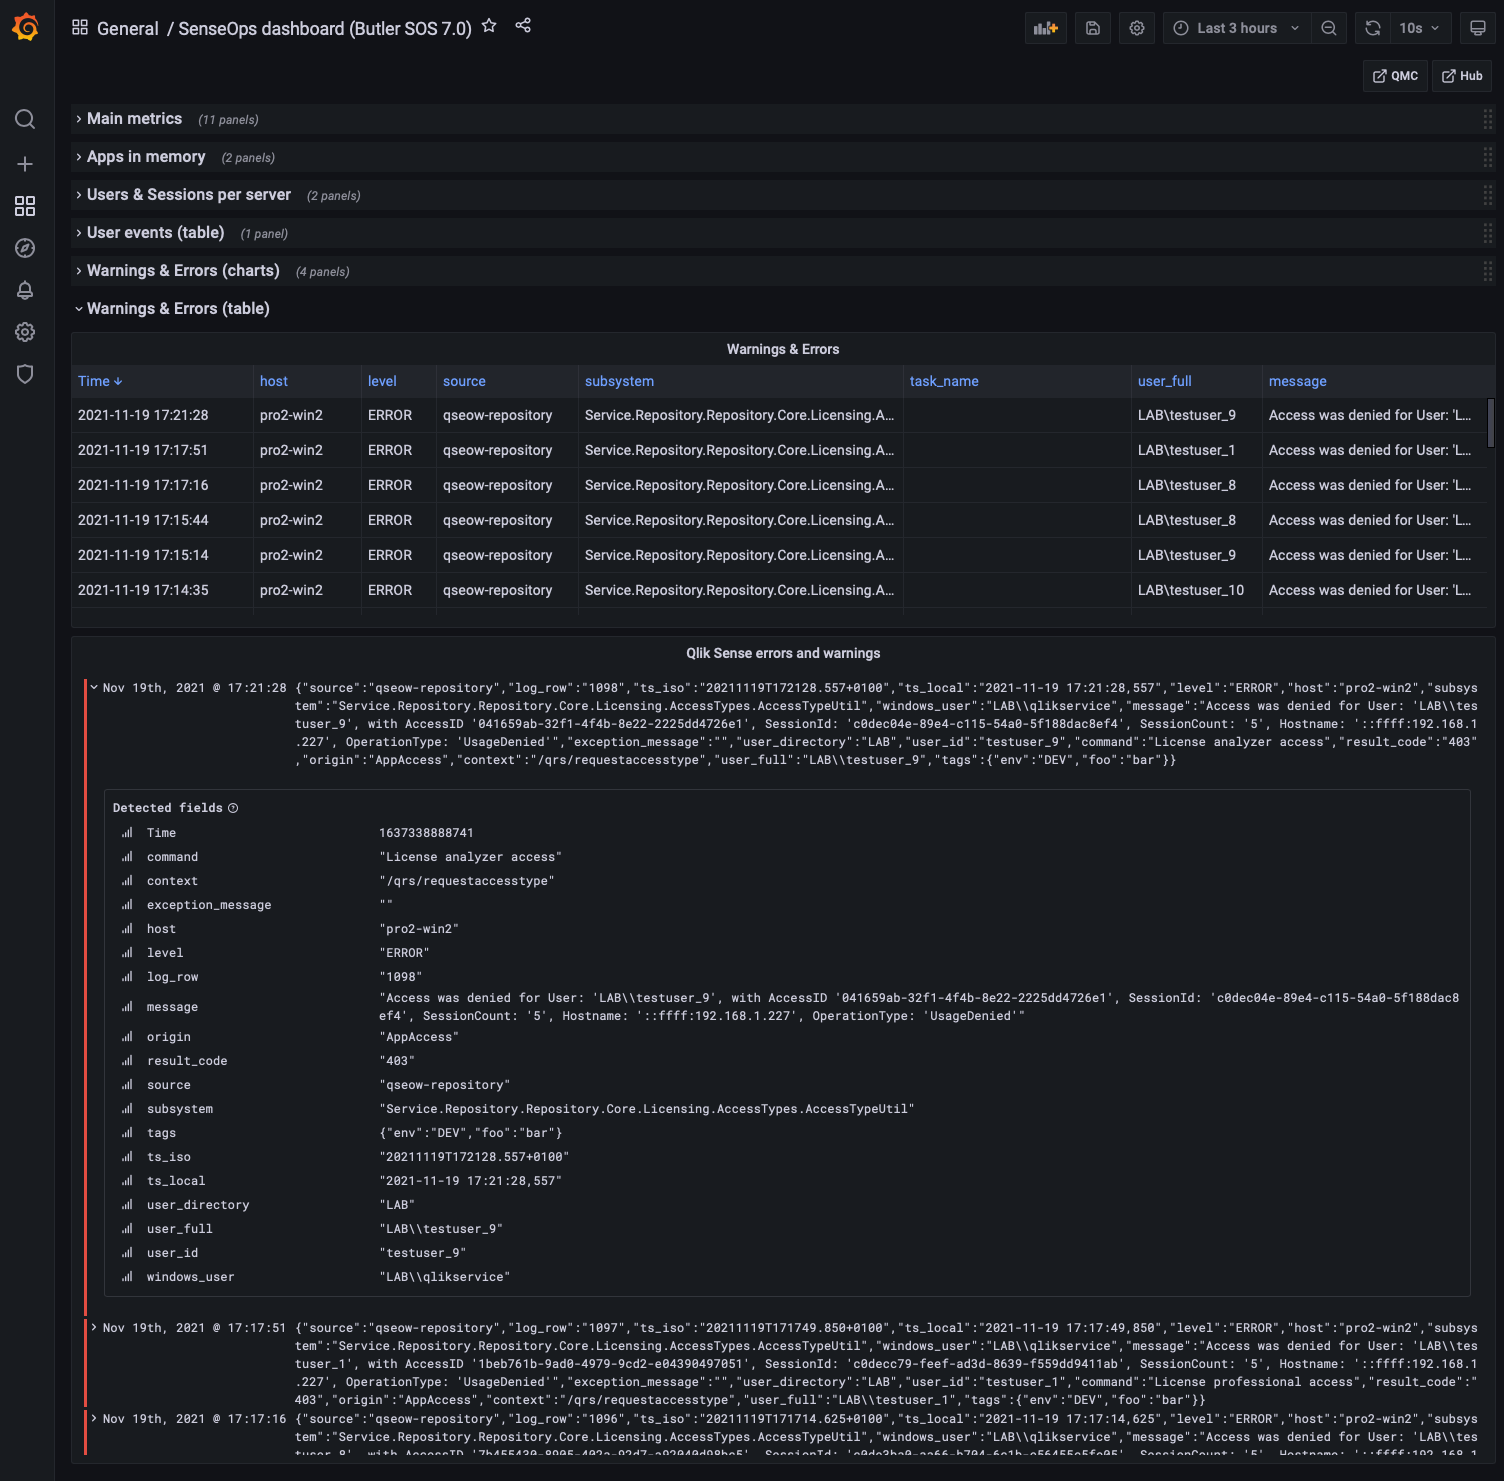 Detailed view into errors and warnings
Butler SOS Metrics
Butler SOS is very robust, but it may still be of interest to track its memory use, to make sure there aren't any memory leaks etc.
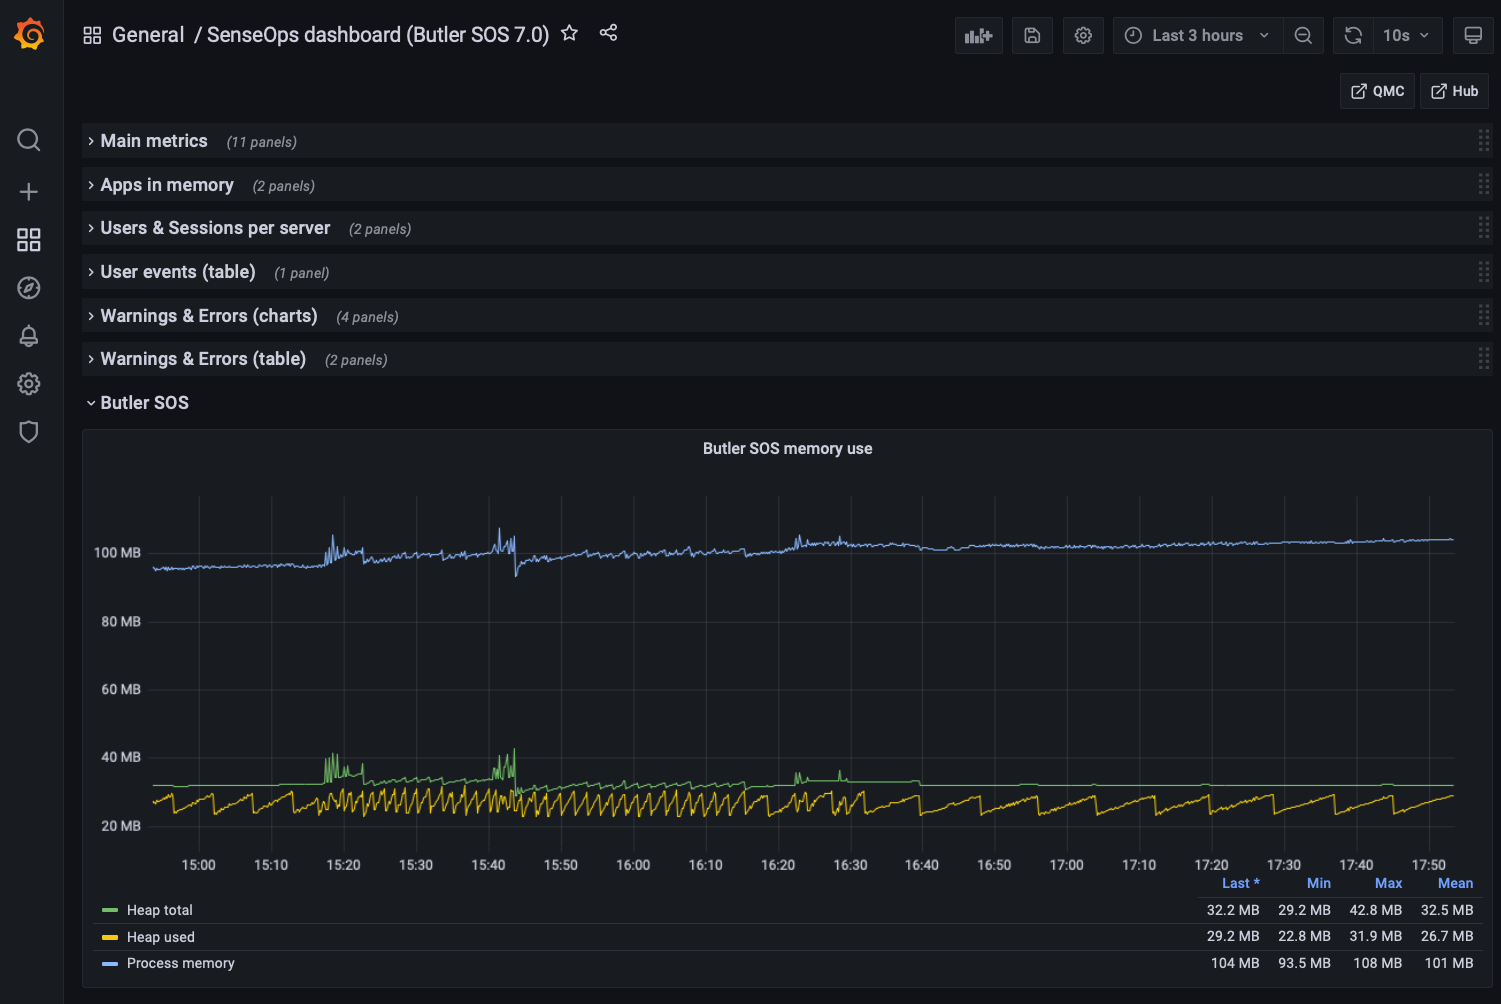 Butler SOS memory usage