Grafana 7 Dashboard
Grafana 7 is a big update when it comes to visualizations. Grafana was excellent already in version 6, but with v7 things are taken to a new level.
Dashboard file
The screenshots below are taken from the Grafana 7 sample dashboard included in the Butler SOS repository.
Feel free to modify it to your specific needs.
Dashboard Concepts
A concept that has proven useful many times is to use an overview dashboard to monitor high-level metrics for the entire Sense cluster. A separate, parameterized dashboard then drills into the details for each server.
Sample dashboards are available in the Git repository. Before importing these to Grafana you should create a Grafana data source called "SenseOps", and point it to your InfluxDB database.
Dashboard Sections
Overview Metrics
This view gives high level insights into the virtual proxies in your Sense environment, as well as top-level numbers on users and sessions.
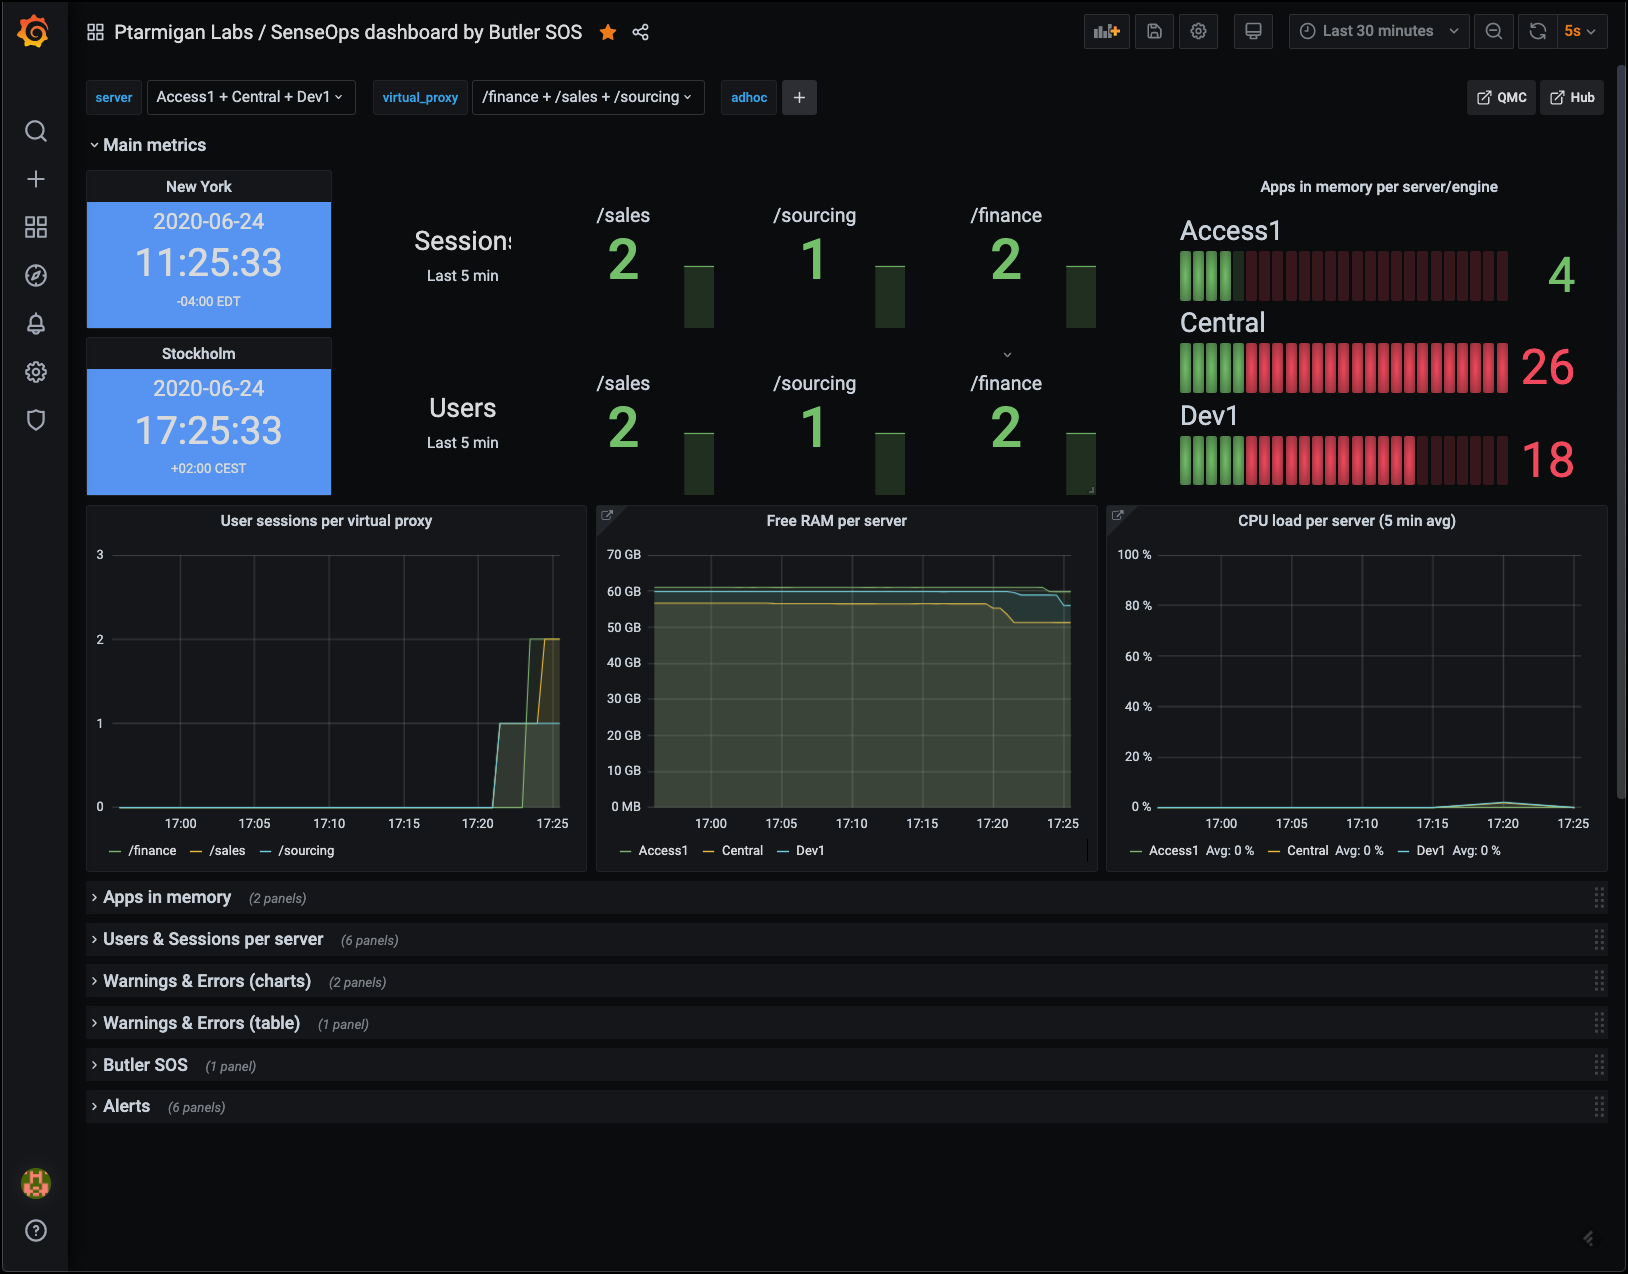 Top level metrics
Low memory alerts can be set using Grafana's alert feature. Such alerts can be sent as notifications to Slack, Teams, Pager Duty, email, etc.
Apps in Memory
From a sysadmin perspective it's often interesting to know what apps are loaded into memory on each Sense server.
Here you get the details broken down by:
- Regular apps
- Session apps
You can also use Grafana's standard filtering features to narrow down on the server(s) of interest.
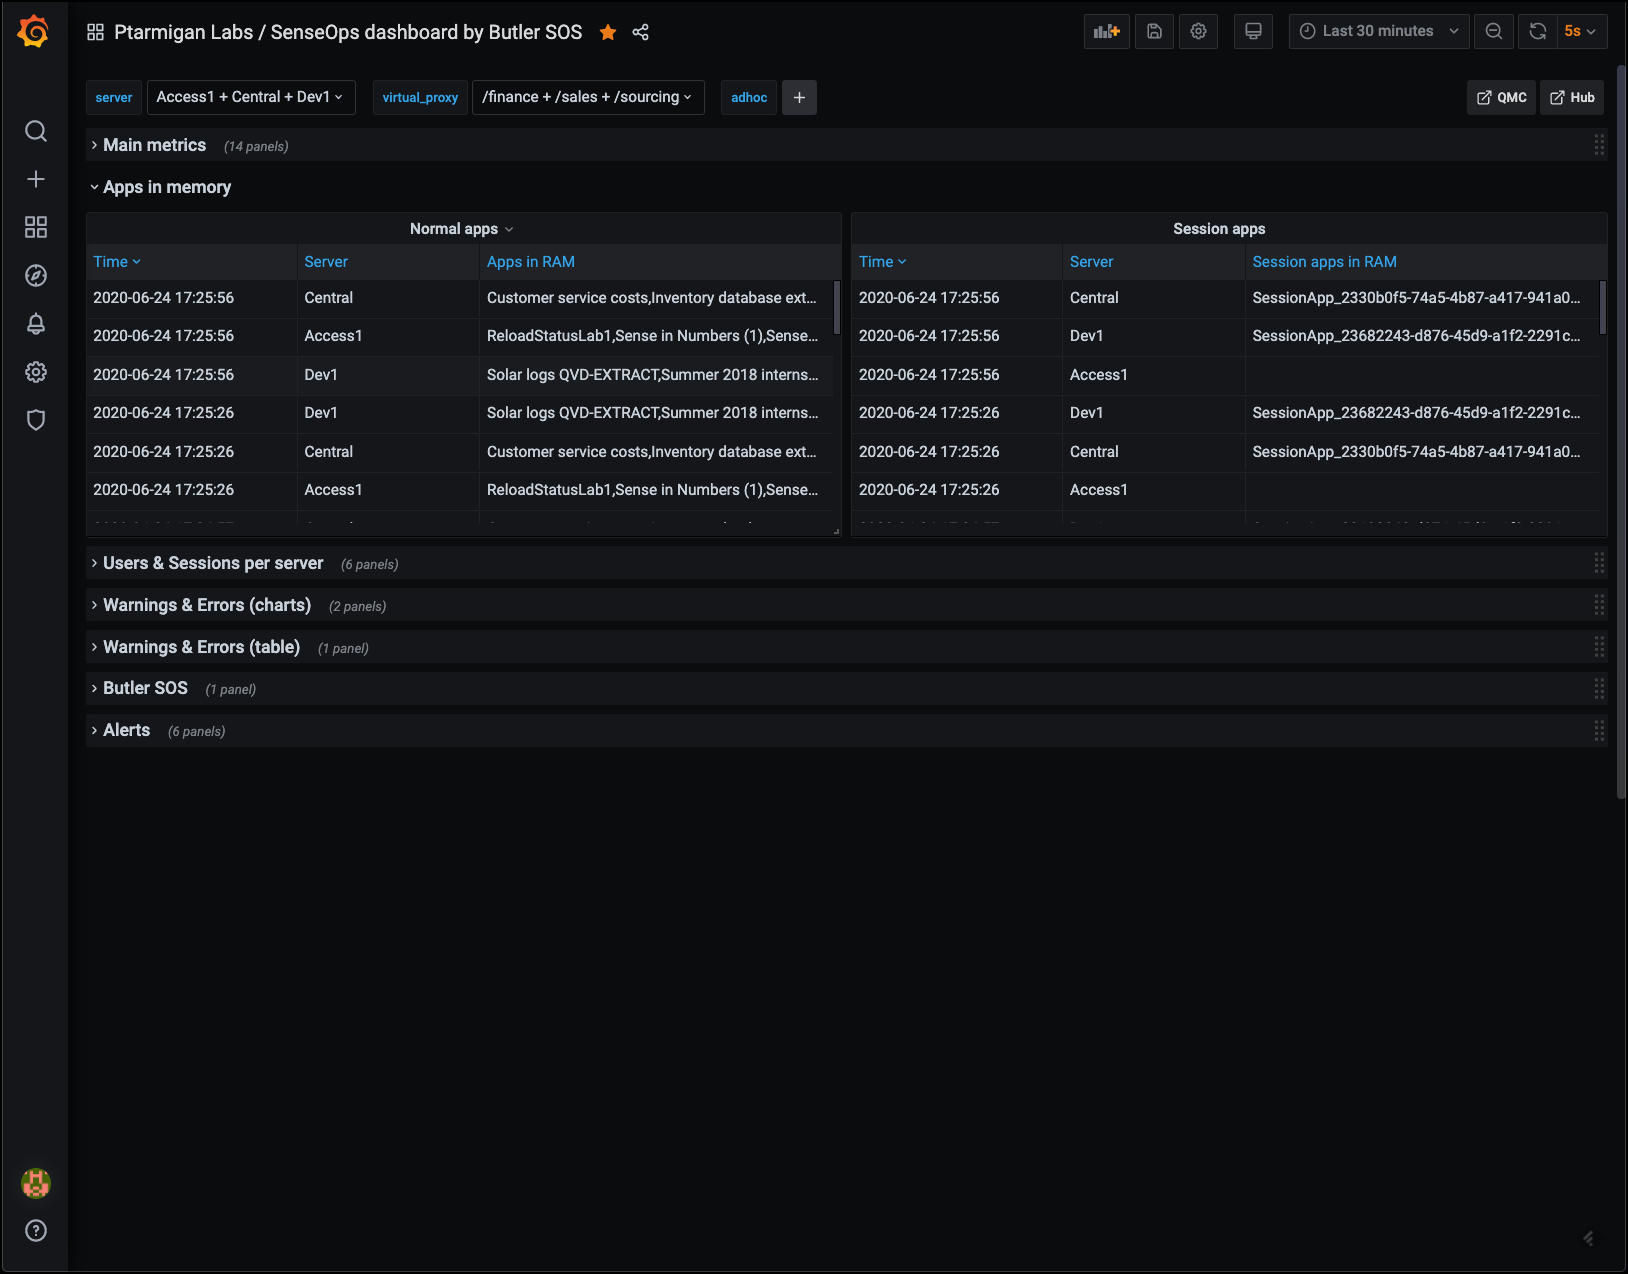 Apps loaded into memory
Users & Sessions per Server
If things really go wrong in a Qlik Sense Enterprise environment, connected users might be kicked out. It's important to know:
- How many users are connected at any time
- Detect sudden drops in user count
Another use case is maintenance windows: You want to know how many - and which - users are connected, so you can send them a message that maintenance is about to start.
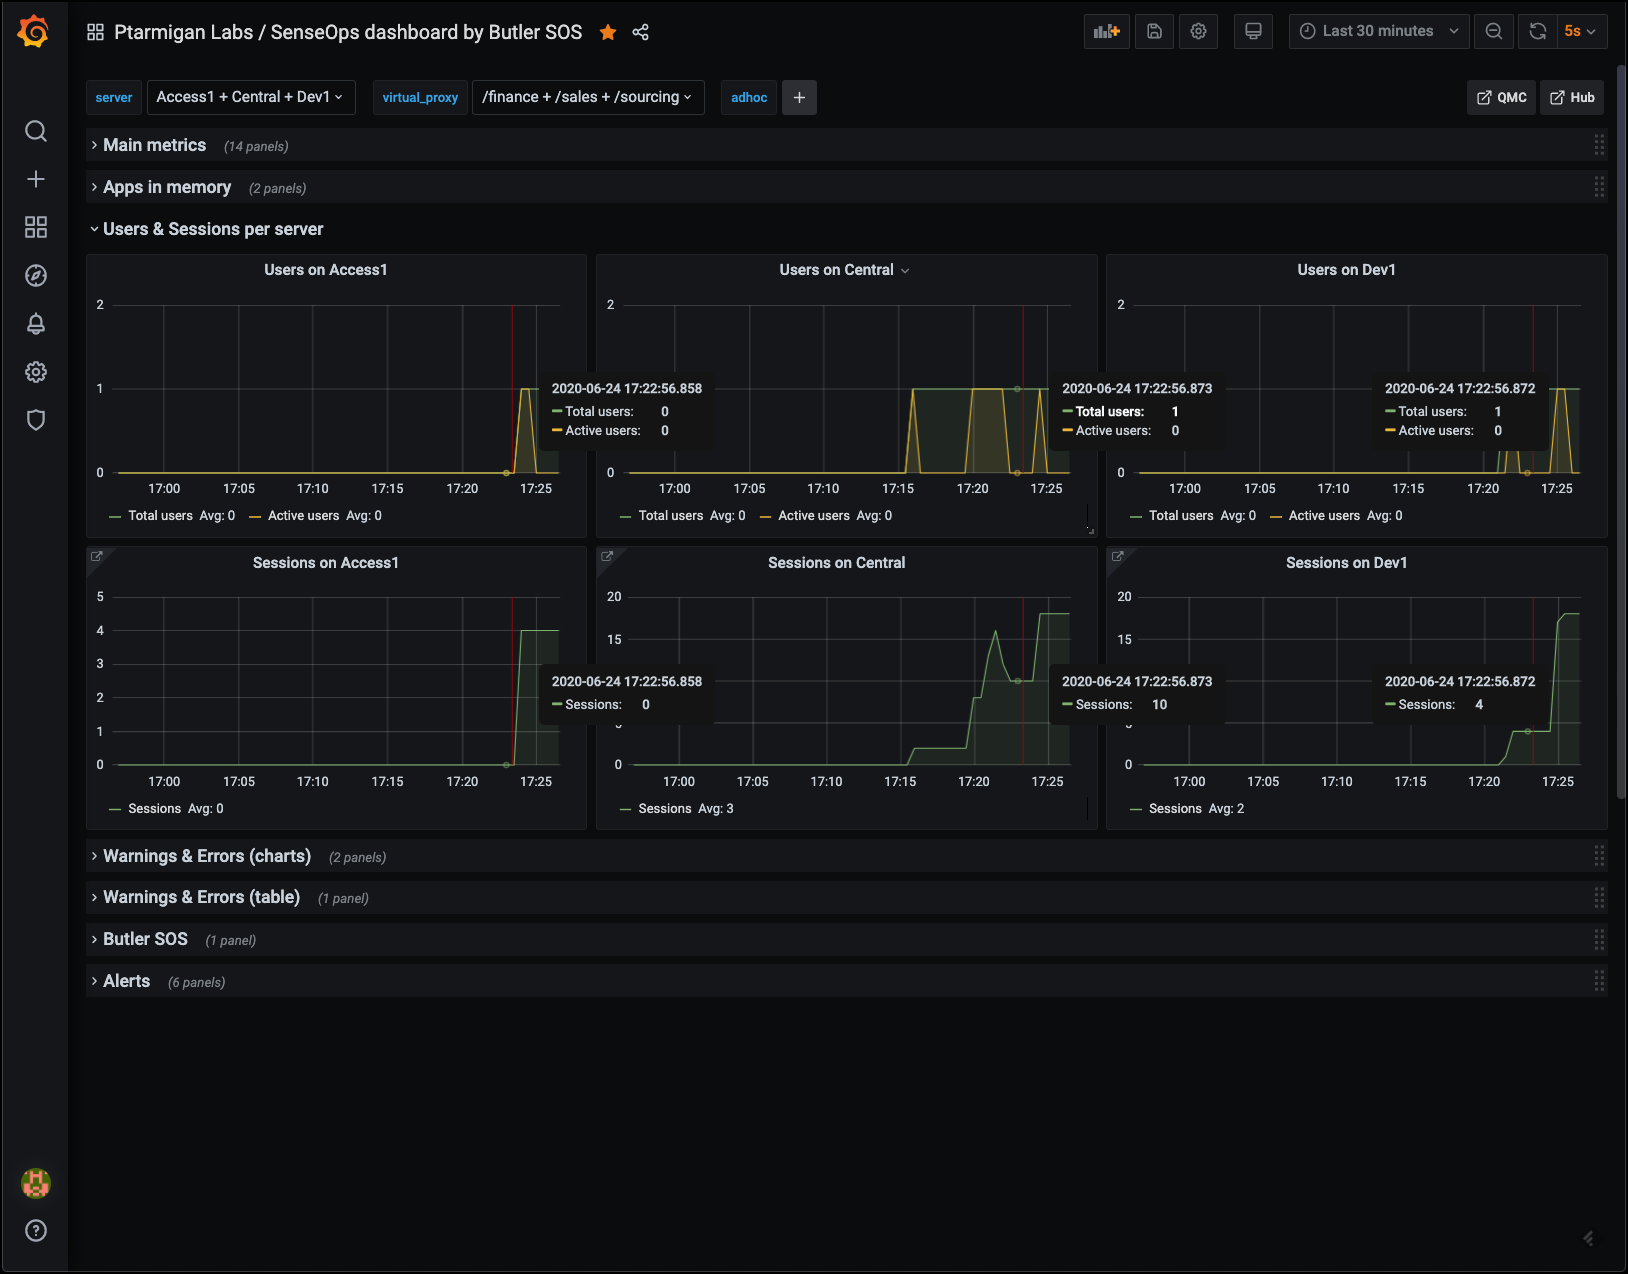 Users and sessions per server
Warnings & Errors
This information is available in the standard Operations Monitor app in Qlik Sense Enterprise, but only in a retrospective way. Having access to it in close to real time makes it possible to act on developing issues quicker.
Charts provide overview while tables give the actual messages, as they appear in the log files.
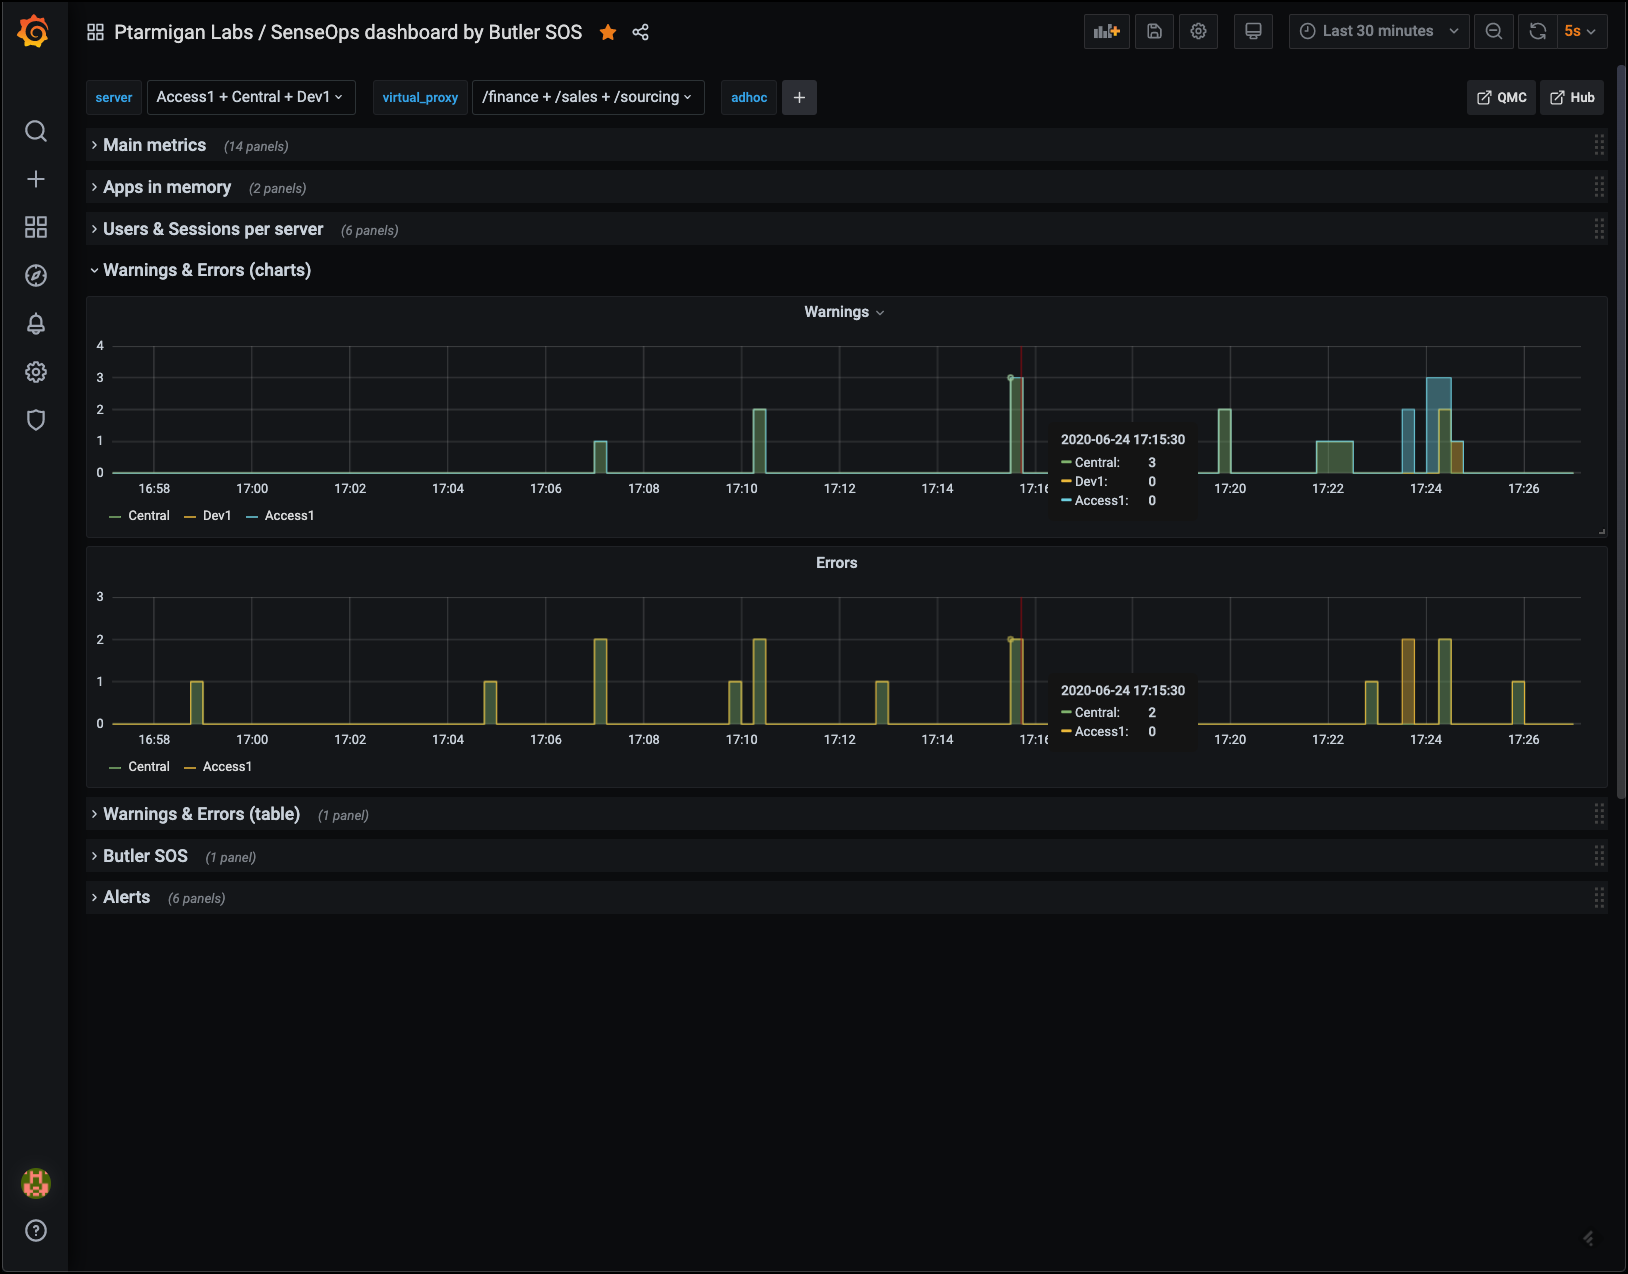 Error and warning charts
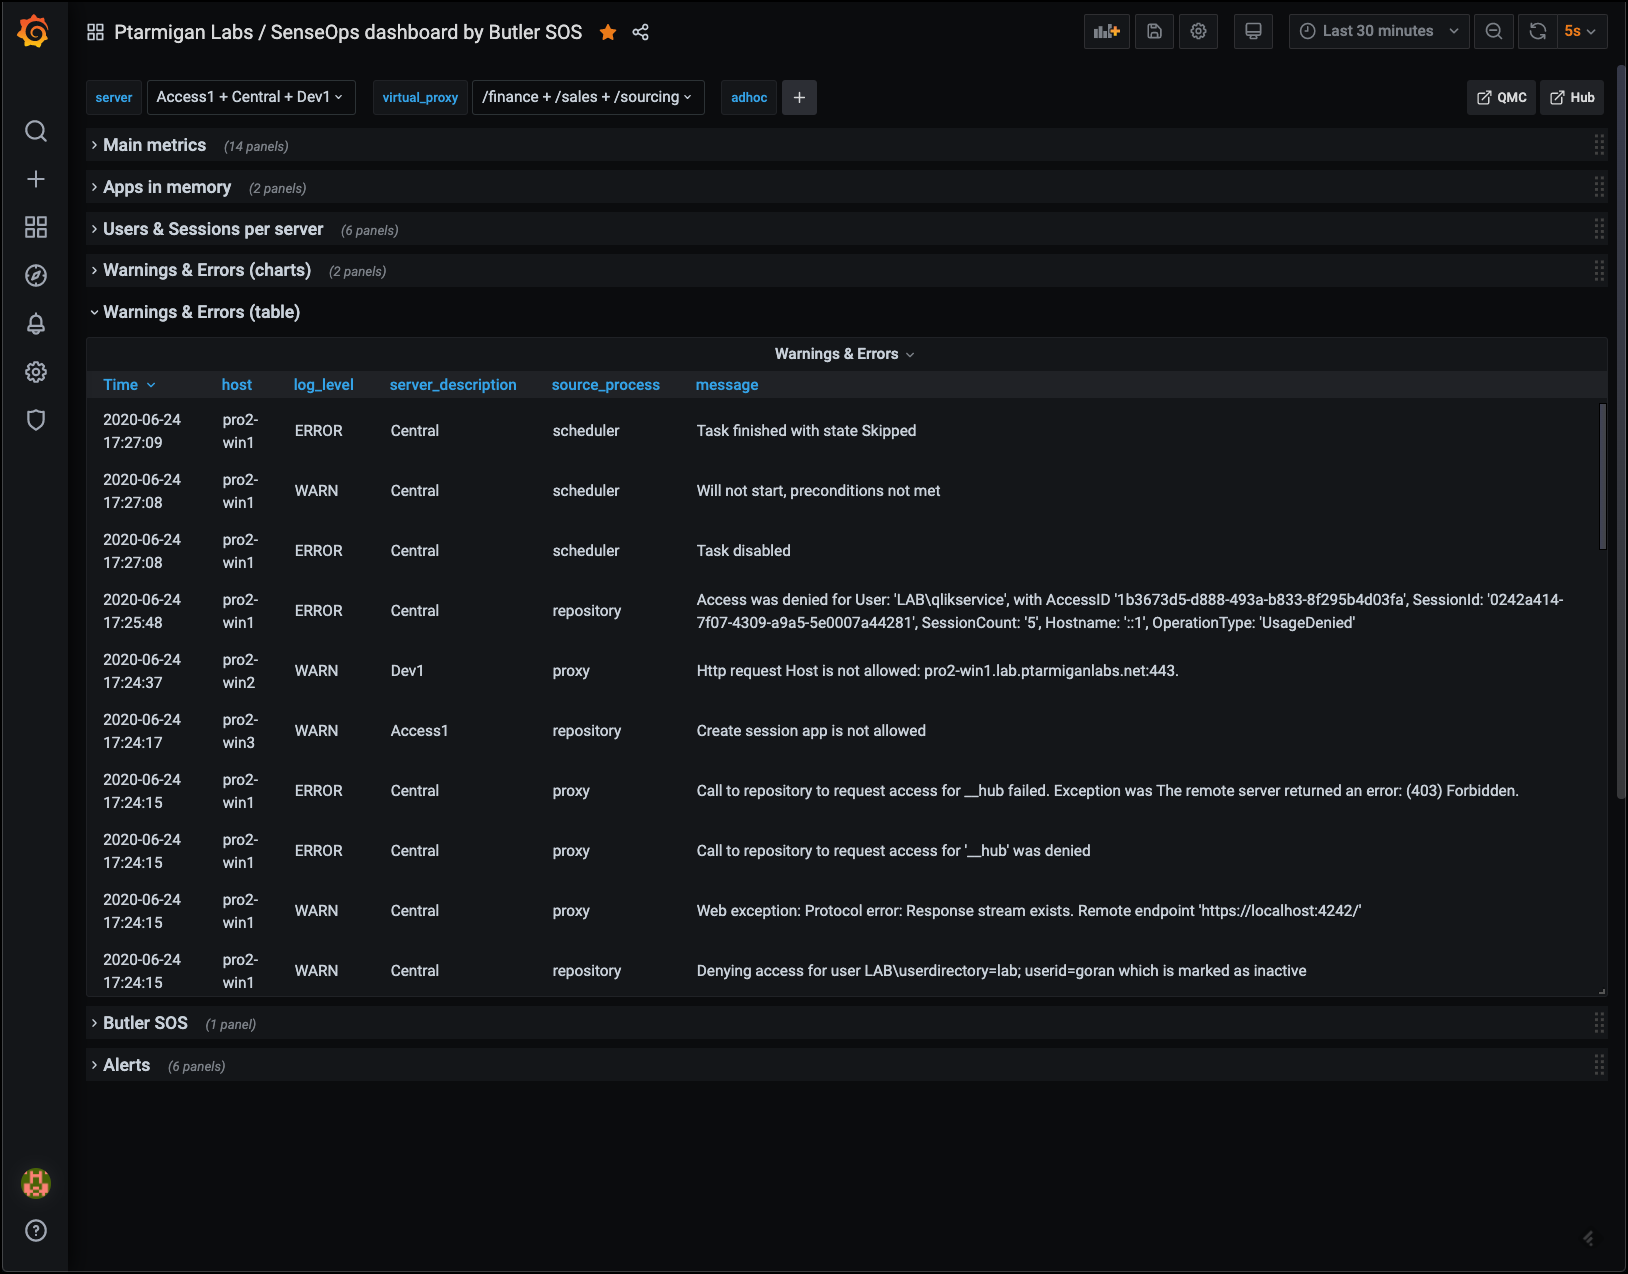 Error and warning tables
Butler SOS Metrics
Butler SOS is very robust, but it may still be of interest to track its memory use, to make sure there aren't any memory leaks etc.
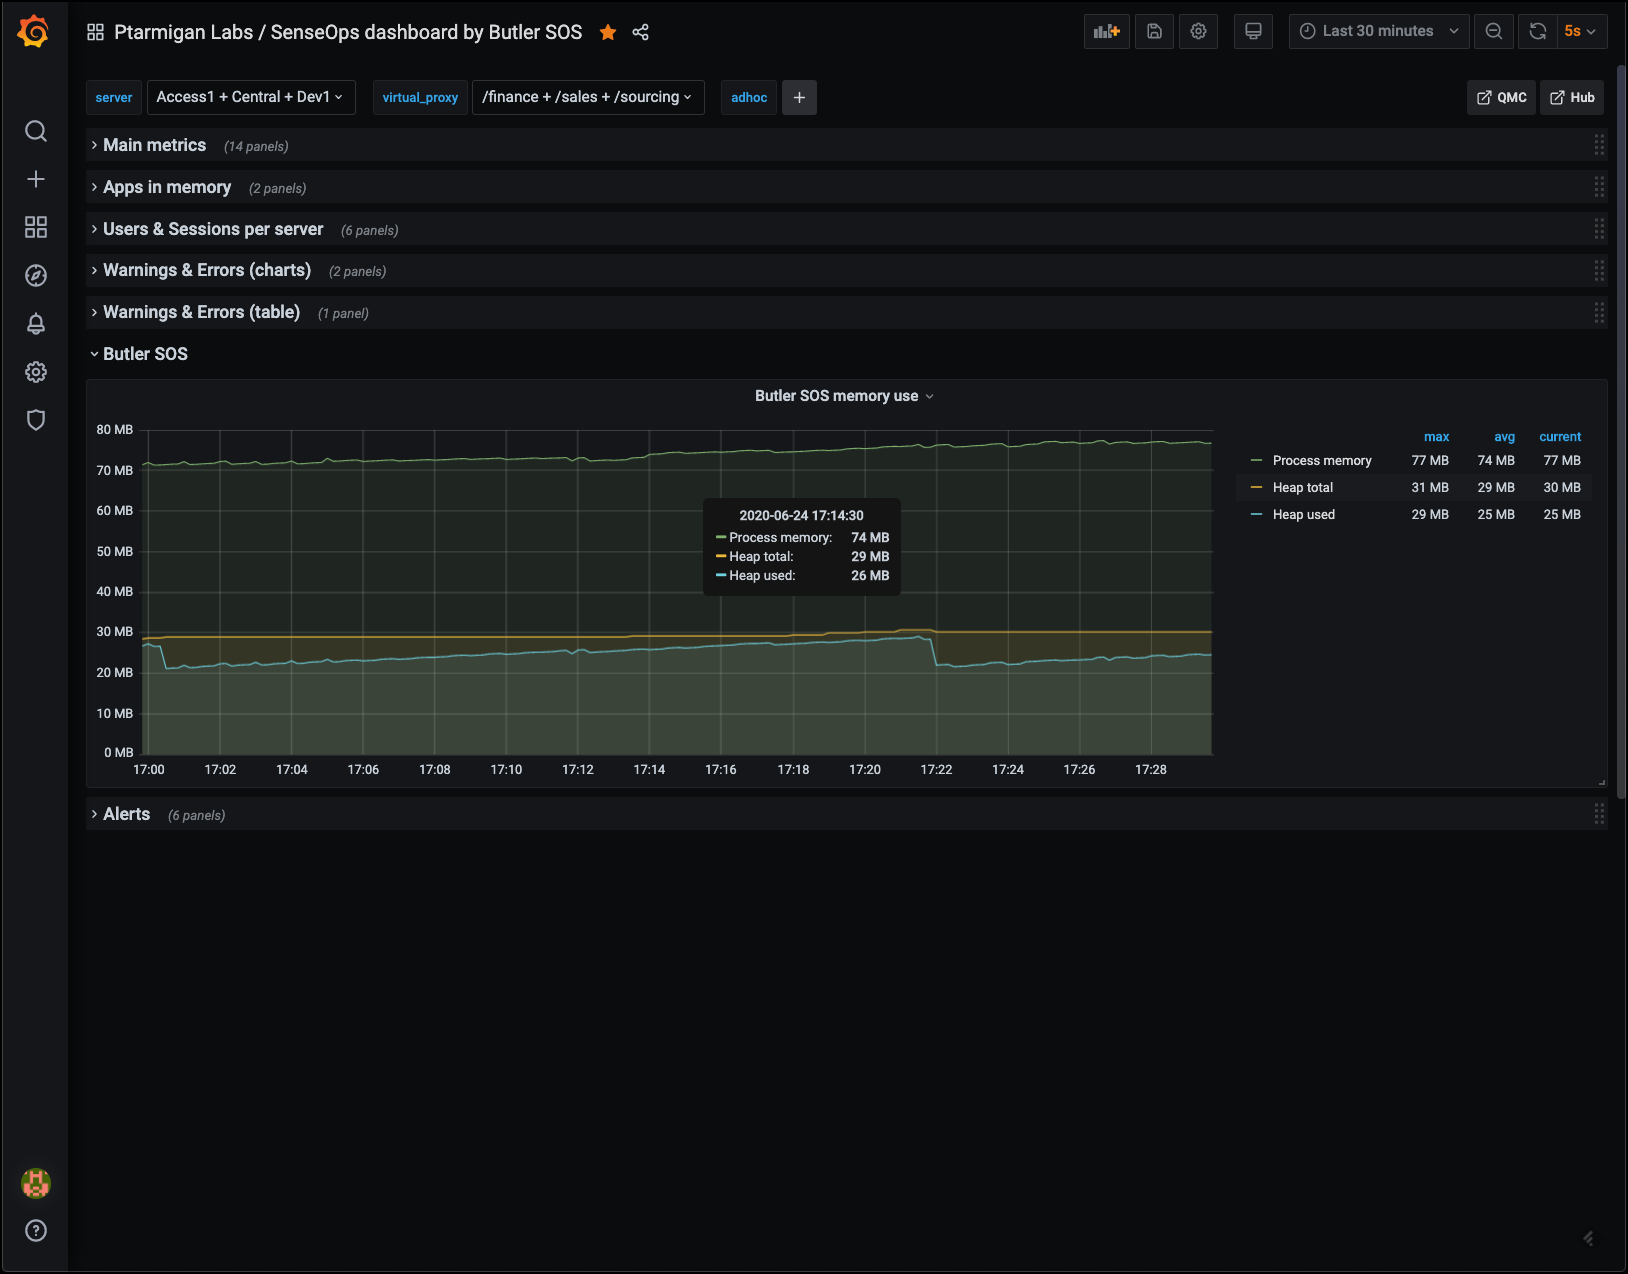 Butler SOS memory usage
Alerts
While it's perfectly possible to include alerts in almost any Grafana chart, sometimes it's nice to tuck the alert-enabled charts away, out of sight. They will do their job and alert when needed.
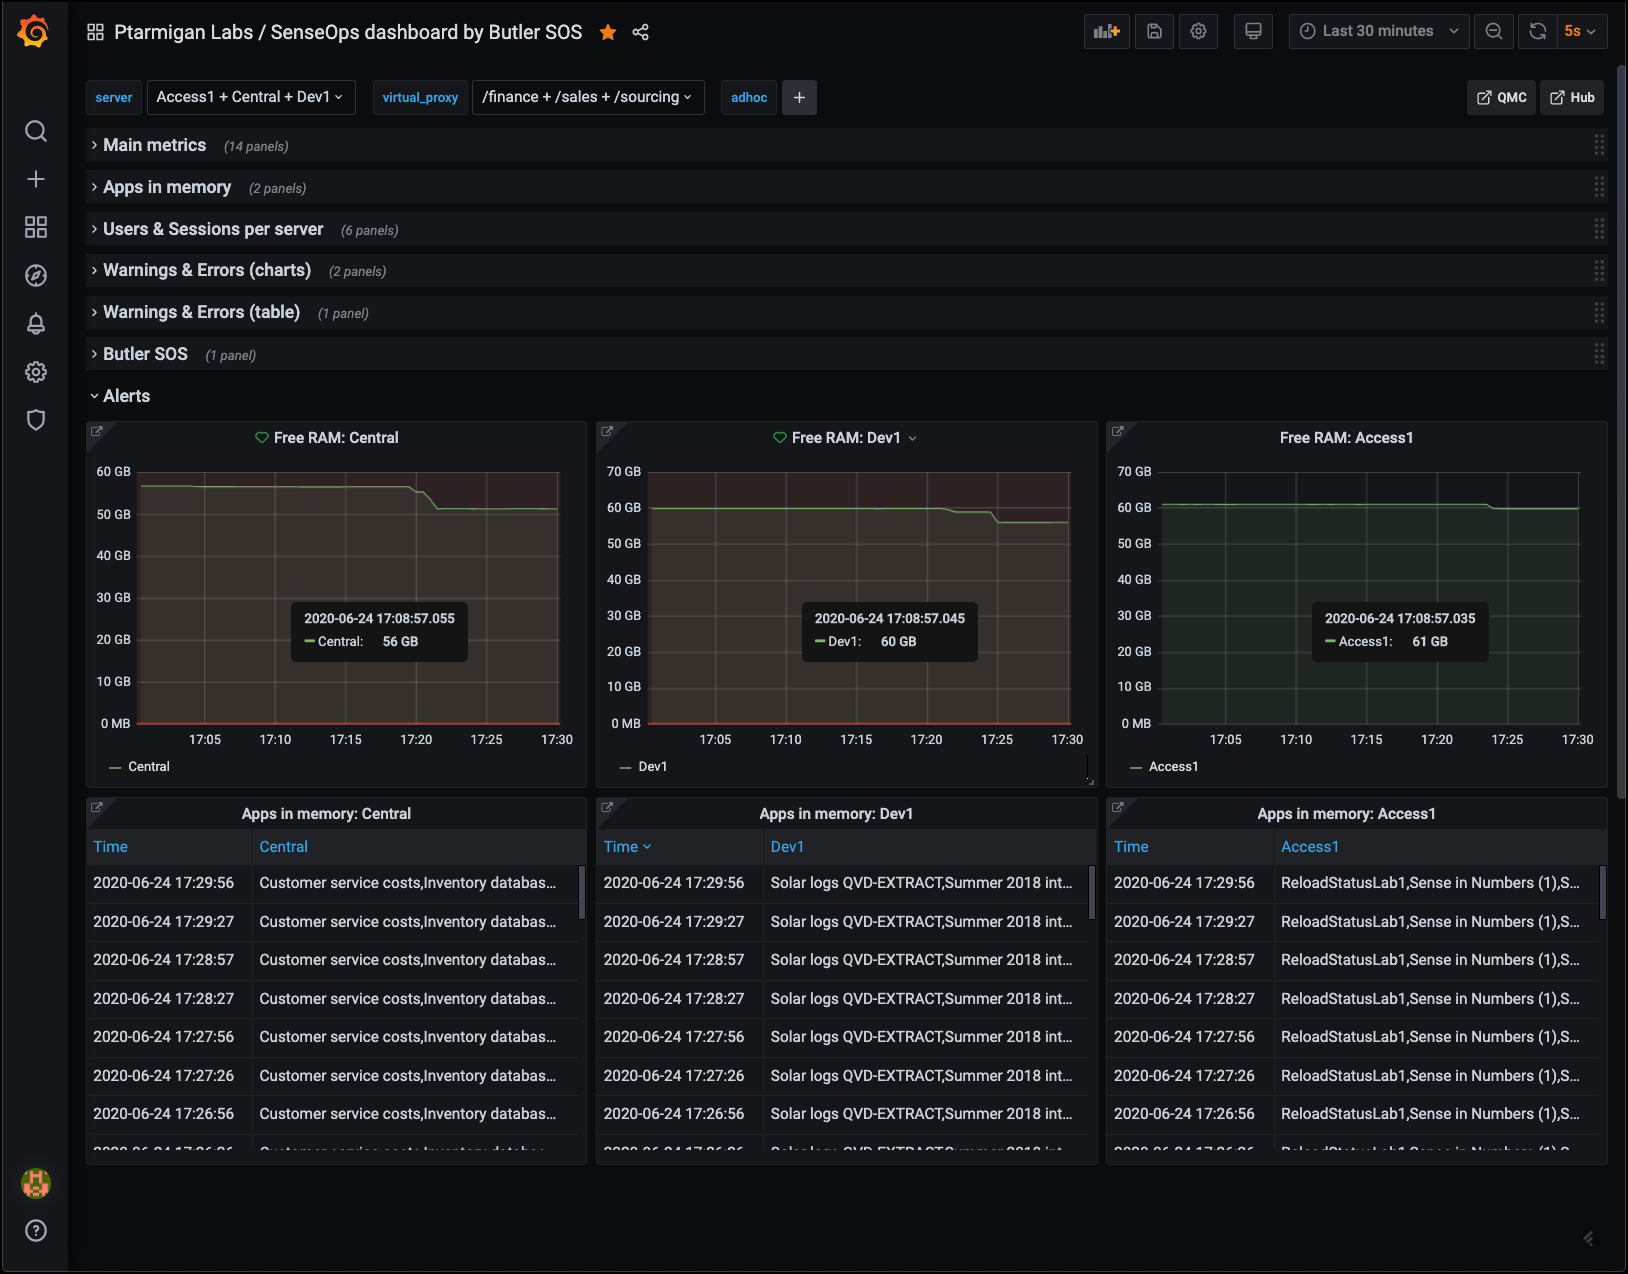 Alerts