Grafana 6 Dashboard
Probably the most obvious and common use case for Butler SOS: View Qlik Sense and Windows operational metrics in great looking Grafana dashboards.
Flexibility
Grafana is an incredibly capable tool for showing time series data.
The dashboards shown here are just examples and inspiration - feel free to extend and adapt these to meet your particular needs. There are also plenty of sample Grafana dashboards out there to get inspiration from.
If you experience issues with the Grafana dashboards included in the Butler SOS release on Github, you might want to try upgrading to a later/latest Grafana version.
Dashboard Concepts
These kind of dashboards give you detailed insights into several important metrics for your Sense servers:
- CPU load
- Amount of free RAM memory
- Number of sessions in total
- Success rate of the Qlik engine's cache
- Number of loaded apps in the Qlik engine
A concept that has proven useful many times is to use an overview dashboard to monitor high-level metrics for the entire Sense cluster. A separate, parameterized dashboard then drills into the details for each server.
Sample dashboards are available in the Git repository. Before importing these to Grafana you should create a Grafana data source called "SenseOps", and point it to your InfluxDB database.
Overview Dashboard
An overview dashboard could include several key visualizations:
RAM Usage
View RAM usage for each server with low memory alerts.
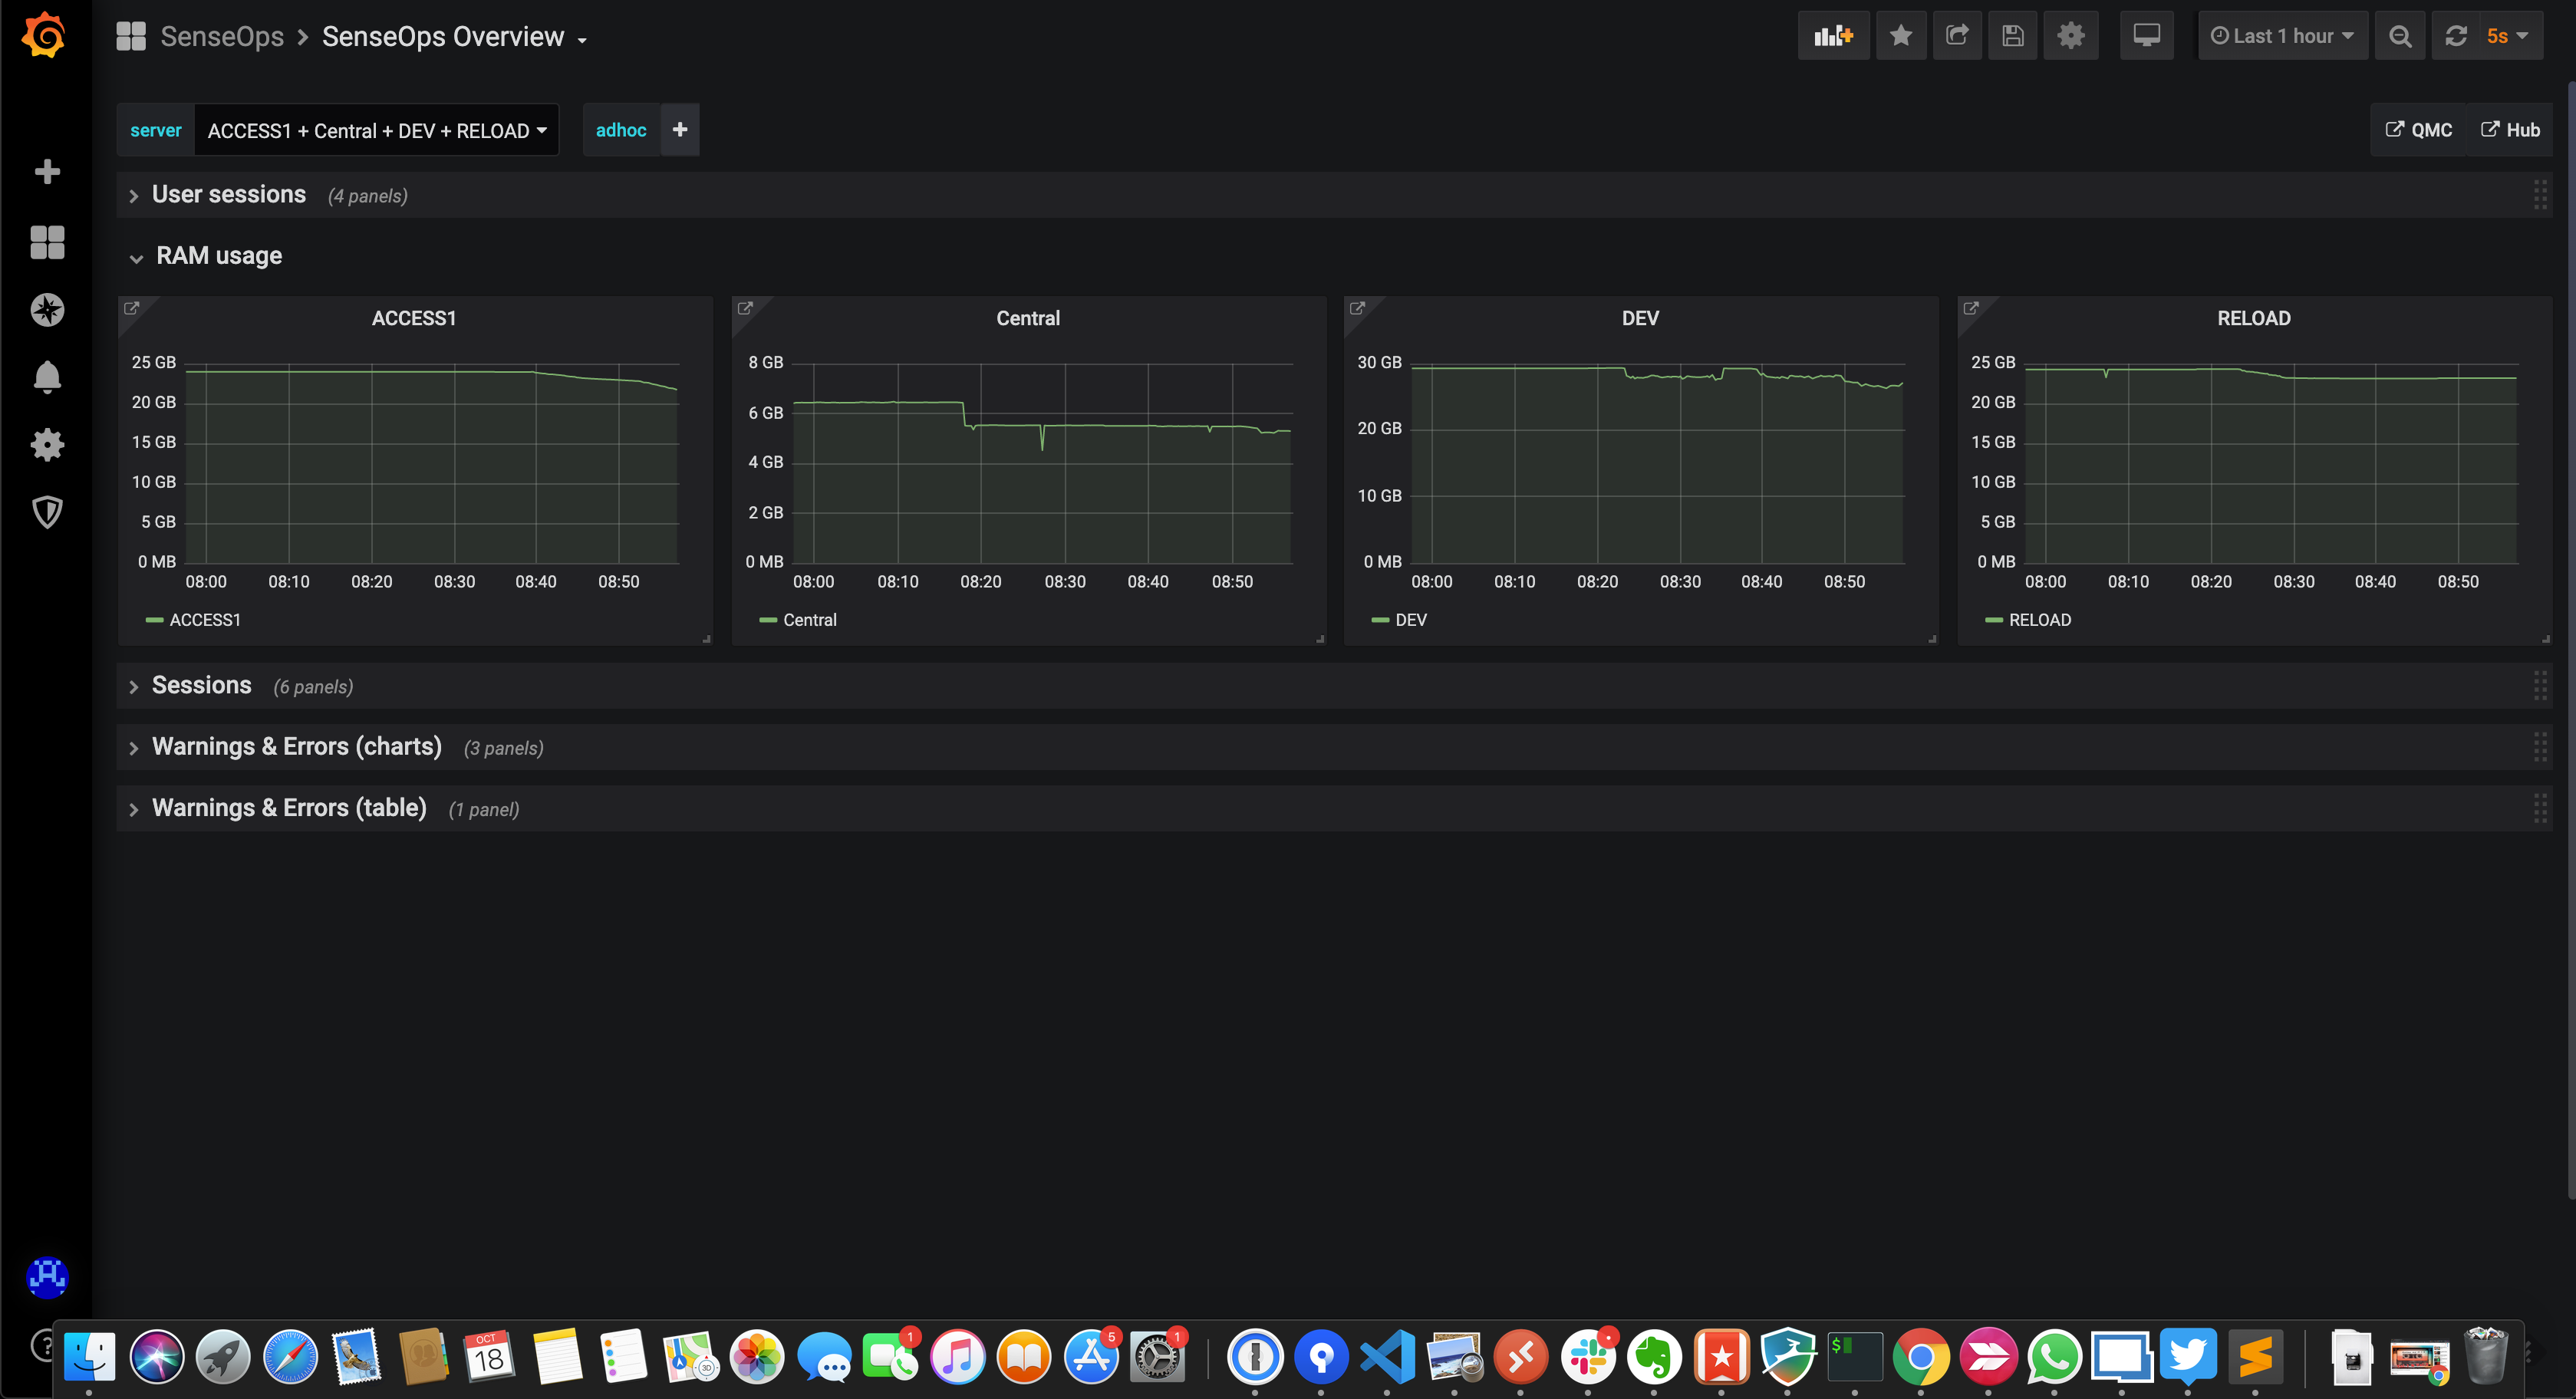 RAM usage for each server
Low memory alerts can be set using Grafana's alert feature. Such alerts can be sent as notifications to Slack, Teams, Pager Duty, email, etc.
Sessions Overview
General/high level user sessions info for both the whole system and each server.
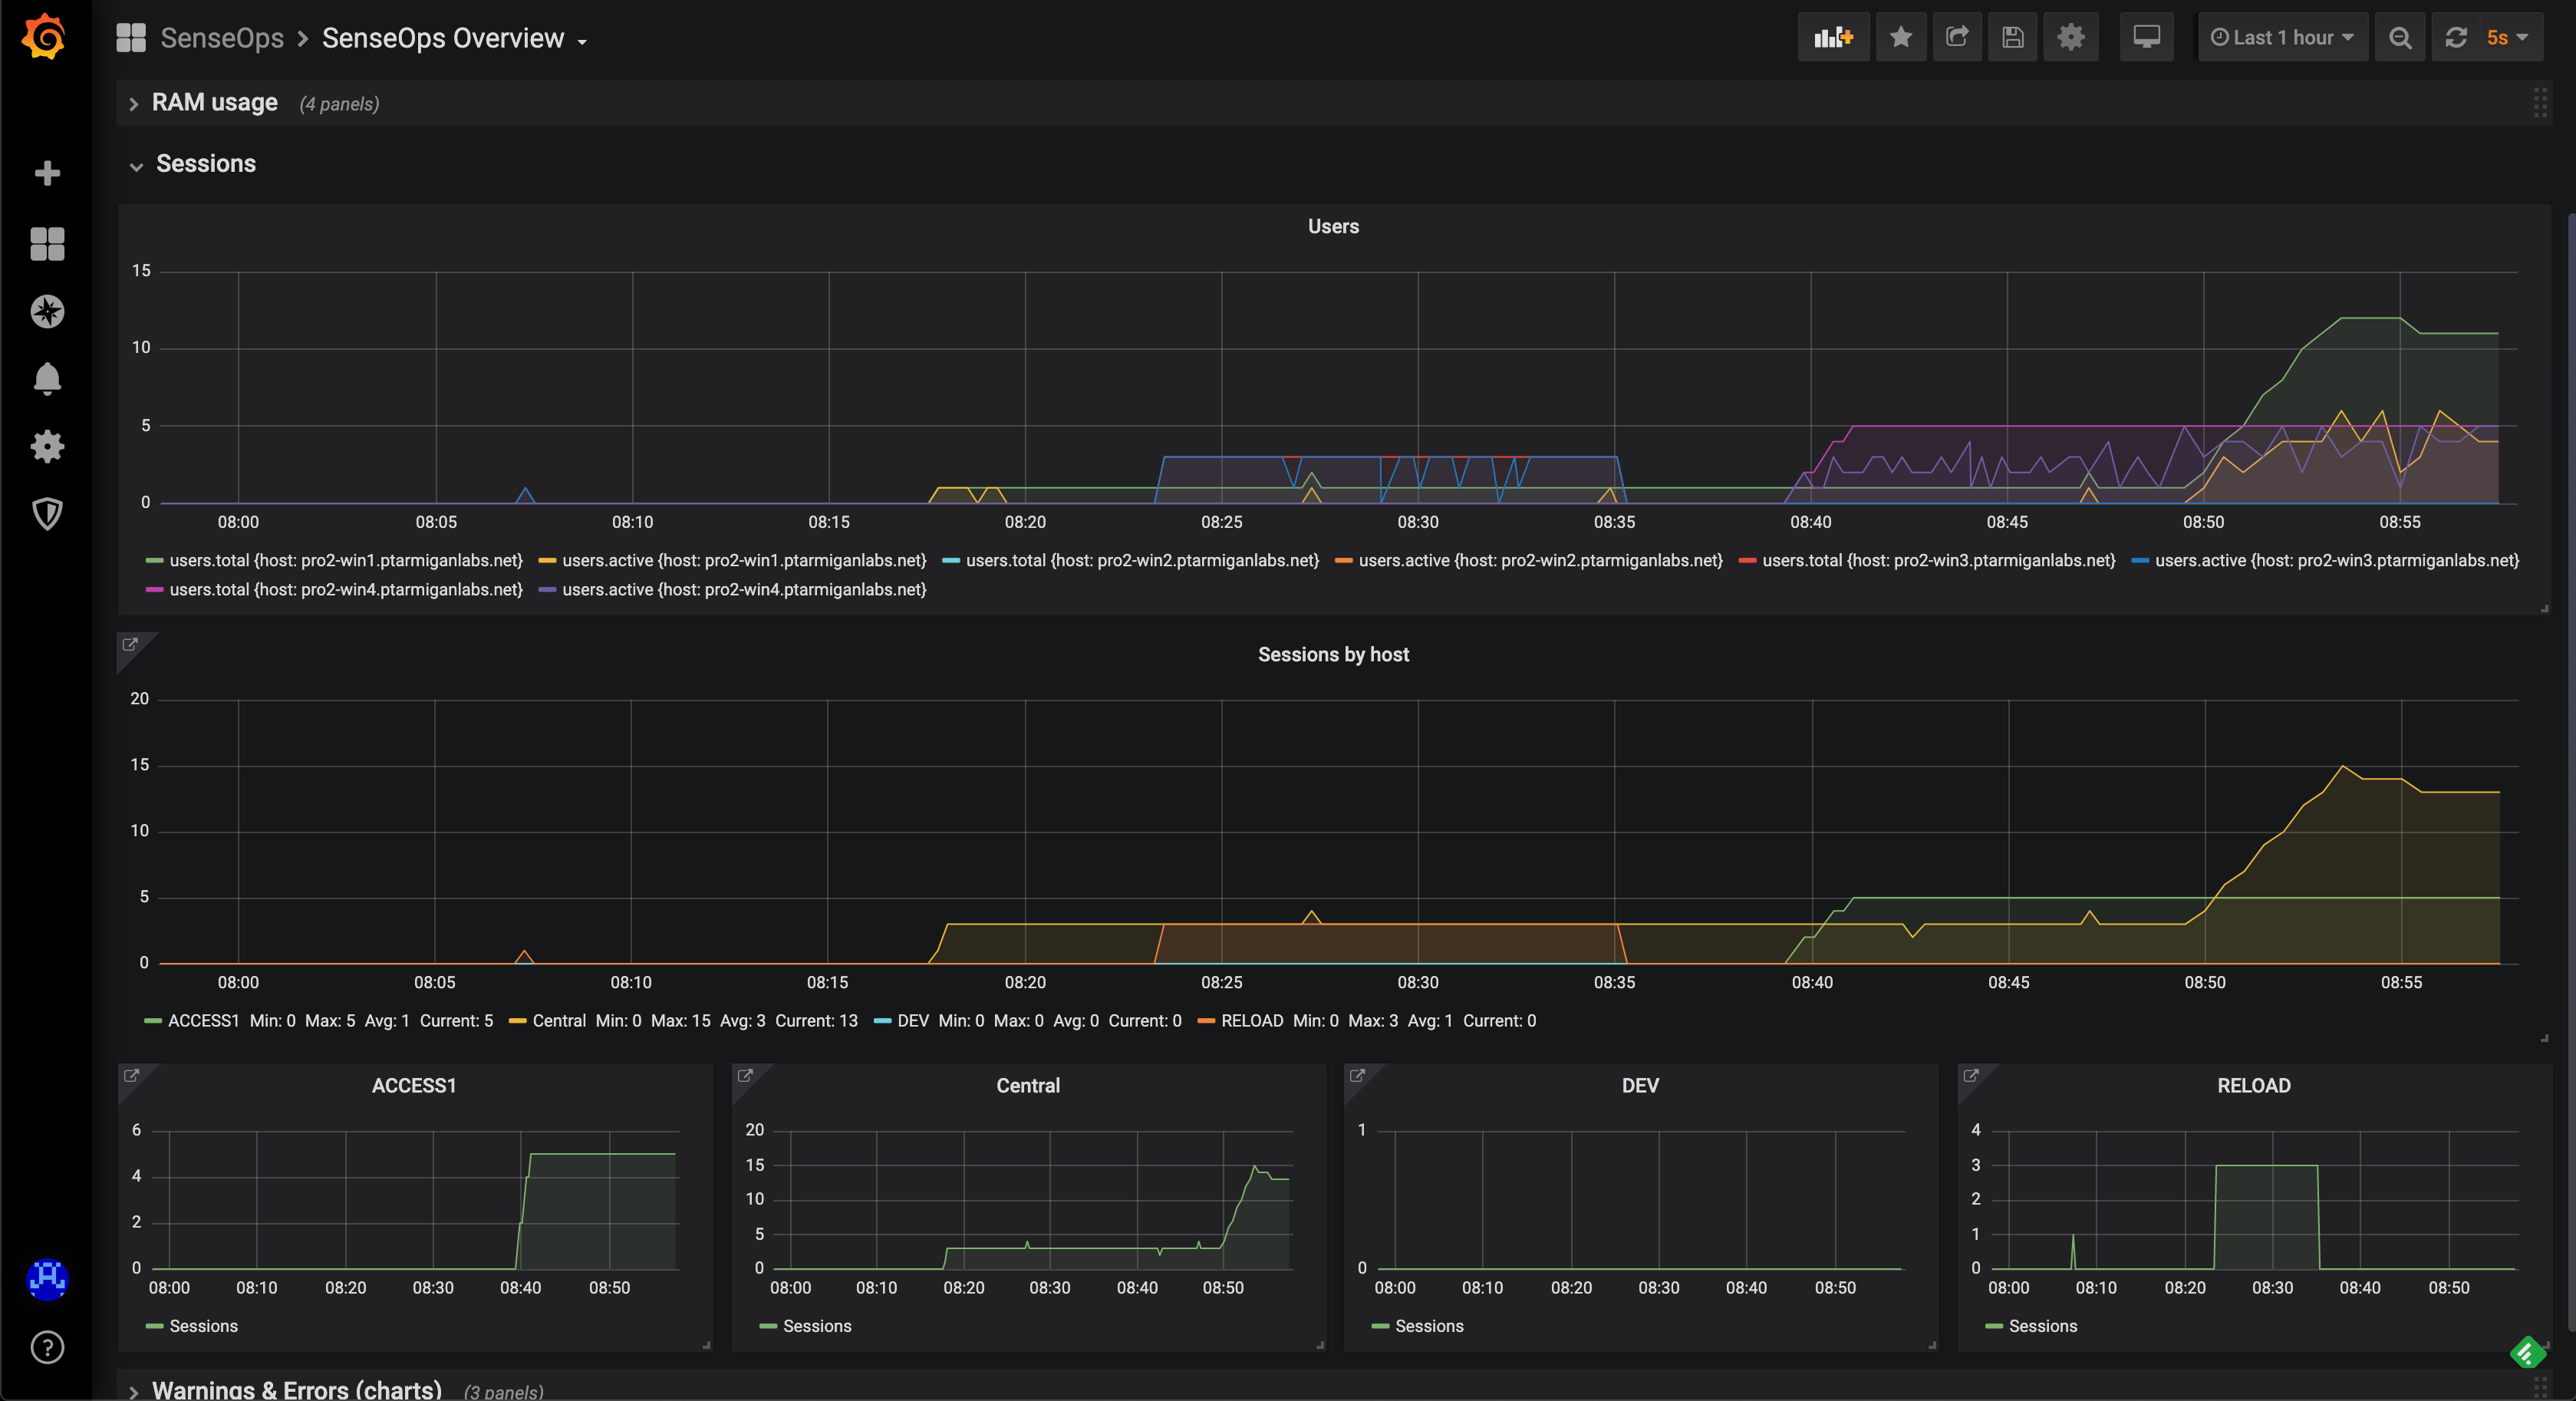 General sessions info
Detailed Sessions
You can also get very detailed session metrics, down to the level of individual sessions per server and virtual proxy.
Possible use cases:
- See what users will be affected by a pending server reboot
- Send chat messages to users informing them of upcoming maintenance
- Troubleshoot user-specific issues
As of Butler SOS v5.0.0, detailed user session metrics are stored in a fairly comprehensive way in InfluxDB.
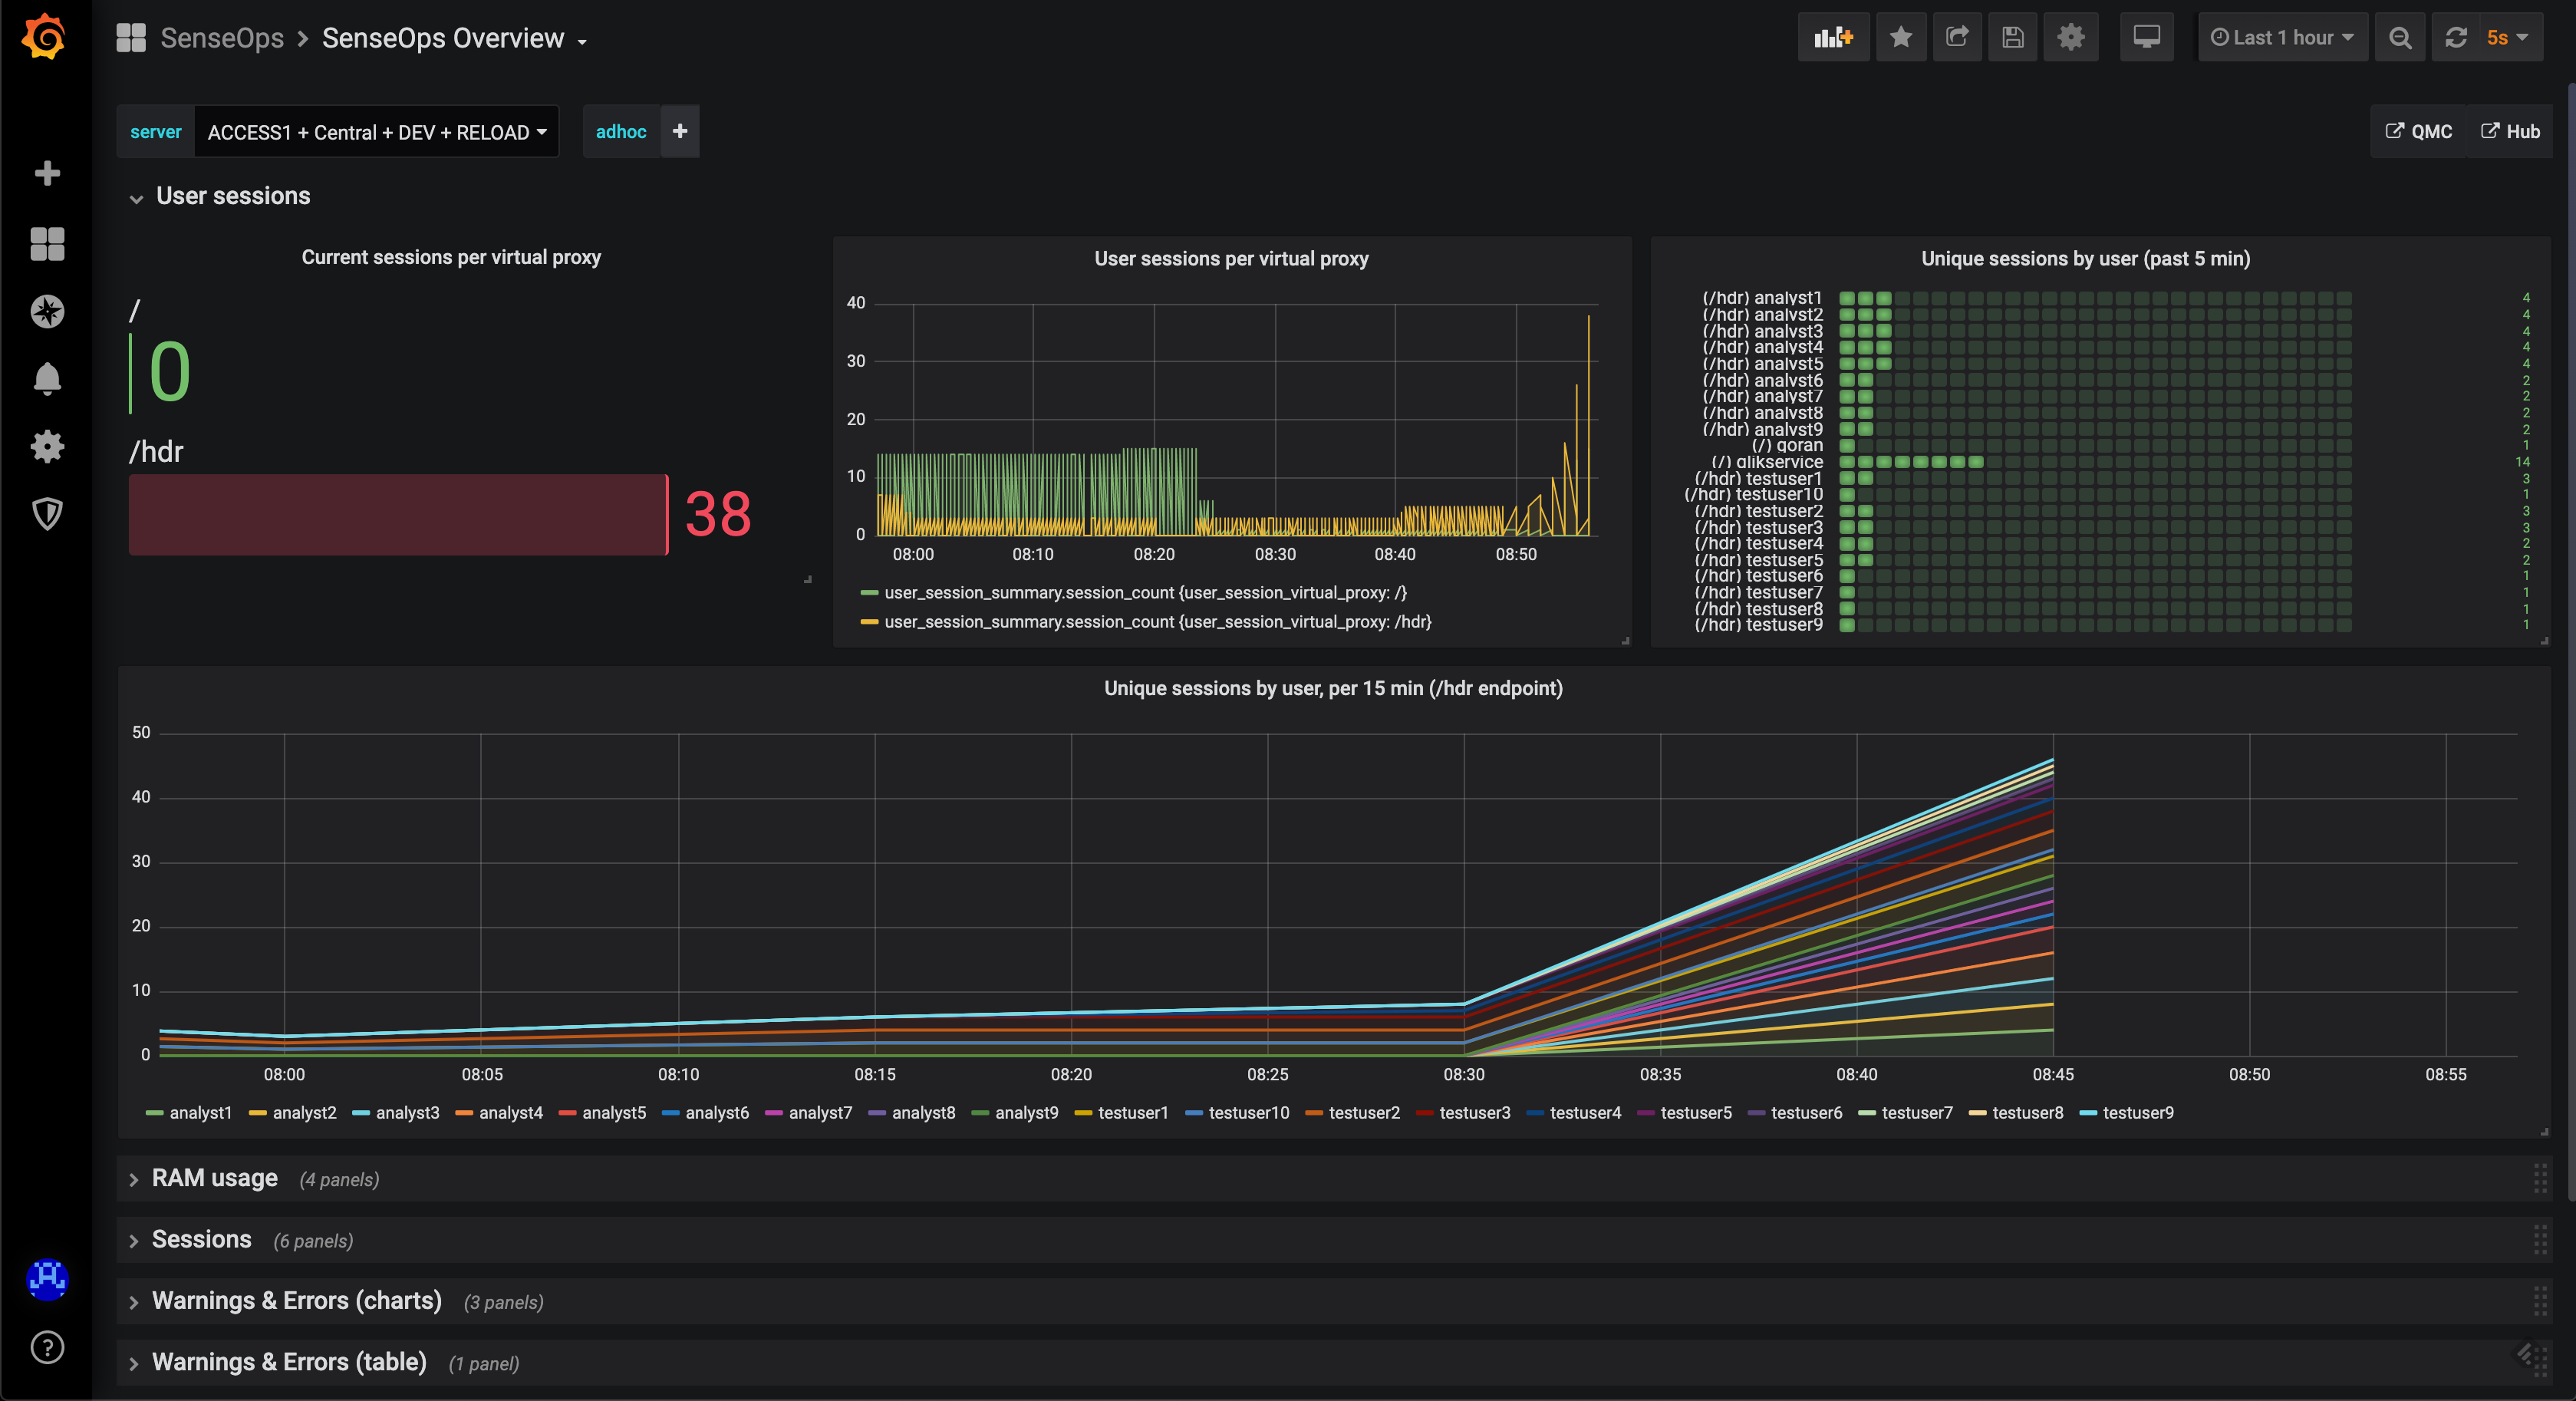 Detailed sessions info
Logs Overview
When something breaks in a Qlik Sense environment, the logs immediately fill up with warning and/or error messages. By keeping track of these it's easy to quickly spot (and get notified of) issues when they first occur.
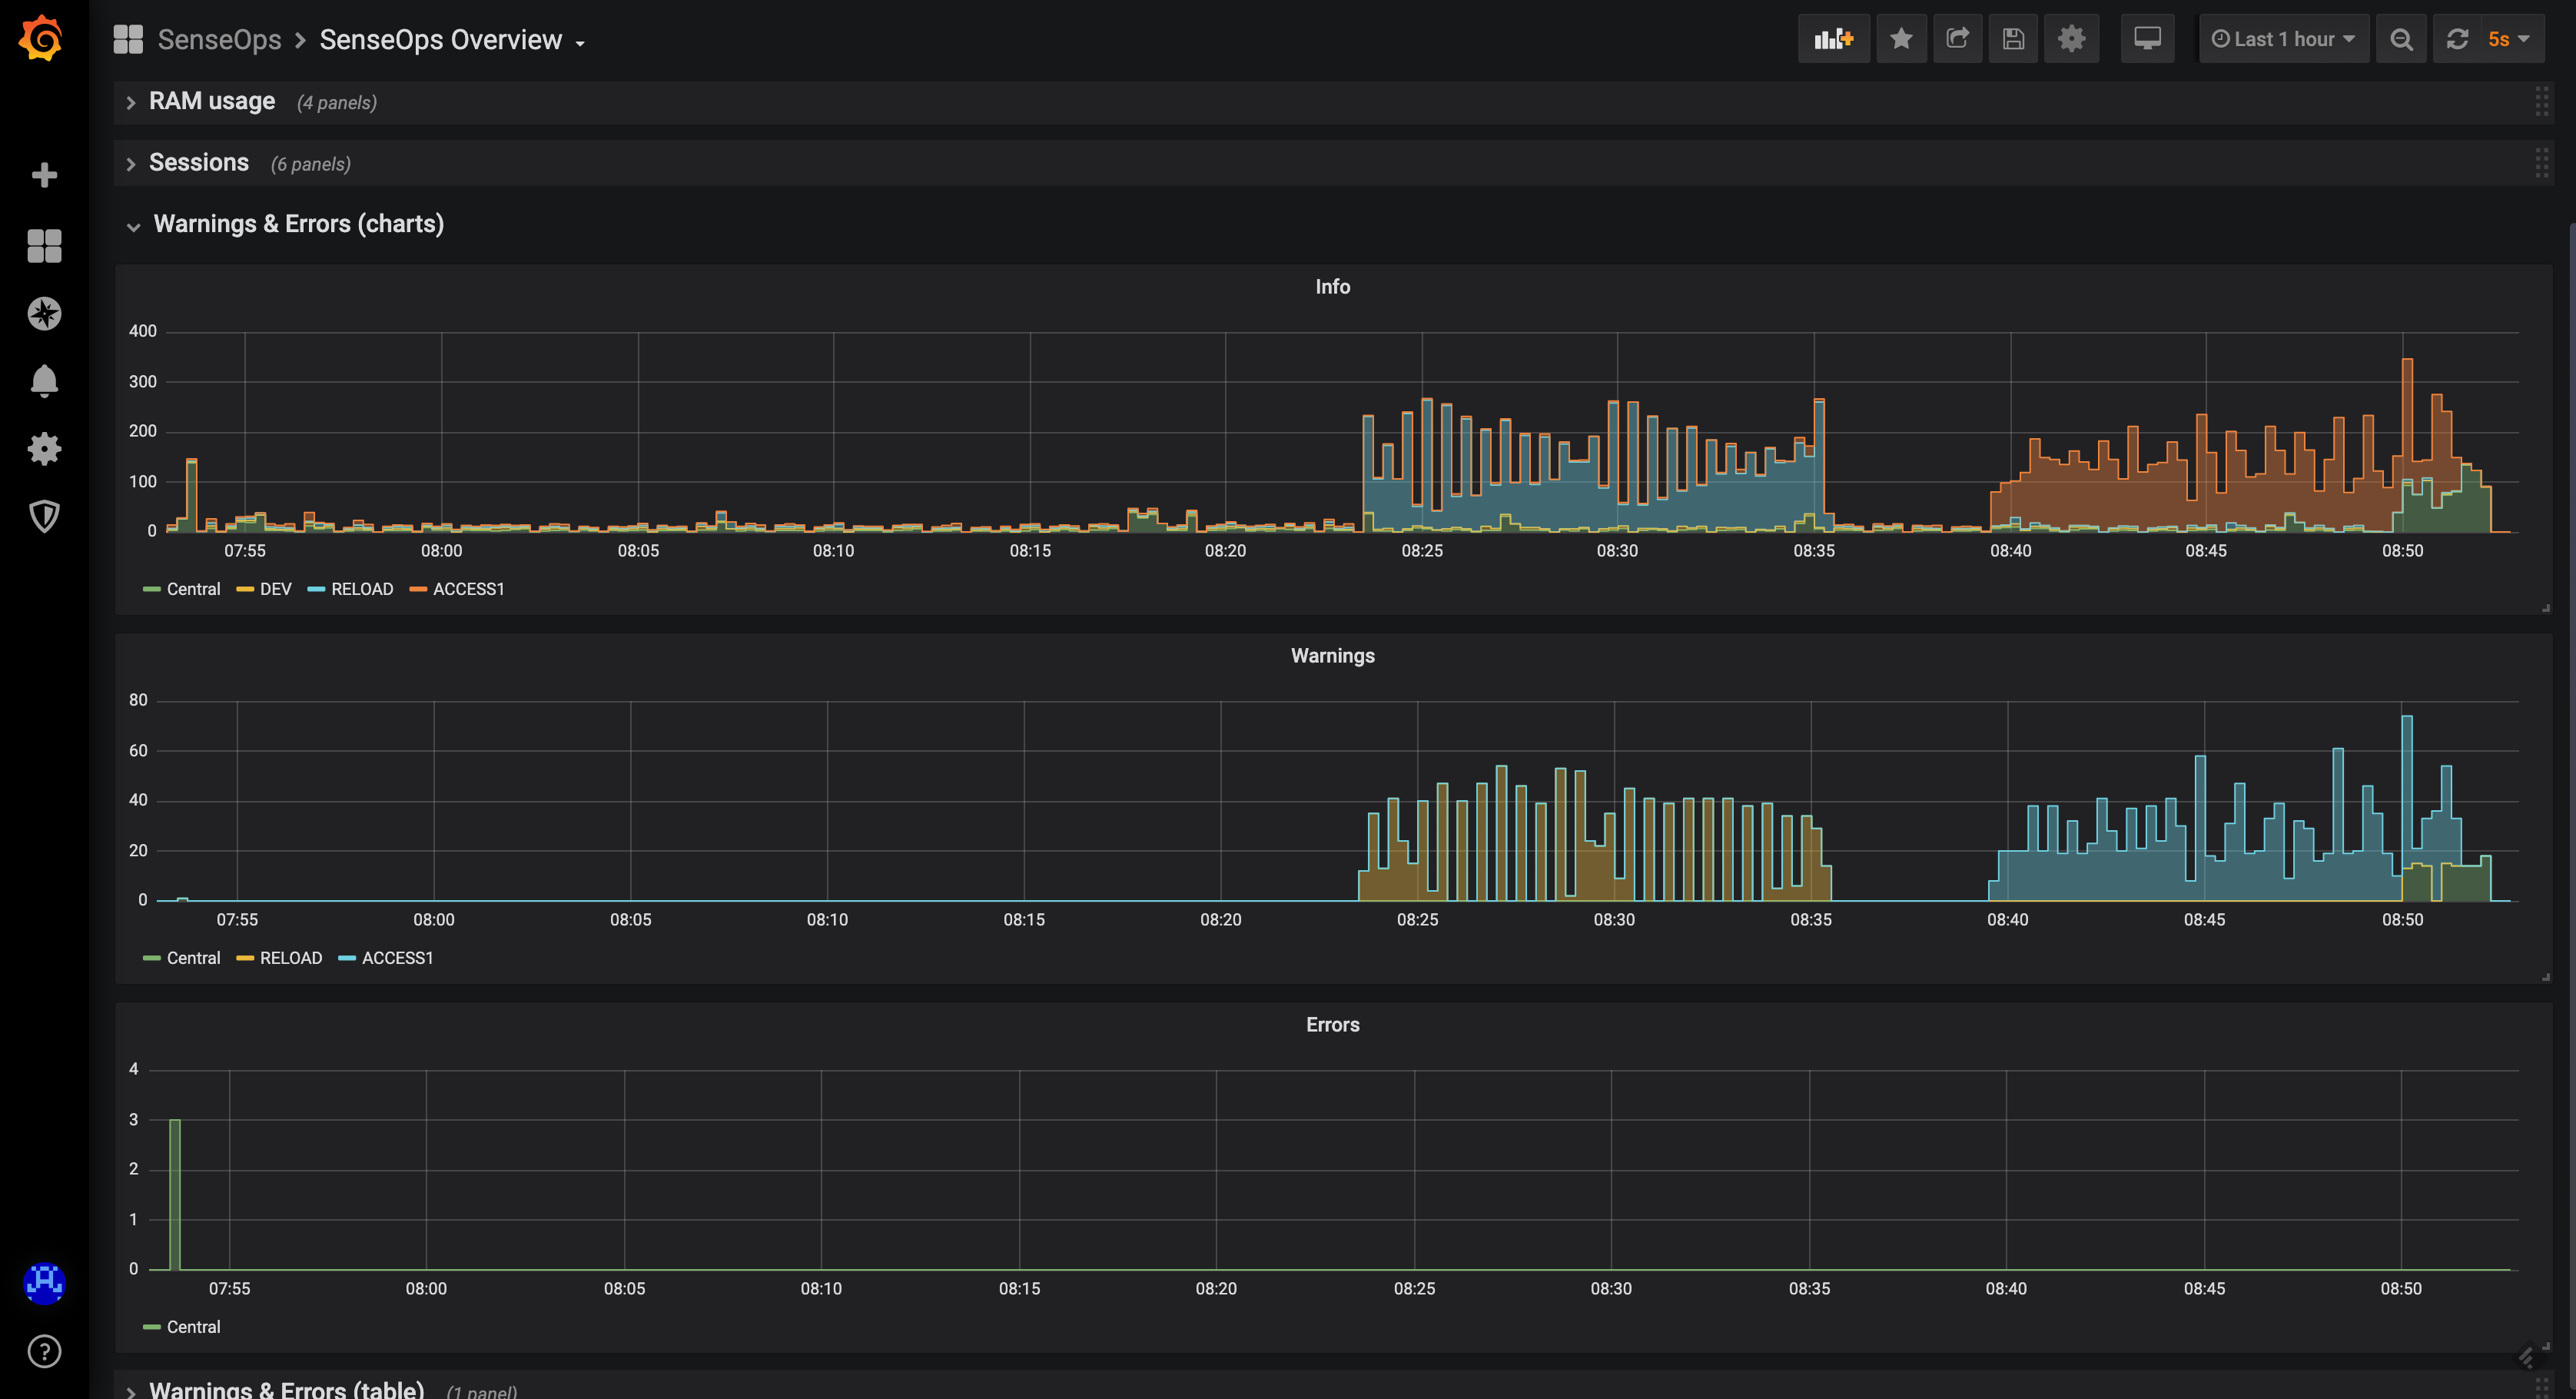 Errors and warnings
INFO level logging
Note that there are usually lots of INFO level messages generated. In a production setting it's usually a good idea to turn off extraction of INFO level log messages into InfluxDB.
This is controlled in the YAML config file.