Find Slow Updating Charts
This example shows how to use Butler SOS to monitor which parts of a Qlik Sense app are slow to update.
Overview
Goal
The goal is to monitor how long each app object in a Sense app takes to open, and also identify which objects are slow to update.
This is useful for several reasons:
- Identify misbehaving charts - Find problematic charts, tables etc in important apps. This is especially valuable for apps used by many users or business-critical apps.
- Establish baselines - Get a baseline for how long it takes for each app object to open and update. Use this to set alert thresholds or identify when performance degrades over time.
- Troubleshoot user complaints - When end users experience slow performance when interacting with an app, monitor object open and update times to identify which objects are slow.
 In order to understand the chart you must also know the ID of each app object. More on this further down this page.
Prerequisites
- Butler SOS 11.0 or later. Download from GitHub releases.
- Store the data collected by Butler SOS in an InfluxDB v1 or v2 database. InfluxDB setup instructions.
- XML appender files deployed on the Sense servers you want to monitor.
- A reasonably recent version of Grafana.
- Data connections set up in Grafana to the InfluxDB database.
- A way to get the ID of each app object in the Sense apps you want to monitor.
Example App
The "Training - Field indexing" app is used as an example. It's a basic app that explains how in-app data indexing works in Qlik Sense.
The app consists of a single table with two fields and 10 million rows of random data.
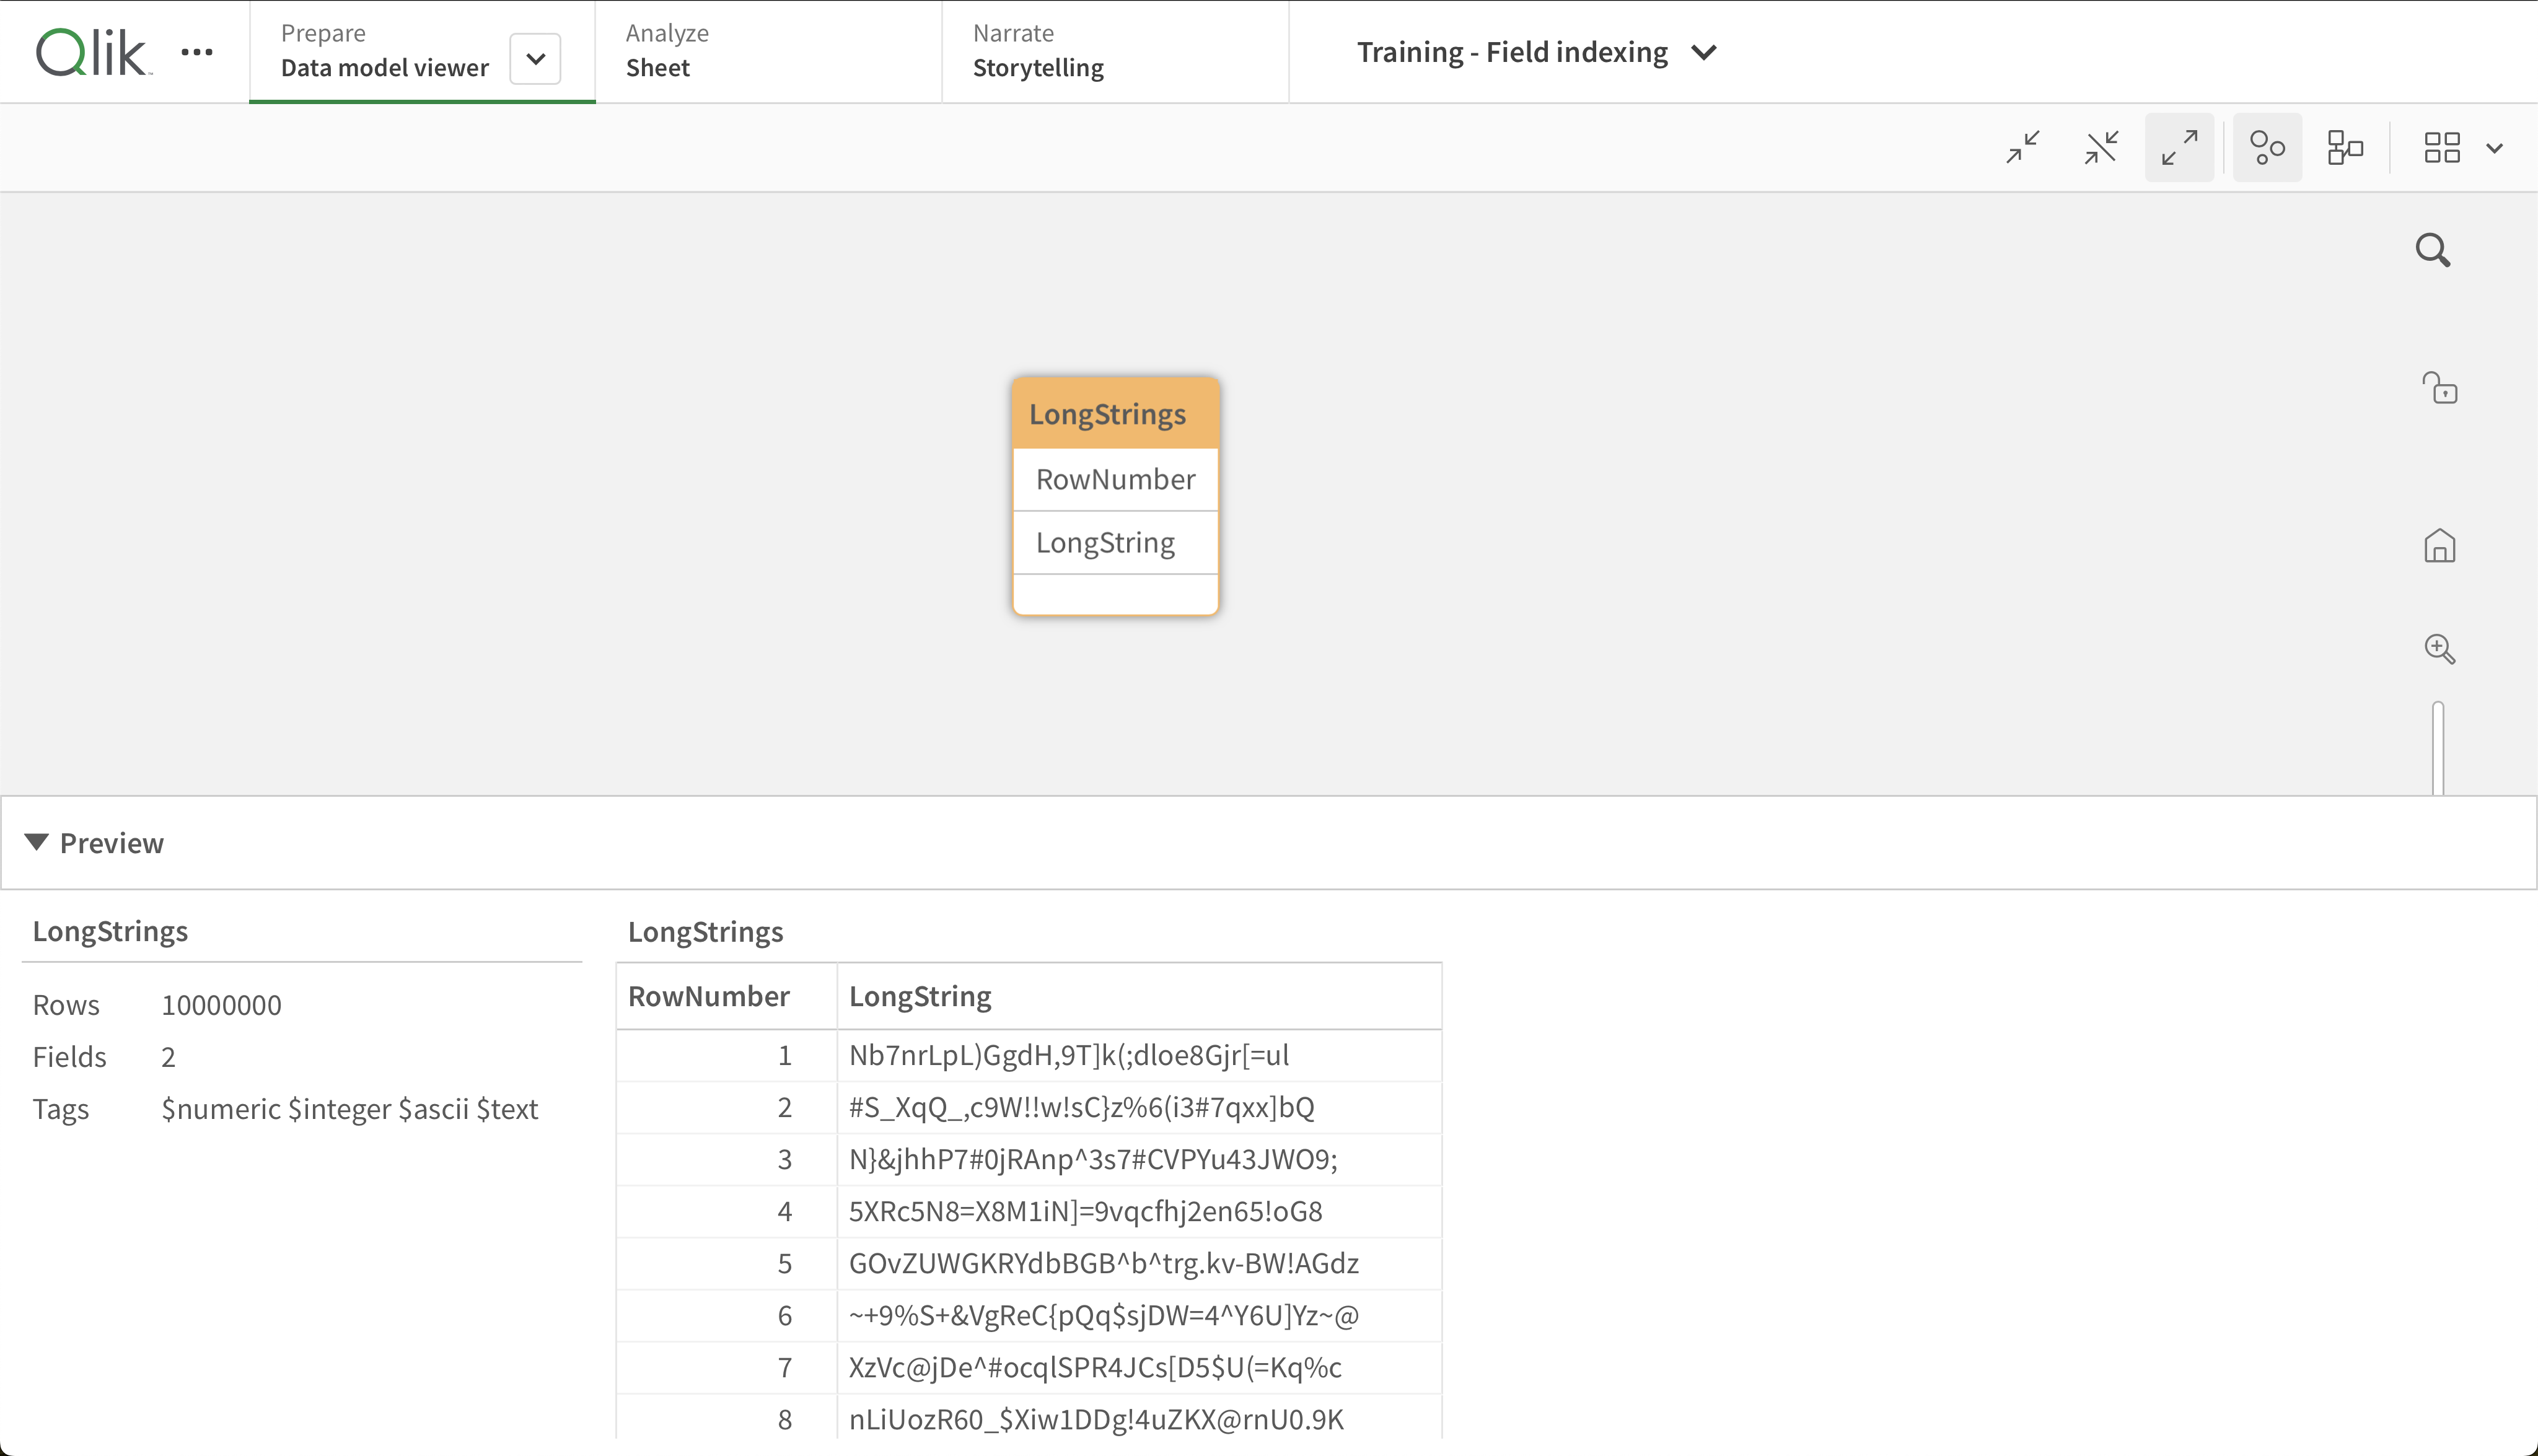 Data model in the "Training - Field indexing" app.
The "LongStrings" field contains random strings of 32 characters each.
The idea is to stress the Sense engine by having it index random data - something that can be done, but that gets slower as the number of rows or string length increases.
Two things may require a lot of time in this app:
- Opening the app when it's not already in memory - triggers indexing of the data
- Making a selection once the app is open - triggers re-indexing of selected data
A Word of Caution
Data volume
Enabling detailed performance monitoring can generate a lot of data, especially if enabled for many apps.
This can lead to performance issues in InfluxDB and Grafana.
Recommendations:
- Only enable detailed monitoring for a limited number of apps
- Consider enabling monitoring only for limited time periods
- Start by monitoring all objects, then narrow down to specific ones of interest
- Limit monitoring to certain object types (e.g., charts and tables only)
Configure Butler SOS
Database requirement
InfluxDB is the only supported database for this feature. See the config file format reference for details.
  # Shared settings for user and log events
  qlikSenseEvents:
    influxdb:
      enable: true
      writeFrequency: 20000
  ...
  # Log events configuration
  logEvents:
    udpServerConfig:
      serverHost: butler-sos.mycompany.net
      portLogEvents: 9996
    tags:
      - name: env
        value: DEV
      - name: foo
        value: bar
    ...
    enginePerformanceMonitor:
      enable: true
      appNameLookup:
        enable: true
      ...
      monitorFilter:
        # Two monitoring approaches:
        # 1) Monitor all apps except those listed for exclusion
        # 2) Monitor only specific apps
        # An event is accepted if it matches either section
        allApps:
          enable: false
          appExclude:
          objectType:
            allObjectTypes: false
            allObjectTypesExclude:
            someObjectTypesInclude:
          method:
            allMethods: false
            allMethodsExclude:
            someMethodsInclude:
        appSpecific:
          enable: true
          app:
            - include:
                - appName: Training - Field indexing
              objectType:
                allObjectTypes: true
                allObjectTypesExclude:
                someObjectTypesInclude:
              appObject:
                allAppObjects: true
                allAppObjectsExclude:
                someAppObjectsInclude:
              method:
                allMethods: true
                allMethodsExclude:
                someMethodsInclude:
Configure Grafana
With the Butler SOS configuration in place (remember to restart after changes), set up Grafana to visualize the data.
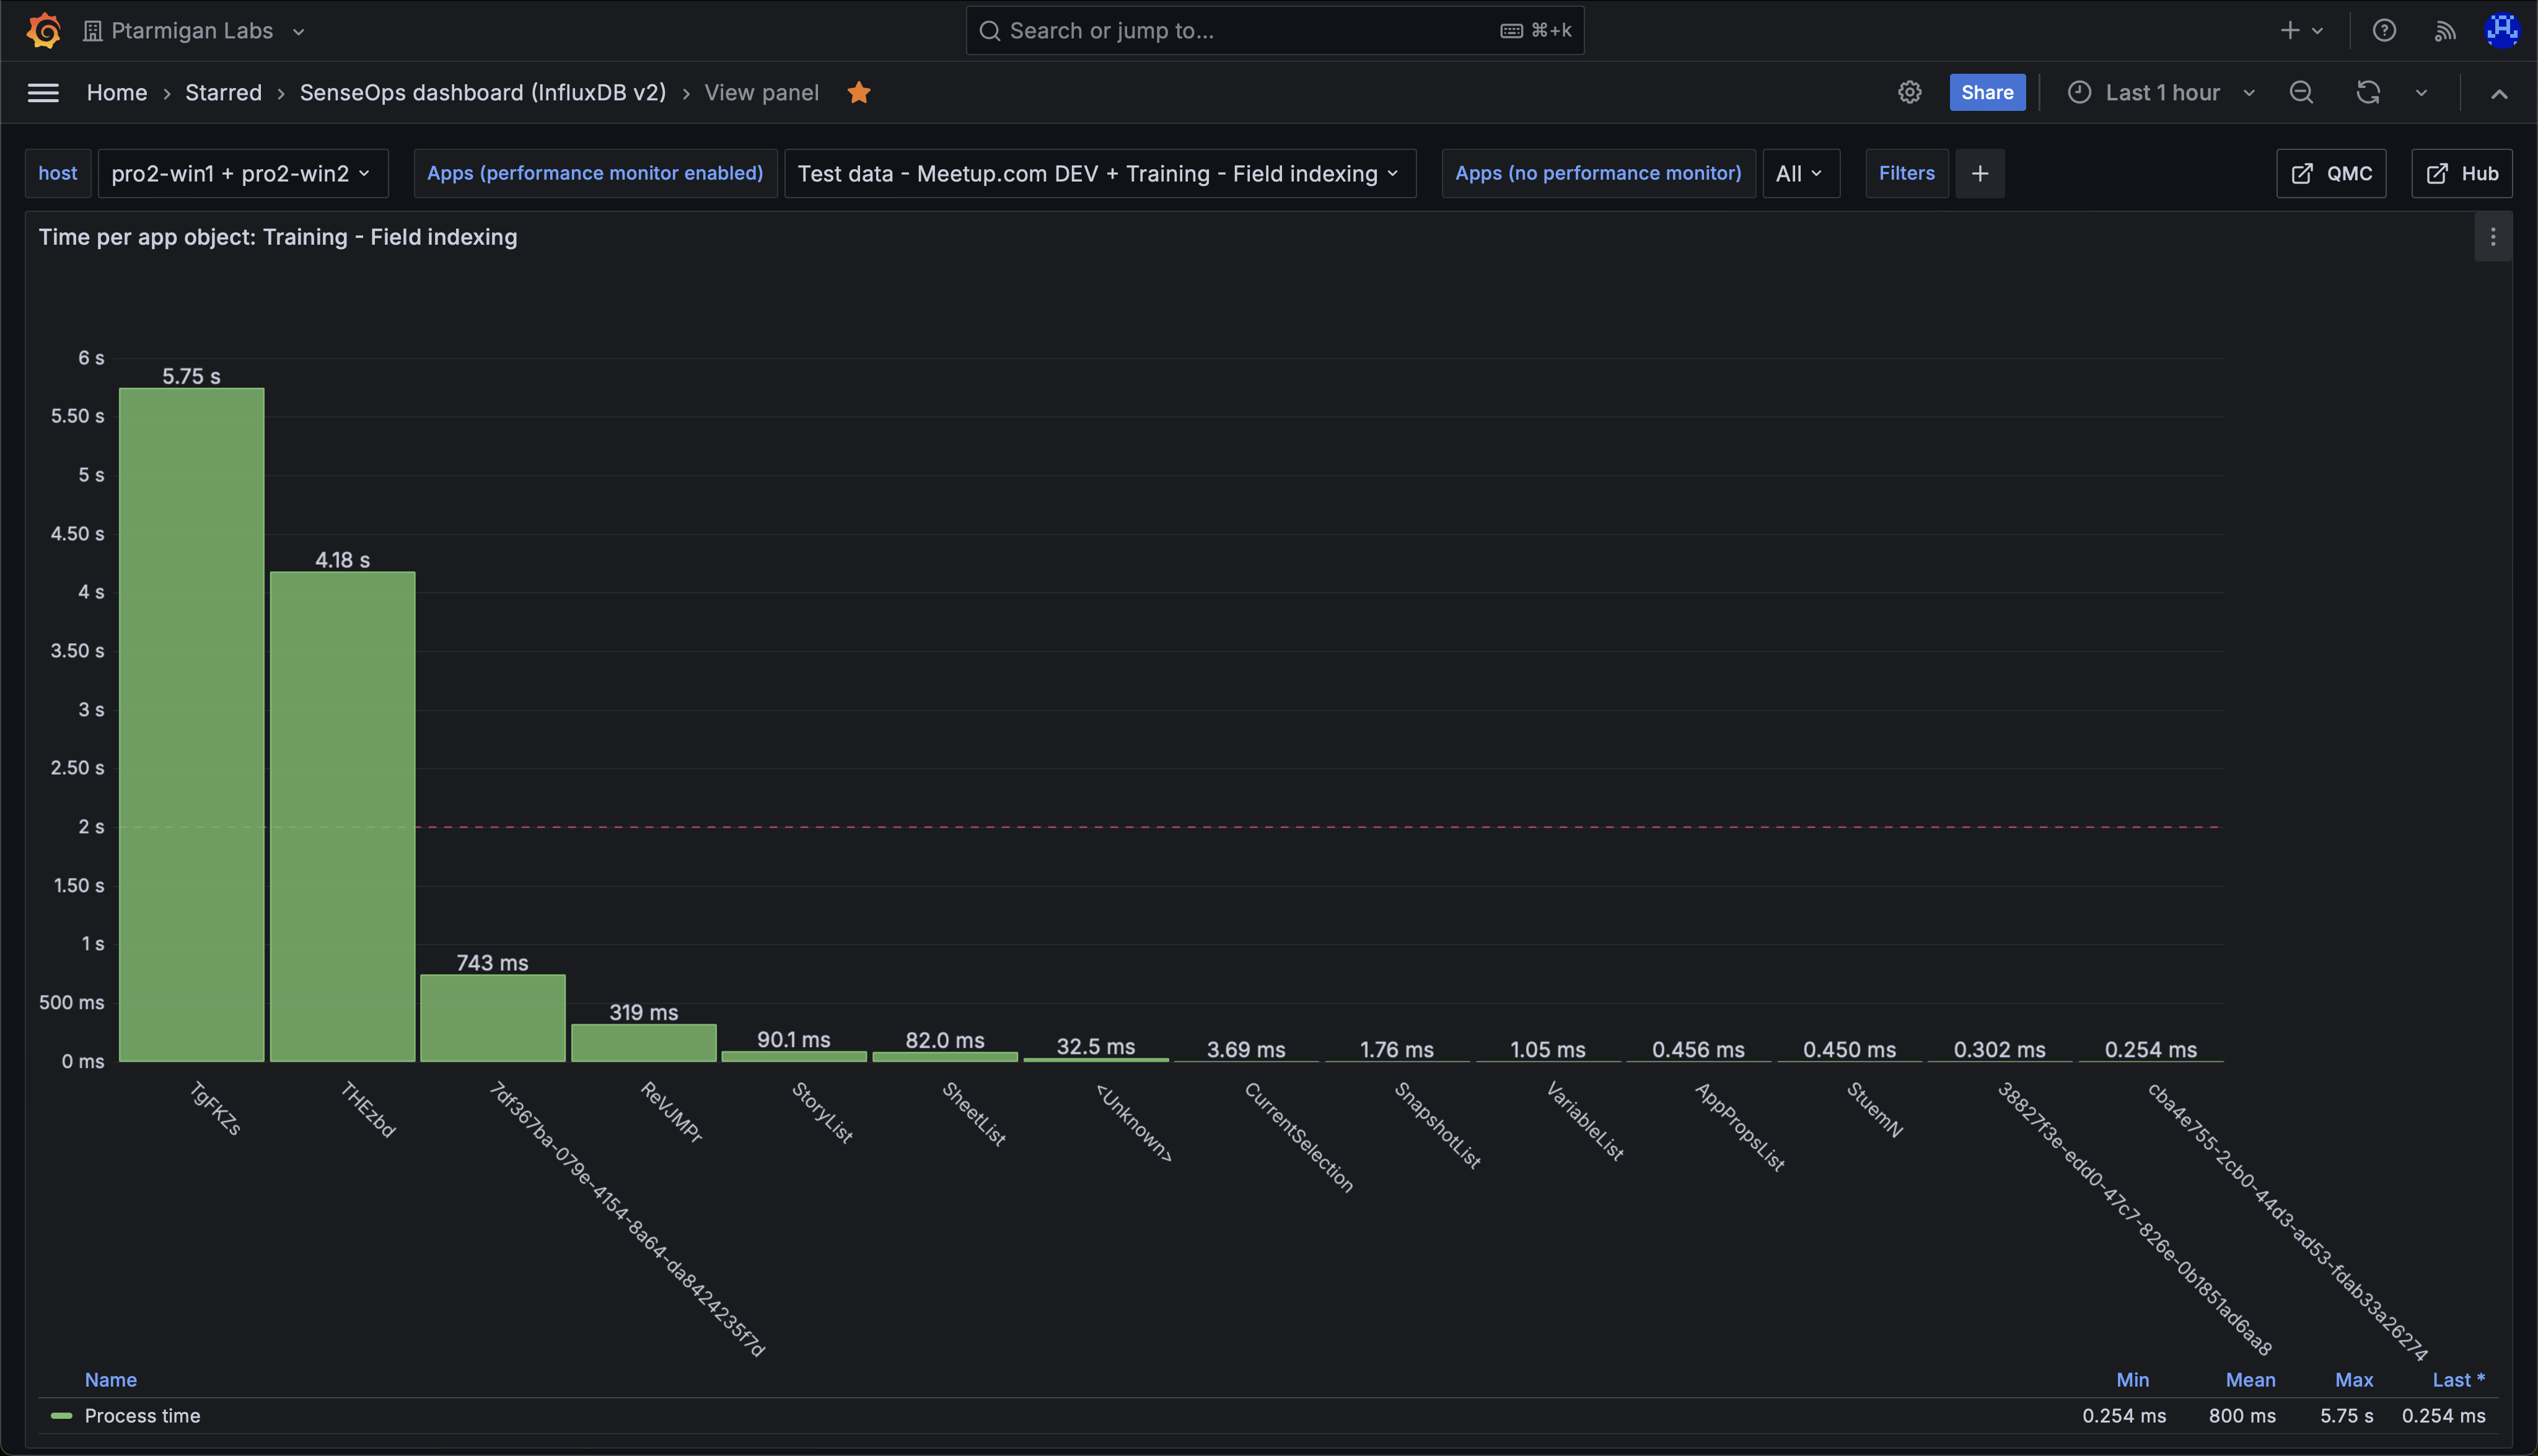
Here is a chart showing the average time for each app object to open and update:
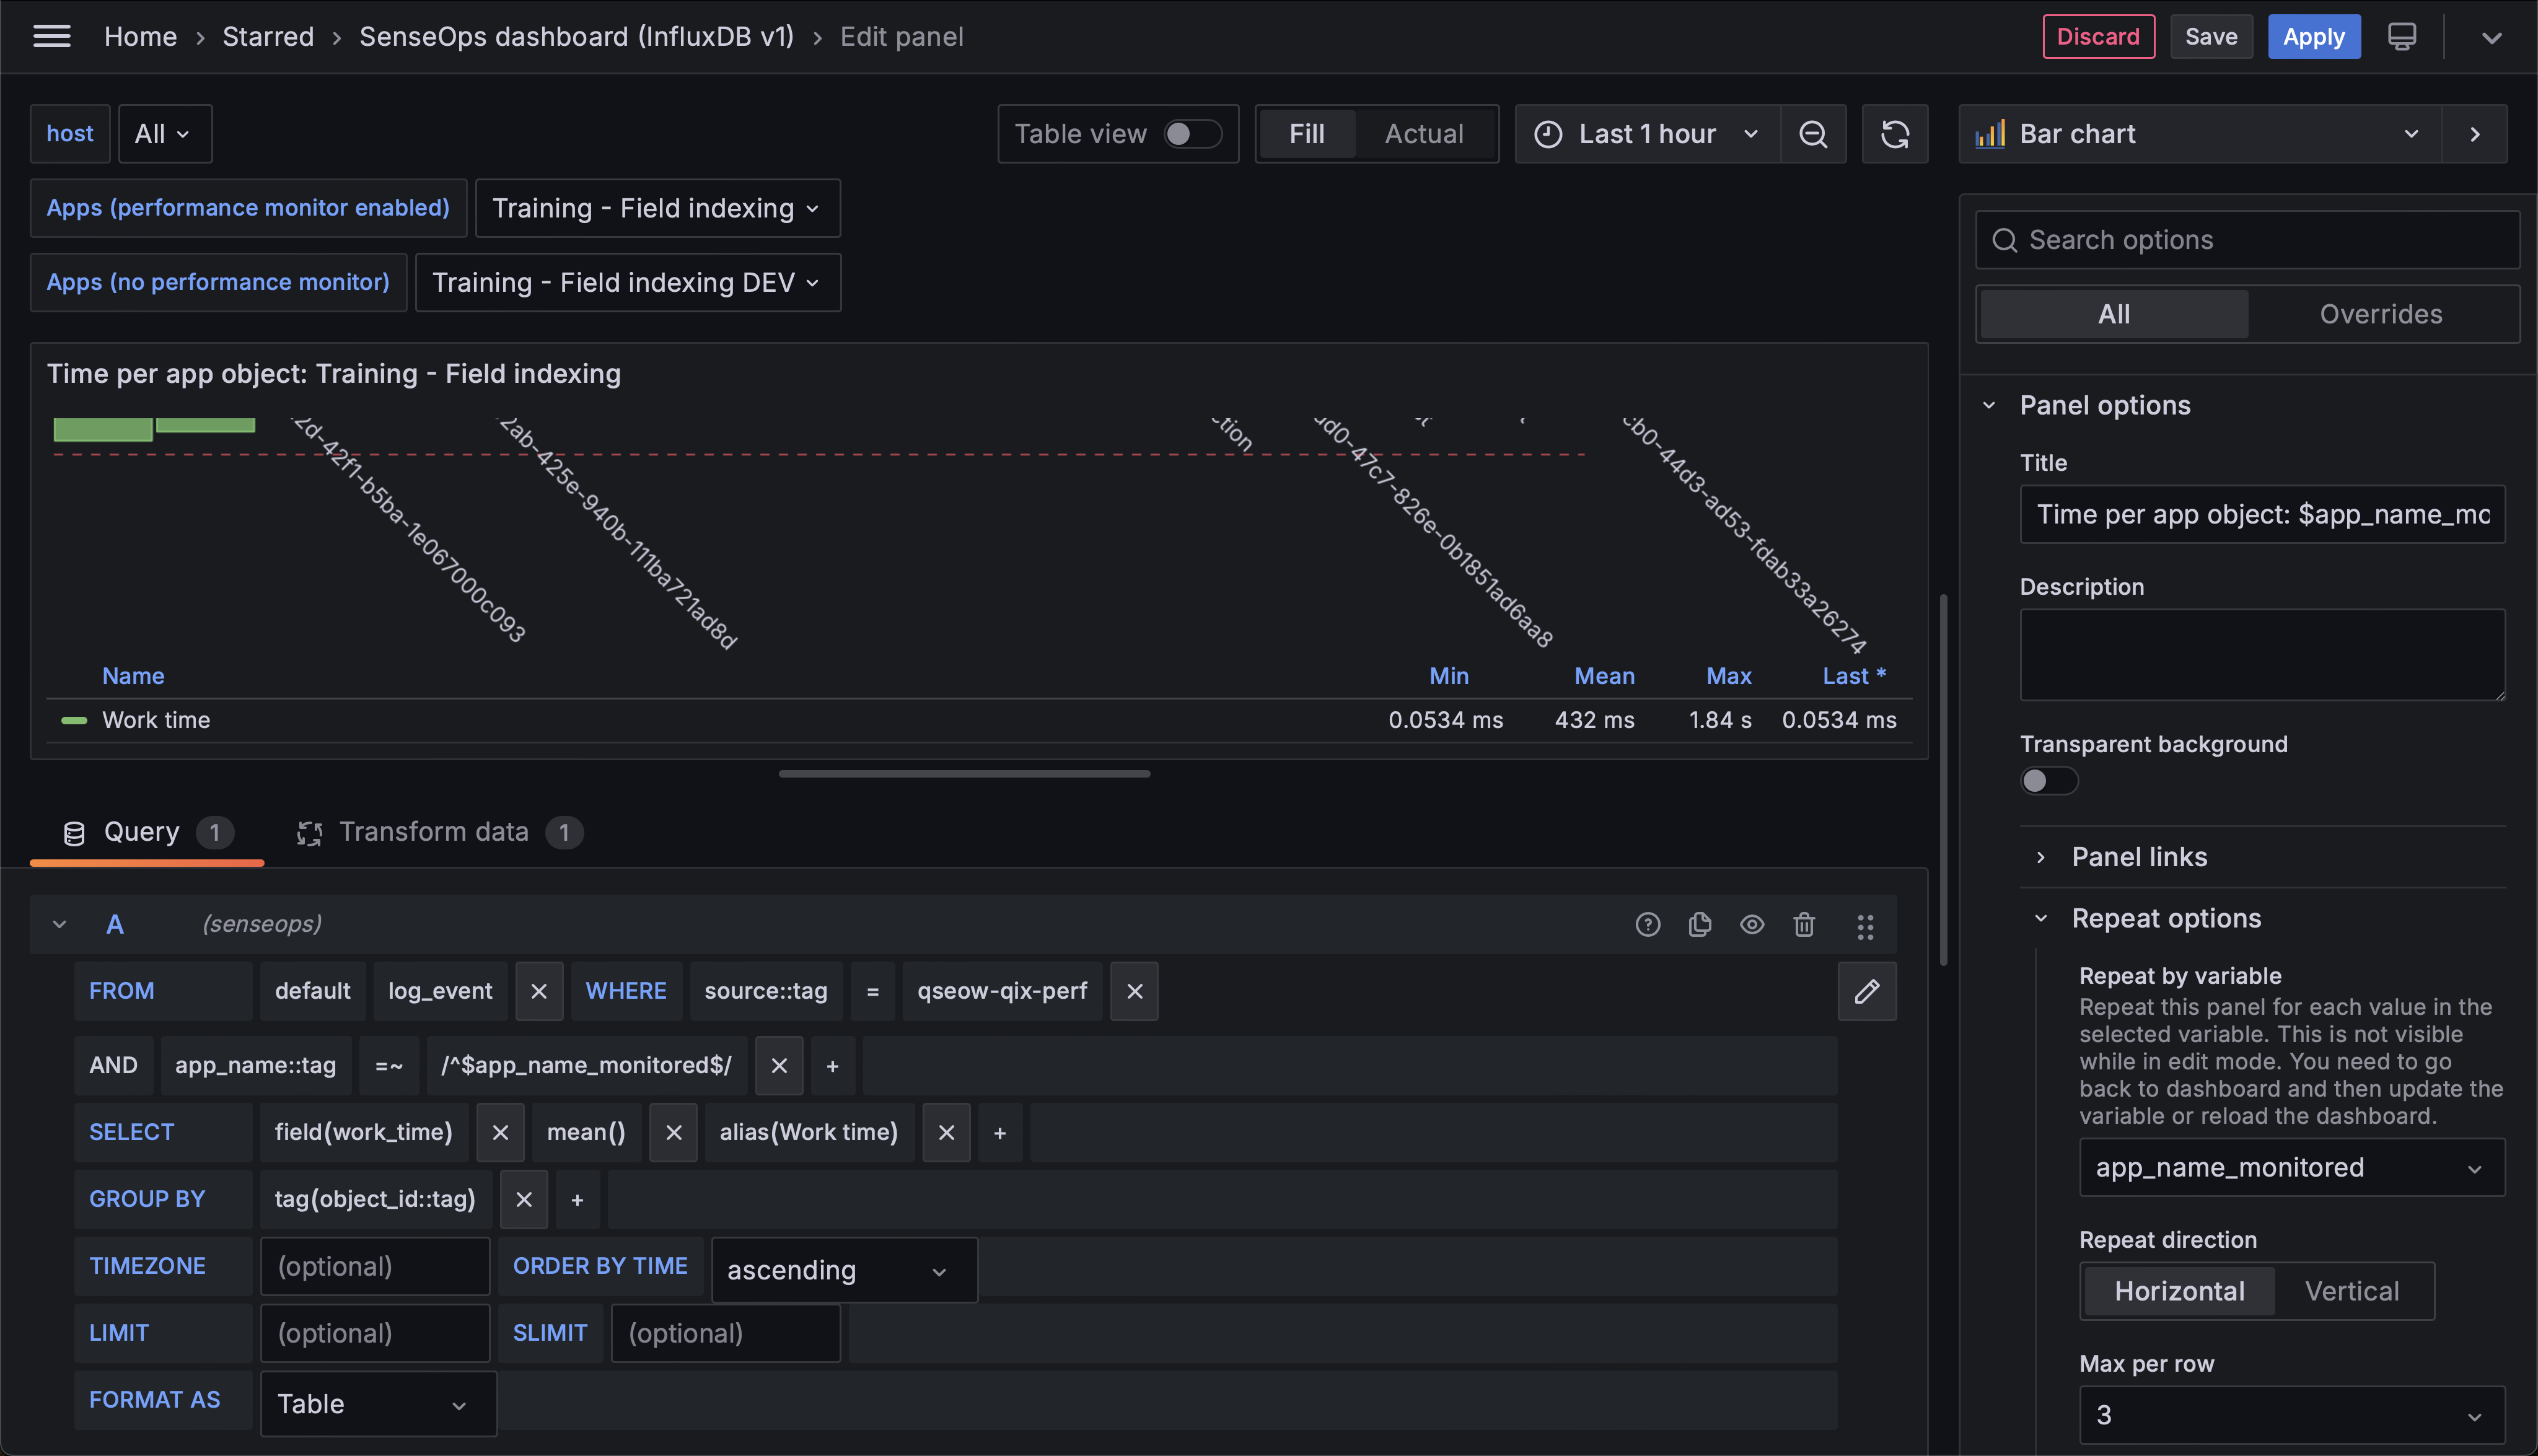 Definition of a Grafana chart showing the average time it takes to open and update each app object.
Grafana Variables
The chart repeats over the "app_name_monitored" variable, showing one chart for each selected app.
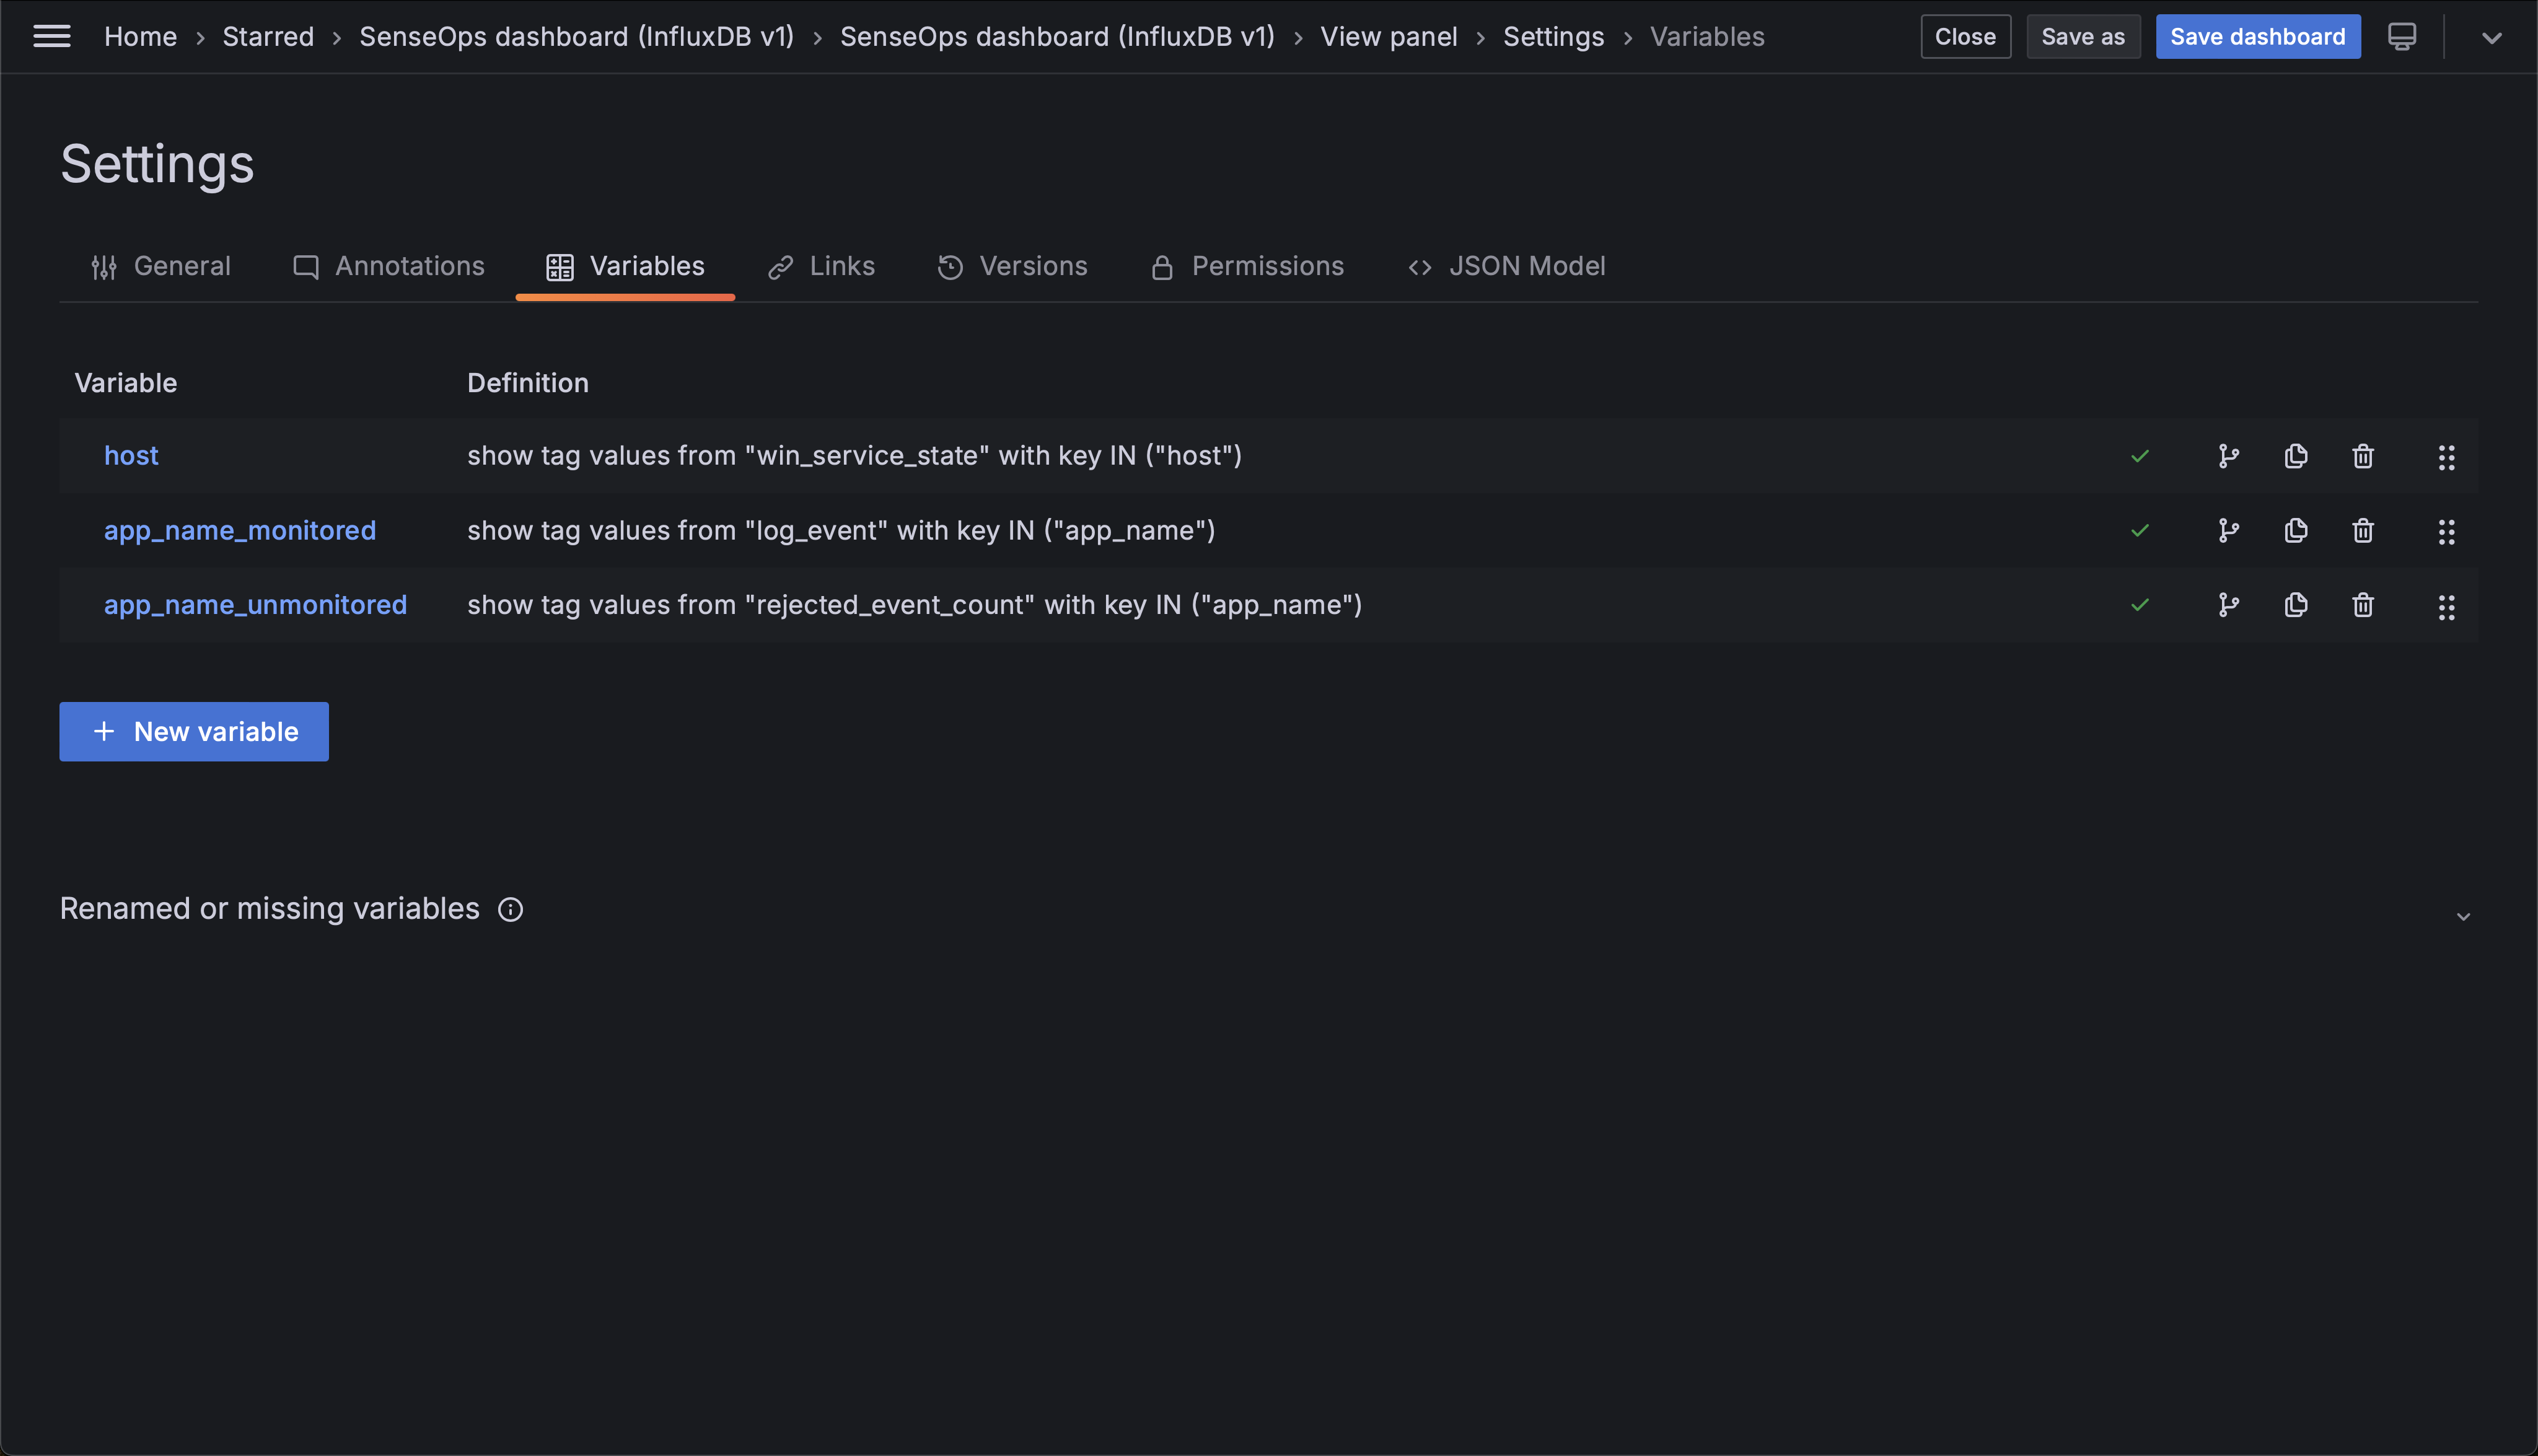 List of variables in a SenseOps dashboard in Grafana.
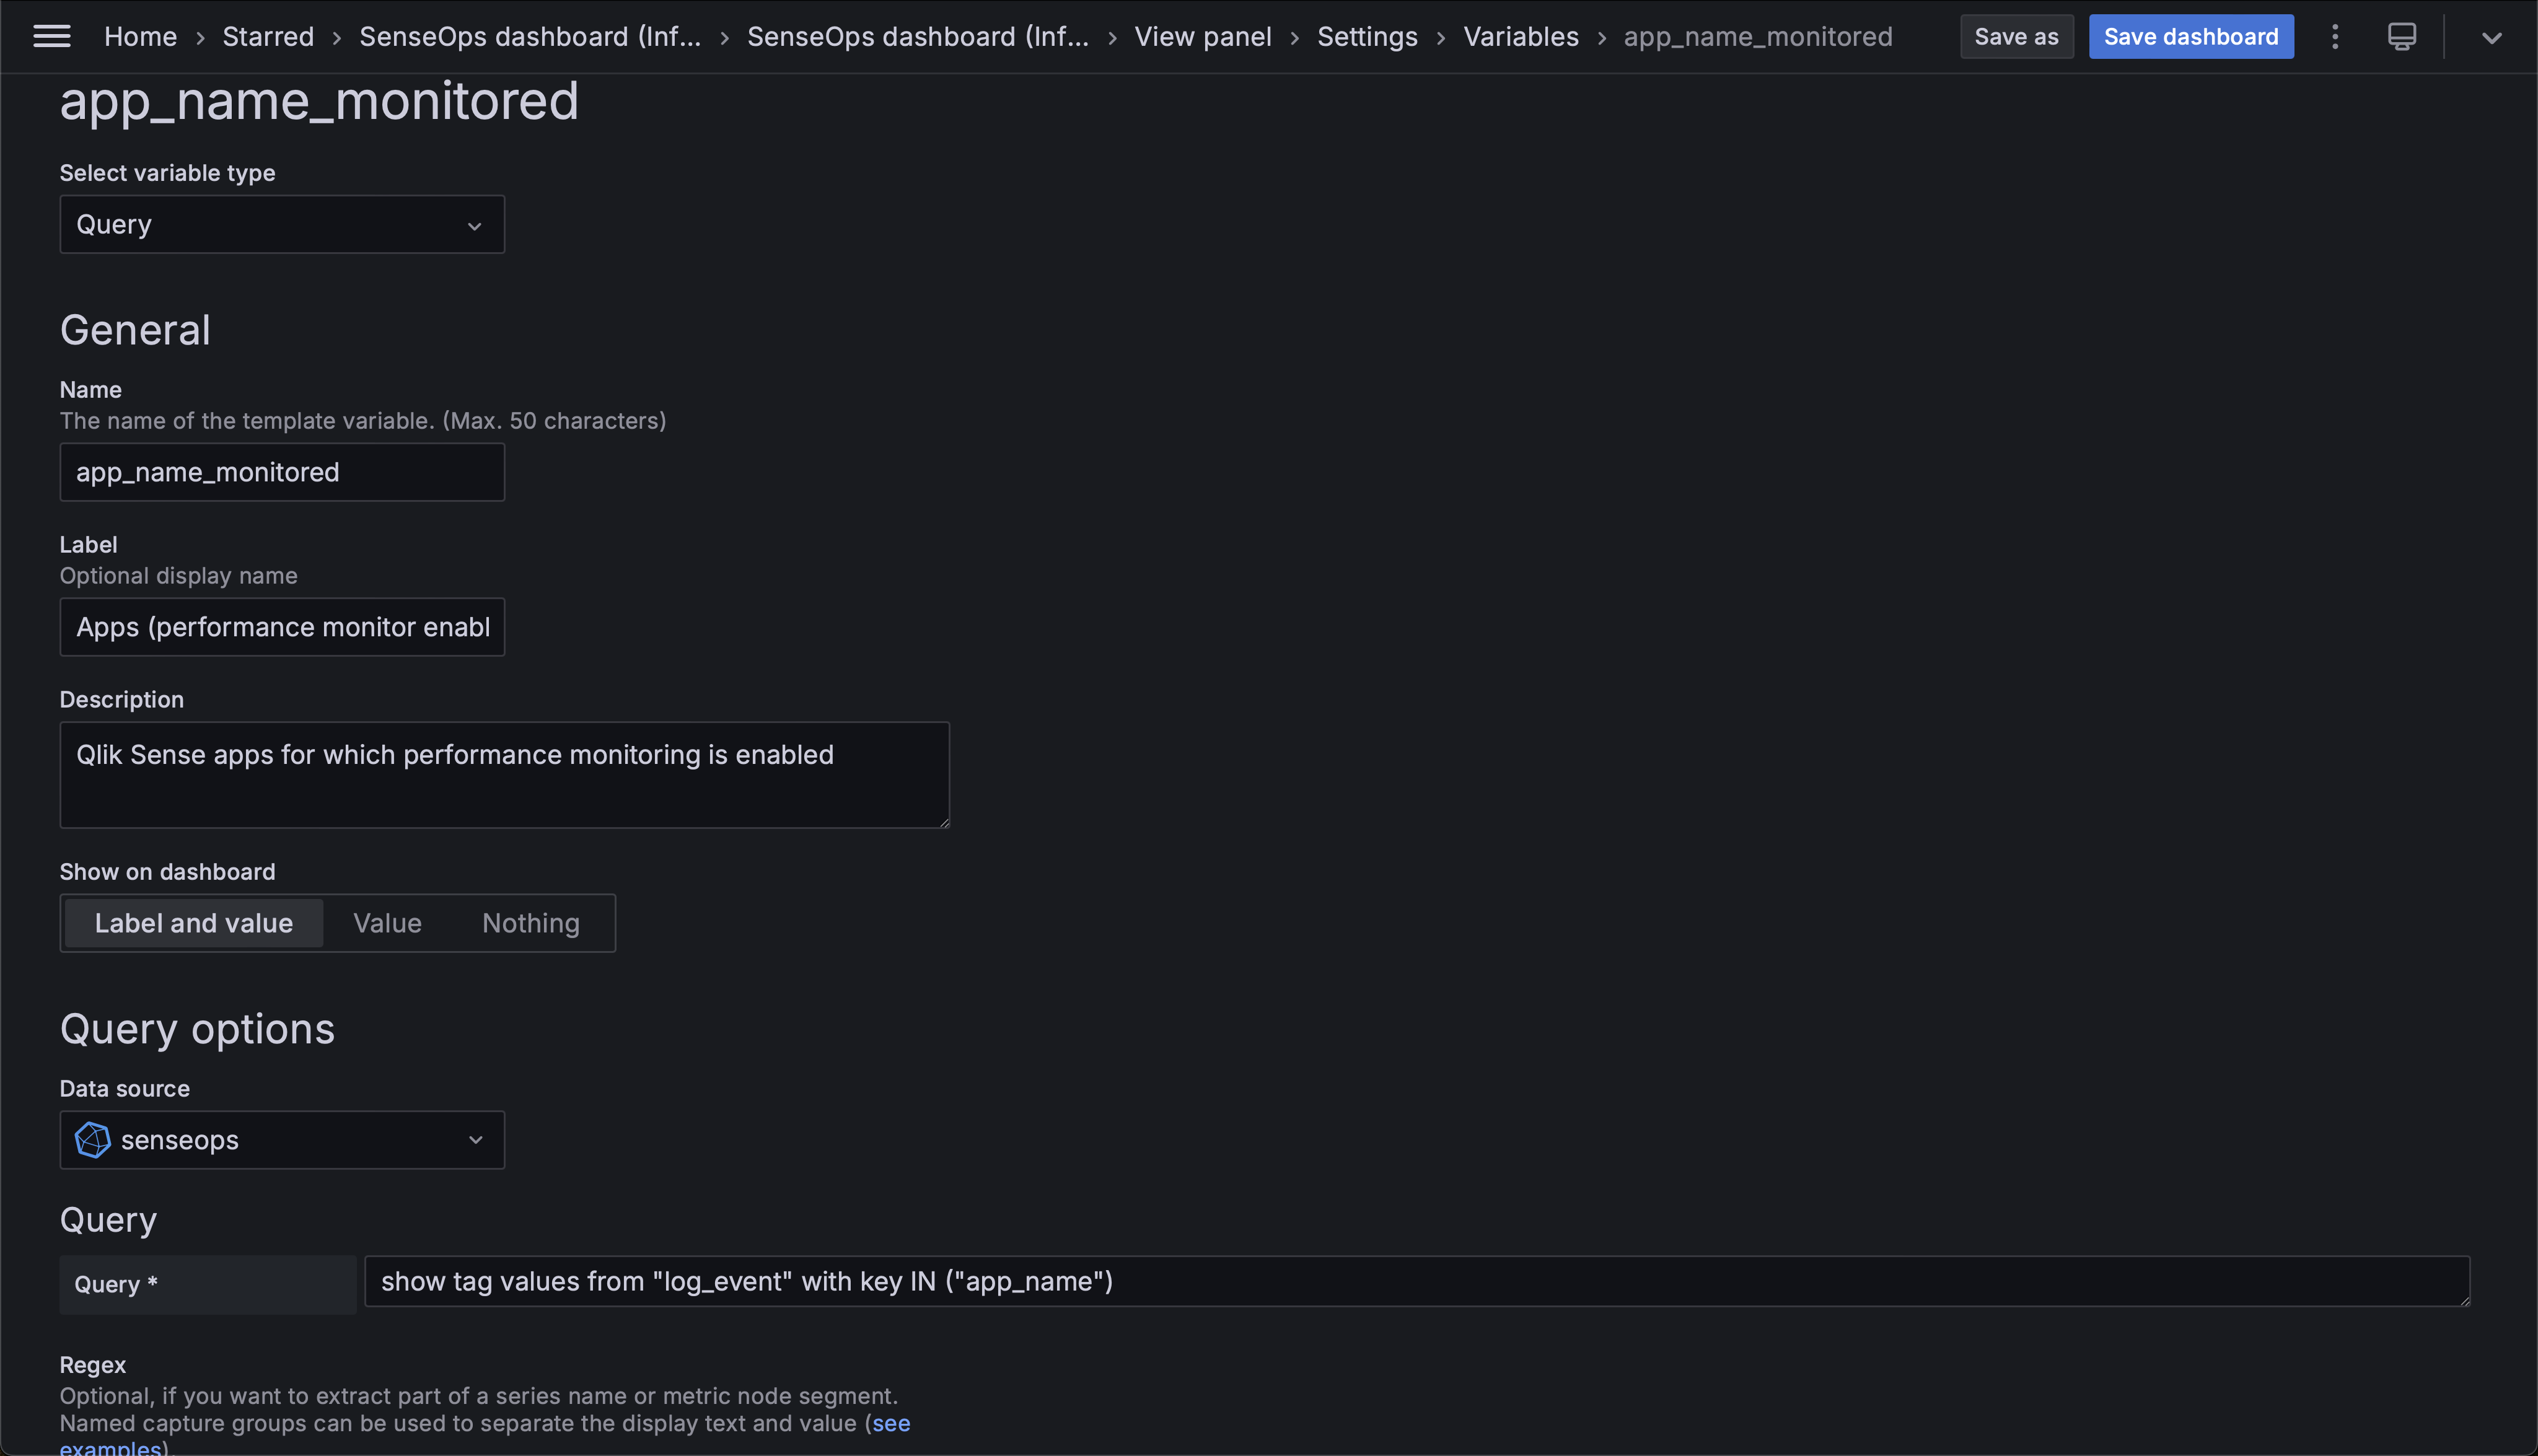 Definition of the "app_name_monitored" Grafana variable.
Next Steps
With detailed information captured about all app objects, you can slice and dice the data in many ways.
For example, see what kinds of app objects use the most time:
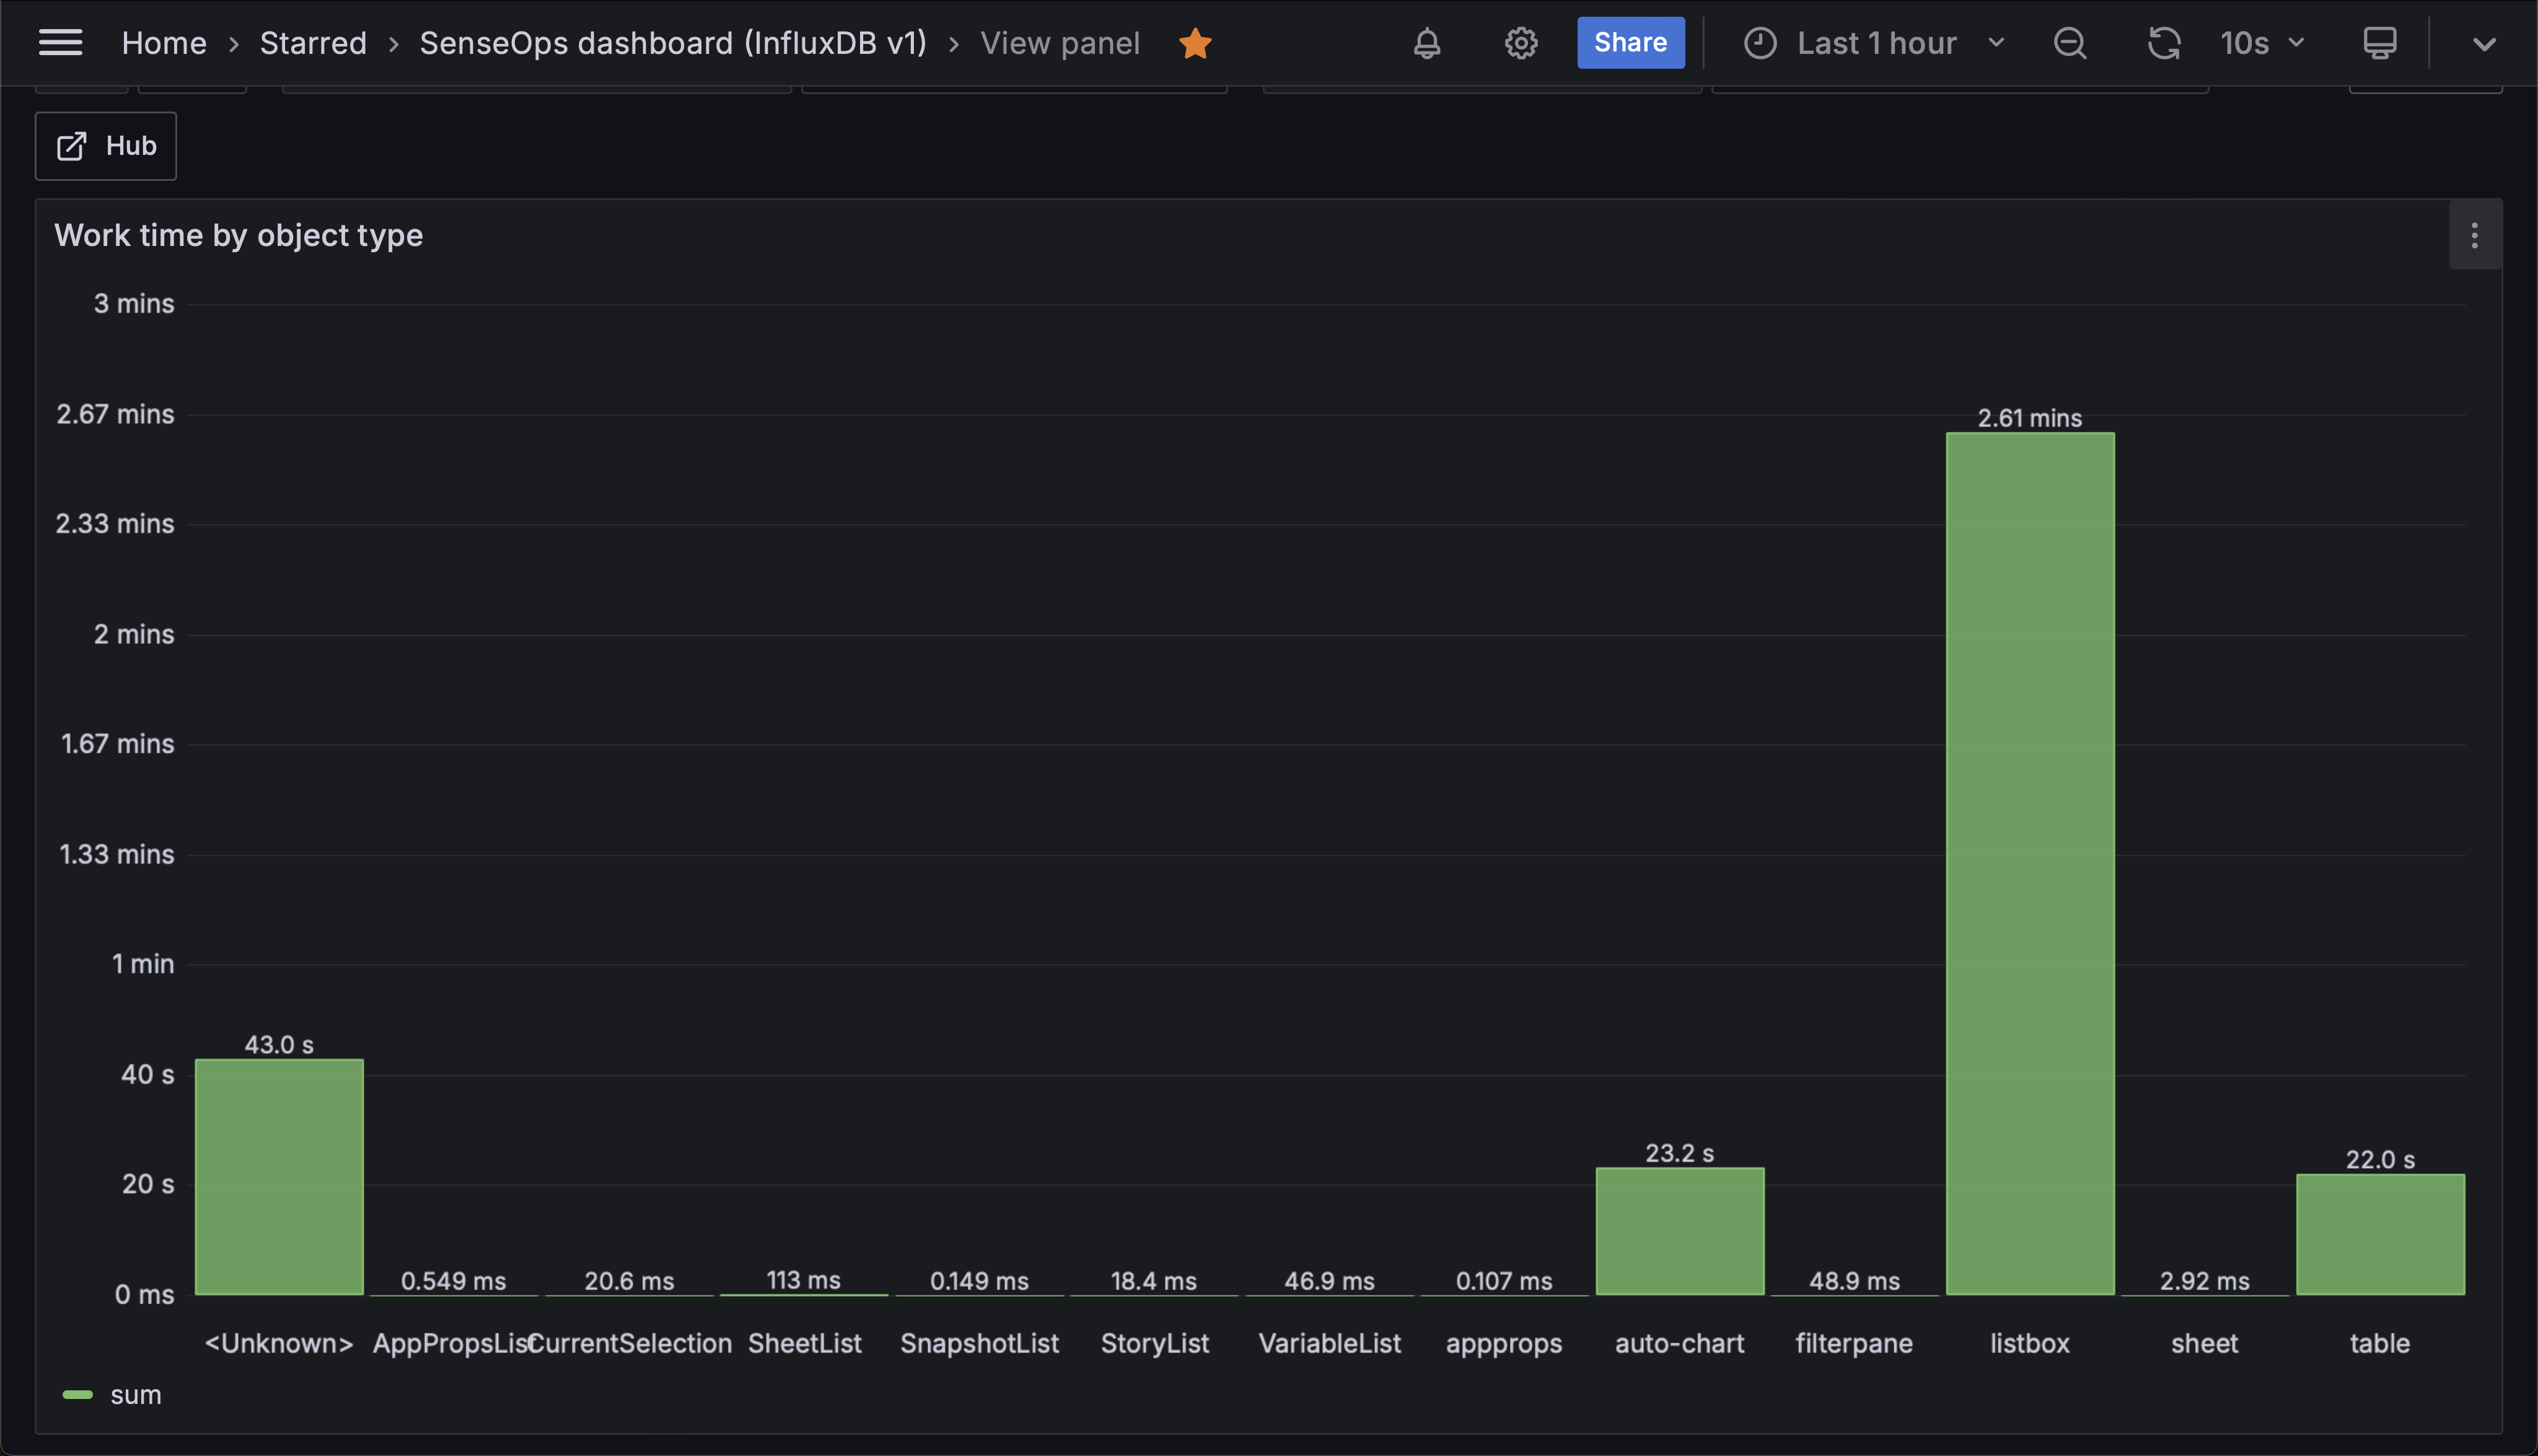 Chart showing the total time spent updating the app, grouped by object type, during last hour.
Related Topics
- Track App Open Times - Monitor app opening times
- Engine Performance Overview - Overview of performance monitoring
- Grafana Dashboards - More Grafana examples