Add New Relic as destination for SenseOps metrics.
Add optional scrambling of user id for user events sent to New Relic. #398
Send engine, proxy and session metrics to New Relic.
Bug Fixes
Compress stand-alone binaries.
Include New Relic status in telemetry data (23c292c)
Miscellaneous
Make proxy related log entries easier to understand.#392
Make user event log messages easier to understand. #396
More relevant log prefixes for proxy session logging.
Update dependencies to latest versions.
What’s new in version 8.1
Scanning for security risks and vulnerabilities is now done as part of the release process.
This is in addition to the daily scans that are also done (and have been done for a long time].
Clean up the Docker images (available on Docker Hub) in order to keep them as lean as possible.
What’s new in version 8.0
The version number change indicate this release contains breaking changes.
Well… When working on the release process for Butler SOS we happened to bump the version number too much. Oops.
No breaking changes in this version.
There’s a major new feature though: Pre-compiled, standalone binaries for Windows, Linux and macOS!
This has been planned for ages and we finally got around to implement it.
It may look like a minor change but it does make it easier to get started with Butler SOS:
You no longer have to first install Node.js, then install all the Butler SOS files.
All you need is now a single binary and a valid YAML config file (which hasn’t changed since previous version/7.x).
If you want to keep using a separate Node.js engine for running Butler SOS that’s perfectly fine too.
What’s new in version 7.0
This is a major release including features that have been on the roadmap for years, but never really graduated from the concept phase.
Until now, that is.
The big thing in v7.0 is the addition of a generic way to handle QSEoW warning and error events.
These used to be written to both log files and the Sense log database, but with log db gone those events only exist in the log files.
Butler SOS can now handle these events and store them in InfluxDB or re-publish them as MQTT messages.
Grafana dashboards attached to InfluxDB gives you close to a real-time view into Sense errors and warnings.
Or simply: Get the most important messages from the Sense log files sent in real-time to Butler SOS - and from there out into the world as needed.
⚠️ NOTE: Because of the significant nature of the changes below, this version includes some breaking changes.
⚠️ Added support for dealing with individual QSEoW log events.
Initially warning and error events from the proxy, scheduler and repository services are sent to Butler SOS.
MQTT topics matching the QSEoW subsystem where log events originated.
When sending log events to MQTT, there’s an option to send each log event to a MQTT subtopic corresponding to the QSEoW subsystem the event originated from. This is useful for 3rd party systems that want to detect (and probably take action based on) very specific QSEoW log events.
For example, a log event from the Service.Scheduler.Scheduler.Master.Task.TaskSession subsystem in QSEoW would be posted to the topic <some root topic>/service/scheduler/scheduler/master/task/tasksession.
⚠️ Improved handling of user activity events.
These can now be sent to zero or more different MQTT topics, each covering a specific kind of user activity (start/stop session, open/close connection etc).
⚠️ Take the first step towards removing support for QSEoW log db in Butler SOS.
There is no date set yet when log db support will be removed, but at some point that’s likely to happen.
In this release the previously existing InfluxDB measure log_event has been renamed to log_event_logdb.
The new log events introduced in v7.0 will be stored in the log_event message going forward.
The later library is no longer maintained and has been replaced by @breejs/later.
All libraries used by Butler SOS updated to latest versions.
Documentation site updated with respect to v7.0.
What’s new in version 6.0
First, while the switch to 6.0 indicate there are breaking changes, that’s not entirely true.
There are however significant changes to many parts of the code base.
The code is now better, more modern, scalable and in general better structured.
Plenty of testing has been done, but in order to highlight that lots of changes were done, we decided to move to 6.0 rather than 5.7.
Added Prometheus support.
Most Butler SOS metrics are now exposed on a Prometheus-friendly endpoint. They can thus easily be scraped by and ingested into Prometheus.
Once in Prometheus the Qlik Sense metrics can be visualized using Grafana (just as before when using InfluxDB), but also used in very capable alerting scenarios. Prometheus has great integrations with many incident management tools, for example.
The Prometheus endpoint also include general Node.js metrics that can be used to monitor Butler SOS itself.
Switched process for doing releases of Butler SOS.
Things are now more automated which should result in more predictable and consistent version numbers. The changelog file will be auto-generated going forward (it will start from version 5.6.0, older version still available as changelog_old.md).
What’s new in version 5.6
Added user event monitoring. Up until now this has been a feature of Butler, but as this feature is very much within the domain covered by Butler SOS, it’s moving here instead.
The events monitored are session start/stop (typically users logging in/out/timeout) and connection open/close (typically an app being opened/closed in a browser tab).
Added a blacklist for user sessions. If a user is added to the blacklist, the detailed session data for that user will not be saved to InfluxDB.
The user will still be included in the session summary metrics and count towards the total number of sessions, at any given time.
Note: The blacklist only applies to storing detailed session data in InfluxDB, MQTT (if enabled) is not affected by the blacklist.
Anonymous telemetry added. Same set of data included in other Butler tools, i.e. only information about what the execution environment of Butler SOS looks like and which features are enabled.
The rationale for adding telemetry is to give Butler SOS developers a better understanding of on what kinds of servers the software is used. This insight will make it easier to develop future Butler SOS versions.
Continuing the journey towards using the same formatting principles in the config files for all the various Butler tools.
In Butler SOS’ config file there’s been a mix between “enabled”, “enable”, “enableMqtt” etc to tell whether a certain feature should be enabled or not. Confusing.
We’re moving towards only using “enable” for this. This release changes this for most config file entries.
Rest assured though, the old format will still work - but you are strongly recommended to adapt the current config file format as it includes settings for other new (as of version 5.6) features too.
Various bug fixes, performance improvements and fixed typos.
What’s new in version 5.5
Docker images for various Arm architectures are now created as part of the standard release process.
What’s new in version 5.4
This video gives an idea of what Butler SOS is capable of.
Highlights of version 5.4 include:
Sample dashboards are now built using the brand new, shiny and all together awesome Grafana 7. Did we mention that Grafana 7 is awesome? Awesome.
Ever wondered how long Butler SOS has been running or how much memory it uses? The new uptime messages have you covered.
You are properly impressed with the uptime messages - good. Why not store them to Influxdb, so you can also visualize Butler SOS’ own memory use? It’s just a couple of changes in the config file away.
Don’t want to use the Docker healthchecks? No reason to if you don’t user Docker. You can now turn it off in the config file.
Ah, you are a serious Sense user and have separate DEV and PROD environments? Good - now Butler SOS tags its own memory use so you can monitor each Butler SOS instance separately.
Who will monitor the monitor? Butler SOS can now send heartbeats to customizable URLs at desired intervals. Perfect if you want to monitor Butler SOS using for example healthchecks.io. Very, very cool actually.
Bugs, bugs and bugs. The known ones have been fixed. Keep reporting new ones!
Update all dependencies to latest versions, to ensure security concerns are addressed.
Information about the Butler SOS software, community, docs and more.
Are you stuck on something while setting up Butler SOS? Got ideas for new features?
Don’t hesitate to post your thoughts in the Butler SOS forums.
1.1 - Butler SOS
An introduction to Butler SOS.
The Butler SOS project is about adding best-in-class monitoring to the client-managed Windows version of Qlik Sense Enterprise, also known as QSEoW (Qlik Sense Enterprise on Windows).
The goal is to provide a close to real-time view into what’s happening in a Qlik Sense environment.
At different times different metrics will be of interest.
For that reason Butler SOS stores all metrics from Sense in a time-series database (InfluxDB and Prometheus both supported), from which dashboards, reports etc can be created using tools such as Grafana.
Grafana is an open source, world-class visualization tool for time series data. It also has great alerting features and integrate with all kinds of alerting solutions, email, Teams, Slack and more.
If you don’t fancy InfluxDB or Prometheus, Qlik Sense metrics and events can also be sent to New Relic for storage and visualization.
They offer a free tier that will go a long way towards testing out a cloud-based visualization solution for Butler SOS.
Metrics are a major component of operational monitoring, but it’s also important to keep on top of what errors and warning occur in the system.
As of late 2021 the log database is no longer part of QSEoW, with the log files the only place where you can find those errors and warnings.
Butler SOS address this by sending log events in real-time from QSEoW to Butler SOS, which then stores them in InfluxDB, and/or send them to New Relic, and/or re-publish them as MQTT messages.
This basically means you will very rarely have to plow through endless log files to find information about warnings and errors that have occurred.
Warnings and errors can also be categorized by Butler SOS, making it much easier to understand what is happening in your Sense environment.
By listening in on the Qlik Sense log events from the associative engine, Butler SOS gets very detailed information about what is happening in the engine (which is where the magic happens).
This means you get very detailed information about what is happening in your Sense apps, sheets and charts - as it happens.
A chart that takes too long to render, an app that opens slowly, a sheet that is slow to load - all these things can be monitored in real-time.
Butler SOS also tracks user agents of all users accessing your Sense environment.
This means you get real-time insights into what operating systems and browsers are used to access your Sense environment.
There is a clear goal that Butler SOS should be very configurable.
In practice this means that features can be turned on/off as needed, improving security and lowering memory usage.
Butler SOS is written in Node.js and runs on most modern operating systems.
Stand-alone binary files are created for Windows, Linux and macOS.
Windows and macOS binaries are signed with a code-signing certificates, making it easier to install and run on those platforms.
You can run Butler SOS on the same server as Qlik Sense, in a Docker container on a Linux server, in Kubernetes, on Mac OS, on Raspberry Pi (not a good idea.. but possible and proven to work).
Butler SOS is a member of a group of tools collectively referred to as the “Butler family”, more info is available here.
1.2 - The Butler family
Please meet the Butlers. They’re a nice, wild bunch!
Butler started out with a very specific need to start Sense reloads from outside systems.
Over the years a few projects (for example Butler SOS, which simplifies day 2 operations ([1], [2]) have spun off from the original Butler project, and still other projects have been created from scratch to solve specific challenges around developing Sense apps and running Qlik Sense server environments.
Automates the creation of sheet icons for Qlik Sense Enterprise on Windows (QSEoW) applications.
It’s a cross platform command line tool which given the correct Sense credentials will take screen shots of all sheets in a Sense app (or all apps on a Sense server!), then create thumbnail versions of those screenshots.
Finally those thumbnails will be set as sheet icons.
No more manual screenshot taking, resizing images, navigating hundreds of sheets in dozens of apps.
Start Butler Sheet Icons instead and go get a nice fika.
The tool can be used stand-along or as part of an automated release process.
Given the name of this tool it doesn’t sound like a member of the Butler family.
Let’s say Ctrl-Q is a sibling of the Butler bunch.
While the Butler tools are (usually) intended to solve and simplify rather specific use cases, Ctrl-Q is aimed at being the lazy Qlik developer’s best friend.
Let’s say there is some manual, tedious, time consuming and error prone activity that a Qlik Sense developer is faced with.
For example importing dozens of apps from QVF files and creating a hundred associated reload tasks.
Ctrl-Q lets you do this with a single command, using definitions in an Excel file. Instead of spending a day on this the actual execution takes a minute or so.
In other words: Ctrl-Q focus on high-value use cases that are difficult or impossible to solve using other tools.
Butler Cache Warmer. Cache warming is the process of proactively forcing Sense apps to be loaded into RAM, so they are readily available when users open them.
Using Butler CW is an easy way to make your end users’ experience of Sense a little better.
This tool is mainly of interest if you have lots of QVDs and apps, but when that’s the case it’s of paramount importance to understand what apps use which QVDs. In other words what data lineage looks like.
Butler Spyglass also extracts full load scripts for all Sense apps, creating a historical record of all load scripts for all Sense apps.
This tool makes it easy to tap into the Qlik Sense notification API. From there you can get all kinds of notifications, including task reload failures and changes in session state (user login/logout etc).
Visual looks is important when it comes to analytics, and this holds true also for Sense apps.
The Butler Icon Uploader makes it easy to upload icon libraries (for example Font Awesome) to Qlik Sense Enterprise. With such icons available it is then easy for app developers to use professional quality sheet and app icons in their Sense apps.
This is the main use case for Butler SOS, with a large number of monitored metrics.
Butler SOS can be configured to store these metrics in InfluxDB/Prometheus and/or send them as MQTT messages.
Session count
A session (or more specifically, a “proxy session”) is created when a user logs into Sense.
The session is typically reused when a user opens additional Sense apps from the same browser.
Knowing how many users are logged at any given time gives a Sense admin an understanding of when peak hours are, when service windows should be planed, whether the server(s) is too small or too big etc.
The session metrics are arguably among the most important ones provided by Butler SOS
Applications
Butler SOS tracks how many and what applications (IDs and app names) are in loaded into the monitored Qlik engine(s).
In-memory and active applications are also tracked in the same way.
These metrics provide useful insights into the degree to which loaded apps are actually used and to what degree caching is in effect.
A couple of bonus metrics are also included: Number of calls made to the Qlik associative engine and number of selections done by users in the engine. Not really useful as such, but they do serve as a good relative measurement of how active users are between days/weeks/months.
Cache status
The caching of applications in RAM is one of Qlik’s classic selling points. But is it really working?
Butler SOS provides a set of metrics (bytes added to cache, lookups, cache hits/misses etc) that give hard numbers to the question of whether the cache is working or not.
While this is probably not as interesting from an operational perspective as user session counts, RAM usage and errors/warnings from the Sense logs, the cache metrics should definitely be monitored over medium timespans.
For example, if the cache hit ration goes down over weeks or months, that could mean a poorer user experience over that same time period.
Monitor server metrics
Some basic server metrics (free RAM and CPU load) are monitored by Butler SOS. You may have other, dedicated server monitoring tools too - Butler SOS does not replace these.
It’s however often convenient to have both server and Sense metrics side by side, thus Butler SOS includes some of the more important server metrics in addition to the Sense ones.
These metrics are only stored in InfluxDB/Prometheus, i.e. not sent as MQTT messages.
Available memory/RAM
As Qlik Sense is an in-memory analytics tool you really want to ensure that there is always available memory for users’ apps.
If your Sense server runs out of memory it’s basically game over.
Now, Sense usually does a very good job reclaiming unused memory, but it’s still critically important to monitor memory usage.
One error scenario that’s hard or impossible to catch without Butler SOS style monitoring is that of apps with Cartesian products in them.
They can easily consume tens of hundreds GByte of RAM within seconds, bringing a Sense server to a halt.
Butler SOS has more than once proven its value when debugging this specific issue.
CPU load
If a server is heavily loaded it will eventually be seen as slow(er) by end users, with associated badwill accumulating.
Log events: Qlik Sense errors & warning
The Sense logs are always available on the Sense servers, the problem is that they are hard to reach there - at least in real time.
Retrospective analysis is also cumbersome, you basically have to manually dig up the specific log files of interest and then search them for the needed information.
Qlik does provide good analysis apps for the logs, but they are not real-time and they must be reloaded (which tends to be slow and resource intensive) to show new data.
Butler SOS simplifies this greatly by having select log events (warnings, errors and fatals by default) sent from the Sense servers to Butler SOS.
Once such a log event message arrives, Butler SOS will store it in its database (for example InfluxDB or New Relic), from where the log event can be visualized using Grafana or within New Relic.
Log events from several Qlik Sense services can selectively be forwarded to Butler SOS:
Engine
Proxy
Repository
Scheduler
A sample use case of log events:
Create a Grafana or New Relic real-time chart showing number of warnings/errors per 5-minute window.
Set up an alert in those tools to notify you when number of events during past 5 minutes go above some limit.
This is trivial to set up, but gives you a very capable, close to real-time error/warning monitoring solution.
Log events can also be re-published as MQTT messages. This makes it possible for 3rd party systems to trigger actions when certain log events occur in Qlik Sense.
Categorization of log events
By categorizing log events, Butler SOS makes it much easier to understand what is happening in your Sense environment.
For example, if you categorize log events as follows:
reload failures as “reload_failures”
engine related errors/warnings as"engine"
Active Directory related errors as “active_directory”
permission denied related messages as “permission”
…you can then easily create Grafana charts that show number of warnings/errors per category, and also clearly show how many unknown log events there are.
It’s also easy to track volume of warnings/errors over time, and to set up alerts when number of events go above some threshold.
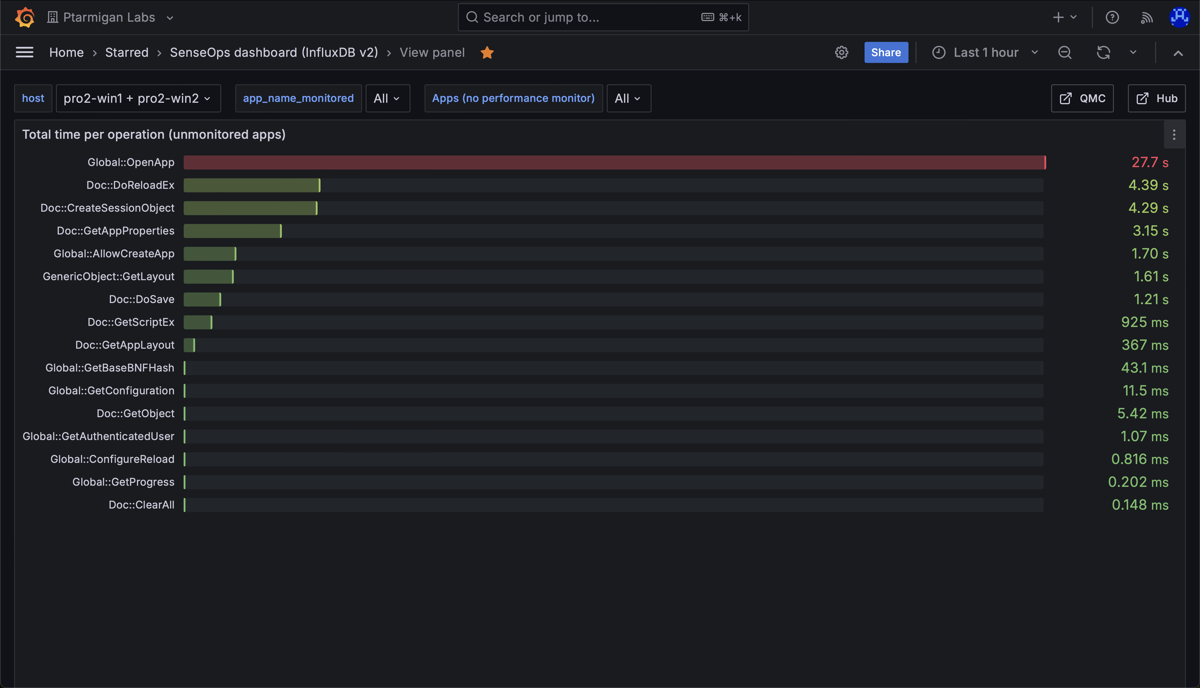
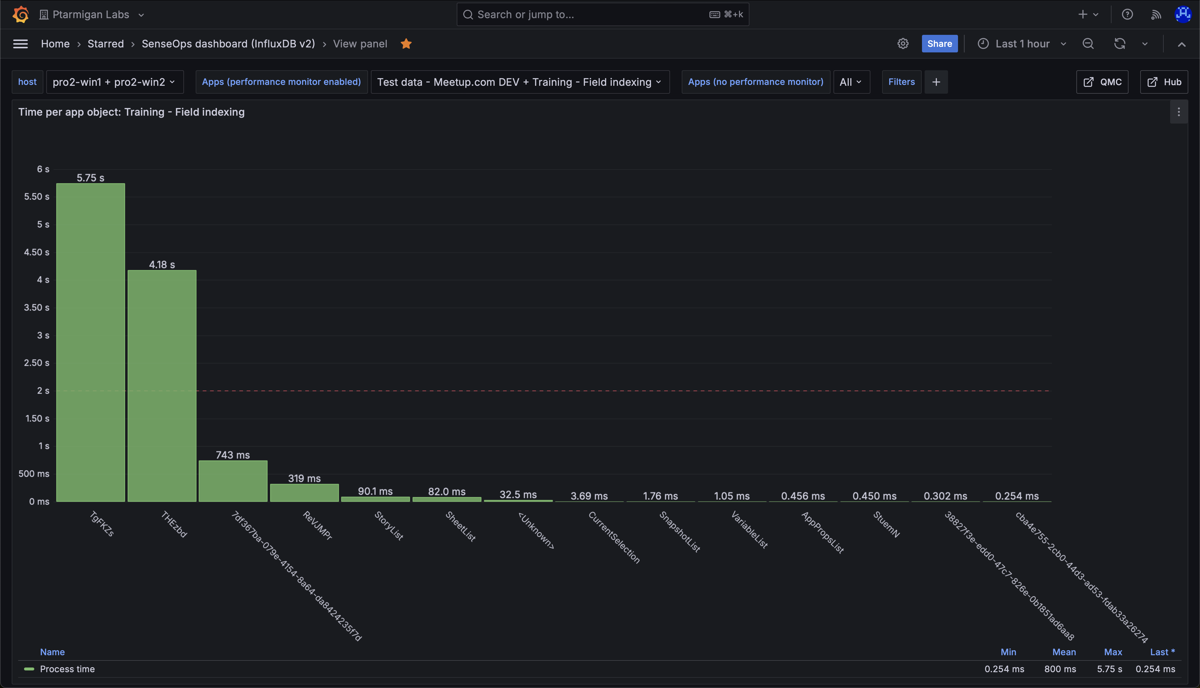
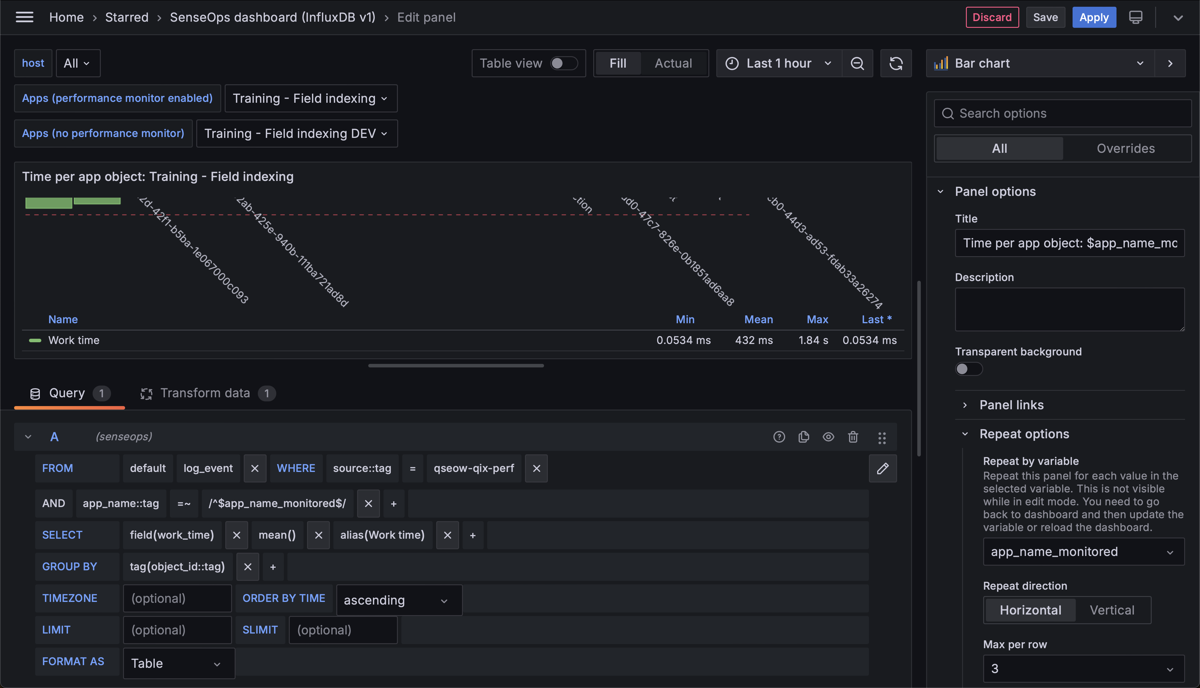
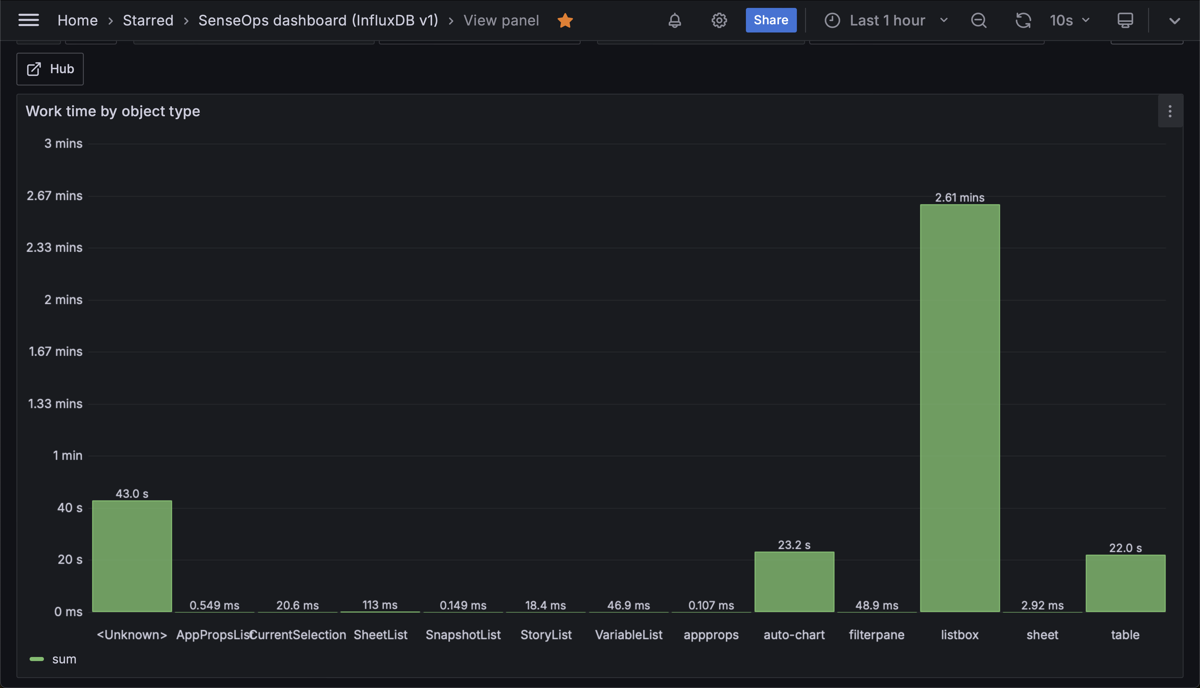
Engine performance log events
Butler SOS can also process performance log events from the Qlik associative engine (the “Qix” engine as it was called in older versions of Sense).
These events provide very detailed insights into how the engine is performing, including how long it takes to calculate expressions, how long it takes to open apps, how long it takes to calculate charts etc.
And how much memory each of those operations consume.
This is a very powerful feature, but when enabled in Qlik Sense (from the QMC) it will generate a lot of data that will all be store in the Sense log files.
By configuring Qlik Sense to send these events to Butler SOS instead of storing it in ever growing log files, you gain several advantages:
The data is stored in a time series database, making it easy to visualise, analyze and alert on in real time.
By applying retention policies in the database, you keep only the most recent data, thus saving (lots of!) disk space compared to storing all data in log files on the Sense servers.
Let’s look at a few examples of what data volumes are generated by these events:
A user opening a Sense app will generate 15-20 log events.
Making a selection in a chart will generate 10-15 log events.
A scheduled reload will generate 5-10 initial log events, then one progress event every 2 seconds, and finally 5-10 log events when the reload is done. For long running reloads this can easily generate 1000+ log events.
When enabled via the QMC, the associated Sense log files can easily reach millions of lines per day week even on a relatively small Sense environment.
Butler SOS lets you handle this data in a more efficient way.
The log database
The log database in Qlik Sense Enterprise on Windows is deprecated as of late 2021.
Butler SOS still maintains support for older QSEoW versions. At some point in the future this support is however likely to be removed.
This feature relies on Butler SOS querying log db with certain intervals (typically every few minutes).
A list of recent log events are returned to Butler SOS. The events are de-duplicated before stored in InfluxDB.
This essentially achieve the same thing as the more modern log event feature of Butler SOS - but with longer delays.
The log event model is almost instantaneous whereas the log db polling will be its very nature result in non real-time data.
User activity events
Detailed events are available for all users:
Session start
Session stop
Connection open
Connection close
These events are both stored in InfluxDB and re-published as MQTT messages.
Usually it’s enough to track how many users are currently using the Qlik Sense system.
Exactly what users are usually of less interest.
At times you may want more detailed insights though. Then these events are incredibly useful.
For example:
Sometimes network issues cause some users’ browsers to start many new sessions instead of re-using existing sessions.
This can result in the proxy service overloading and making access to Sense slow for all users.
Butler SOS makes it easy to detect this. Just create a Grafana chart that shows number of session start events over time, attach an alert that goes off if number of new sessions per minute is too high.
Let’s say a specific user has troubles using Sense apps as intended, or a user is suspected of causing excessive RAM/CPU usage.
Subscribe to the MQTT user activity messages coming from Butler SOS, filtering out just the user(s) of interest.
Get a notification the very moment the user connects to Sense after which you can follow in real time what happens with the system. Does CPU go up? Free RAM goes down? Which apps are loaded?
You can also use the MQTT message to create your personal disco light, controlled by your Sense users connecting and dropping off the Sense server…
Green = User opening a connection to Sense
Red = User closing connection to Sense
Features are added, bugs fixed. How are Butler SOS versions set?
In the spirit of not copying information to several places, the version history is kept as annotations of each release on the GitHub release page.
Version numbers include up to 3 levels, for example version 4.6.2 (which is a fictitious version):
4 is the major version. It is increased when Butler has added major new features, or in other ways changed in major ways.
If following this principle, breaking changes should always result in a bumped major version.
6 is the minor version. This indicates a smaller update, when one or a few minor features have been added.
2 is the patch level. When individual bugs are fixed, these are released with an increased patch level.
Note 1: Major and minor updates usually include bug fixes too.
Note 2: If a version of 5.2 is mentioned, this implicitly means 5.2.0.
1.5 - Contribution guidelines
How to contribute to Butler SOS.
Butler SOS is an open source project, using the MIT license.
This means that all source code, documentation etc is available as-is, at no cost.
It however also means that anyone interested can - and is encouraged to - contribute to the project!
Butler SOS is developed in Node.js, with support from various NPM modules.
We use Hugo to format and generate this documentation site, the Docsy theme for styling and site structure.
Hugo is an open-source static site generator that provides us with templates, content organization in a standard directory structure, and a website generation engine. You write the pages in Markdown (or HTML if you want), and Hugo wraps them up into a website.
All submissions, including submissions by project members, require review. We use GitHub pull requests for this purpose. Consult GitHub Help for more information on using pull requests.
Creating an issue
If you’ve found a problem - or have a feature suggestion - with Butler SOS itself or the documentation, but you’re not sure how to fix it yourself, please create an issue in the Butler SOS repo. You can also create an issue about a specific doc page by clicking the Create Issue button in the top right hand corner of the page.
Security/Disclosure
If you discover a serious bug with Butler that may pose a security problem, please disclose it confidentially to security@ptarmiganlabs.com first, so that it can be assessed and hopefully fixed prior to being exploited. Please do not raise GitHub issues for security-related doubts or problems.
Development concepts
Some of the main tools/processes used during development of Butler SOS are:
Visual Studio Code (=VSC)
Any IDE supporting Node.js can be used, but VSC works really well. Open Source and a huge ecosystem of extensions.
GitHub
Used to store source code, track issues, change requests etc.
GitHub Actions used to build Docker images.
Release Please
Release Please is used to create release notes.
It also enforces consistent versioning when new (sometimes breaking) features are added, bugs fixed etc.
This means that as of Butler SOS 6.0 you can have more trust in the semantic versioning of Butler SOS releases.
ESLint + Prettier
Used to enforce a uniform source code format that also follow best practices defined in ESLint.
ESLint shows code issues within Visual Studio Code, but standalone reports can also be created:
➜ npx eslint . --format table

/Users/goran/code/butler-sos/src/butler-sos.js

║ Line     │ Column   │ Type     │ Message                                                │ Rule ID              ║
╟──────────┼──────────┼──────────┼────────────────────────────────────────────────────────┼──────────────────────╢
║ 31       │ 18       │ error    │ Unexpected require().                                  │ global-require       ║

/Users/goran/code/butler-sos/src/lib/appnamesextract.js

║ Line     │ Column   │ Type     │ Message                                                │ Rule ID              ║
╟──────────┼──────────┼──────────┼────────────────────────────────────────────────────────┼──────────────────────╢
║ 29       │ 37       │ error    │ A constructor name should not start with a             │ new-cap              ║
║          │          │          │ lowercase letter.                                      │                      ║

/Users/goran/code/butler-sos/src/lib/heartbeat.js

║ Line     │ Column   │ Type     │ Message                                                │ Rule ID              ║
╟──────────┼──────────┼──────────┼────────────────────────────────────────────────────────┼──────────────────────╢
║ 3        │ 1        │ error    │ Unexpected var, use let or const instead.              │ no-var               ║
║ 6        │ 1        │ error    │ Unexpected var, use let or const instead.              │ no-var               ║
║ 6        │ 21       │ warning  │ Unexpected unnamed function.                           │ func-names           ║
║ 9        │ 15       │ error    │ Unexpected function expression.                        │ prefer-arrow-        ║
║          │          │          │                                                        │ callback             ║
║ 9        │ 15       │ warning  │ Unexpected unnamed function.                           │ func-names           ║
║ 9        │ 25       │ error    │ 'response' is defined but never used.                  │ no-unused-vars       ║
║ 13       │ 16       │ error    │ Unexpected function expression.                        │ prefer-arrow-        ║
║          │          │          │                                                        │ callback             ║
║ 13       │ 16       │ warning  │ Unexpected unnamed function.                           │ func-names           ║
║ 27       │ 9        │ error    │ All 'var' declarations must be at the top of the       │ vars-on-top          ║
║          │          │          │ function scope.                                        │                      ║
║ 27       │ 9        │ error    │ Unexpected var, use let or const instead.              │ no-var               ║
║ 28       │ 9        │ error    │ All 'var' declarations must be at the top of the       │ vars-on-top          ║
║          │          │          │ function scope.                                        │                      ║
║ 28       │ 9        │ error    │ Unexpected var, use let or const instead.              │ no-var               ║
║ 28       │ 13       │ error    │ 't' is assigned a value but never used.                │ no-unused-vars       ║
║ 28       │ 35       │ error    │ Unexpected function expression.                        │ prefer-arrow-        ║
║          │          │          │                                                        │ callback             ║
║ 28       │ 35       │ warning  │ Unexpected unnamed function.                           │ func-names           ║

╔════════════════════════════════════════════════════════════════════════════════════════════════════════════════╗
║ 13 Errors                                                                                                      ║
╟────────────────────────────────────────────────────────────────────────────────────────────────────────────────╢
║ 4 Warnings                                                                                                     ║
╚════════════════════════════════════════════════════════════════════════════════════════════════════════════════╝

➜
Sharing telemetry data from Butler SOS is optional.
You can use all Butler SOS features without sharing telemetry data.
That said, if you find Butler SOS useful you are strongly encouraged to leave the telemetry feature turned on.
Having access to this data greatly helps the Butler SOS developers when they design new features, fix bugs etc.
The Butler SOS developers care about you - sharing telemetry data is your way of showing you care about them.
Telemetry is the in situ collection of measurements or other data at remote points and their automatic transmission to receiving equipment (telecommunication) for monitoring.
In the context of software tools (including Butler) telemetry is often used to describe the process of sending information about the tool itself to some monitoring system.
Why telemetry in Butler SOS?
This is a good question.
For several years there was no telemetry at all in Butler SOS.
Development of new features were driven mainly by what features were needed at the time.
Or the fact that Qlik released some new feature in Sense and Butler SOS was a way to test that new feature from the perspective of the Sense APIs.
That’s all good but today Butler SOS is a rather significant tool with features spanning monitoring, alerting and more.
This multitude of features is also one of the core reasons for adding telemetry to Butler SOS:
Which Butler SOS features are actually used out there?
Which operating systems, Node.js versions and hardware platforms is Butler SOS running on?
Without this information the Butler SOS developers will keep working in the dark, not really knowing where to focus their efforts.
On the other hand - with access to telemetry data a lot of possibilities open up for the Butler SOS developers:
If telemetry shows that no one uses a particular feature, maybe that feature should be scheduled for deprecation?
The opposite of the previous: If lots of users use a specific Butler SOS feature, then that feature is a candidate for future focus and development.
Telemetry will show if lots of users run Butler SOS on old Node.js versions. Knowing this its possible to set a migration schedule for what Node.js versions are supported - avoiding hard errors when some old Node.js version is no longer supported by Butler SOS.
Same thing for understanding what operating systems Butler SOS runs (and should be supported) on.
Information about what features are enabled and which are disabled. Why: This tells the Butler SOS developers which features are used and which aren’t.
This is critical information when it comes to planning where to focus future development efforts.
Information about Butler SOS’s execution environment (operating system, hardware architecture, Node.js version etc). Why: Ideally the Butler SOS developers want to use as modern versions of Node.js as possible. But if telemetry shows that lots os Butler SOS instances use old Node.js versions or run on some (yet) untested/unverified Linux version - then maybe those older Node.js/Linux versions must be supported for yet some time.
What's not shared
The telemetry data will never include:
Data that can identify your Sense environment or the server on which Butler SOS runs. This includes IP/MAC addresses or other network information, server names, Docker container metadata or similar.
Any actual data handled by Butler SOS (user IDs, app names, number of users in your system etc).
Qlik Sense or other certificates in any shape or form.
Where is telemetry data sent
Butler SOS uses PostHog to collect telemetry data.
PostHog is an open source telemetry platform that is used by many open source projects.
The data is stored in the EU.
Deleting telemetry data
Even though no-one (not even Ptarmigan Labs who runs the telemetry database!) has any way of ever connecting the data sent by your Butler SOS instance to you (it’s all anonymized, remember?), there can be cases where telemetry data must be deleted.
It’s purpose is to uniquely identify the Butler SOS instance - nothing else.
If Butler SOS is stopped and started again the same ID will be used.
If reinstalled on a new server, or if the server’s network configuration changes, a new ID will be created.
Some sensitive information is used to create the ID, but as the ID is anonymized before sent as part of the telemetry data, no sensitive information leaves your servers.
The ID field is created as follows:
Combine the following information to a single string
MAC address of default network interface
IPv4 address of default network interface
IP or FQDN of Sense server where repository service is running
System unique ID as reported by the OS. Not all OSs support this though, which is why field 1-3 above are also needed to get a unique ID.
Run the created string through a one-way hashing/message digest function.
Butler SOS uses Node.js’ own Crypto library to create a SHA-256 hash, using the default network interface’s MAC address as salt.
Security is increased due to the fact that the salt never leaves the server where Butler is running.
The bottom line is that it’s impossible to reverse the process and get the IP, host name etc used in step 1 above.
Then again - this is cryptography, and there are no guarantees.
But if you trust the certificates securing Sense itself, then the ID anonymization in Butler SOS should be ok too. Both are built on the same concepts of one-way cryptographic functions.
The result is a string that uniquely identifies the Butler SOS instance at hand, without giving away any sensitive data about the system where Butler is running.
See above for an example of what the id field looks like.
The id field is always shown during Butler startup.
Telemetry FAQ
What data is included in the telemetry messages?
See above.
The telemetry includes information about which Butler SOS features are enabled vs disabled.
A unique, anonymized ID is included too, it’s unique to each Butler SOS instance and is used soley to distinguish between different Butler SOS instances.
Finally some information about Butler SOS’s execution environment is included. Things like operating system, Node.js version used etc.
Can my Sense environment be identified via telemetry data?
Short answer: No.
Longer answer: No information about your Sense environment is sent as part of telemetry. No IP addresses or server names, no IDs of Sense apps/tasks/etc, no information about what actual data passed through Butler SOS, or any other data that can be linked to your Sense environment is included in the telemetry data.
2 - Getting started
Taking your first steps.
Butler SOS is written in Node.js, which is a cross-platform programming environment.
This means most kinds of computers and servers can be used to run Butler SOS, including Windows, Linux and Mac OS.
Setting up Butler SOS is pretty straightforward, but you do need a working understanding of Qlik Sense admin tasks.
For example, you need to export certificates from the QMC, as well as installing Butler SOS itself.
2.1 - Overview
SenseOps monitoring - what’s that?
This page provides the general steps to get started with Butler SOS. It also explains how Butler SOS relates to other tools and services that collectively make up the SenseOps concept.
Qlik Sense + DevOps = SenseOps
Butler SenseOps Stats (“Butler SOS”) is a monitoring tool for Qlik Sense, built with DevOps workflows in mind.
It publishes operational, close to real-time Qlik Sense Enterprise metrics to InfluxDB, Prometheus, New Relic and MQTT. From there it can be visualized using tools like Grafana, New Relic or acted on by downstream systems that listen to the MQTT topics used by Butler SOS.
Let’s say you are somehow involved in (or maybe even responsible for) your company’s client-managed Qlik Sense Enterprise on Windows (QSEoW) environment.
Let’s also assume you have more than 5-10 users in your Sense environment. Maybe you even have business critical data in your Sense apps.
Given the above, the answer is almost certainly “yes” : You can simplify your workday and provide a better analytics experience to your end users by using a tool like Butler SOS.
Looking at companies using Butler SOS, they range from small companies with a single Sense server to large enterprises with dozens of Sense servers and (many!) thousands of users.
Why a separate tool for this?
Good question.
While Qlik Sense ships with a great Operations Monitor application, it is not useful or intended for real-time operational monitoring.
The Ops Monitor app is great for retrospective analysis of what happened in a Qlik Sense environment, but for a real-time understanding of what’s going on in a Sense environment something else is needed - enter Butler SOS.
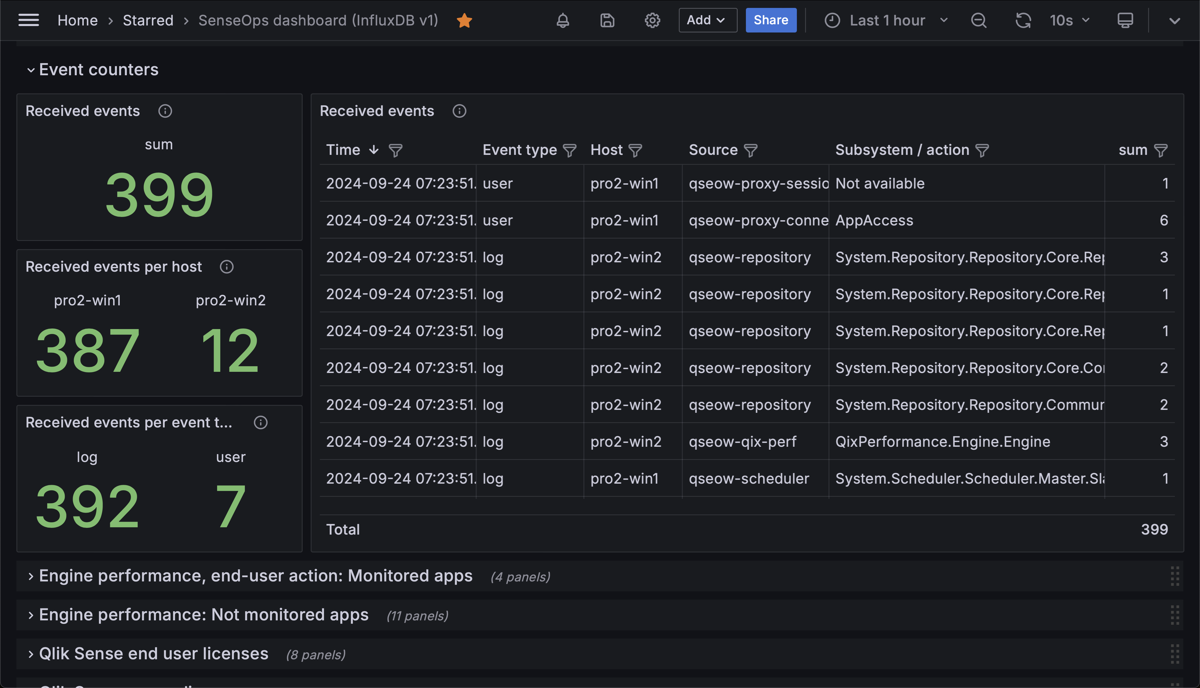
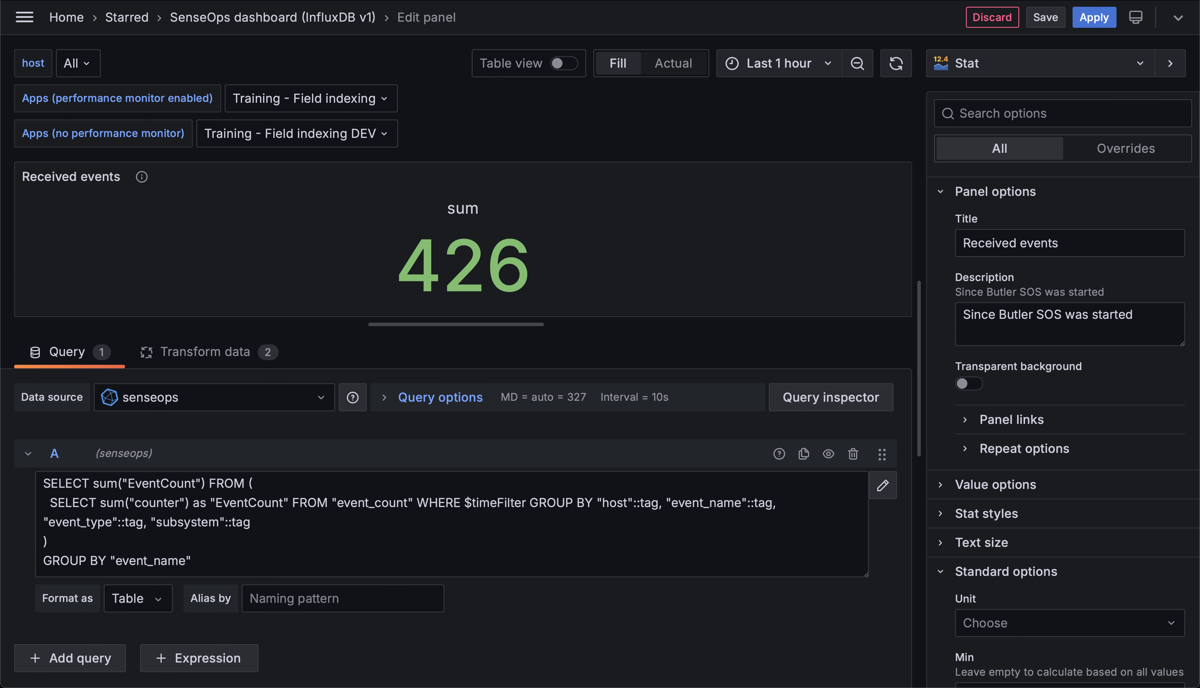
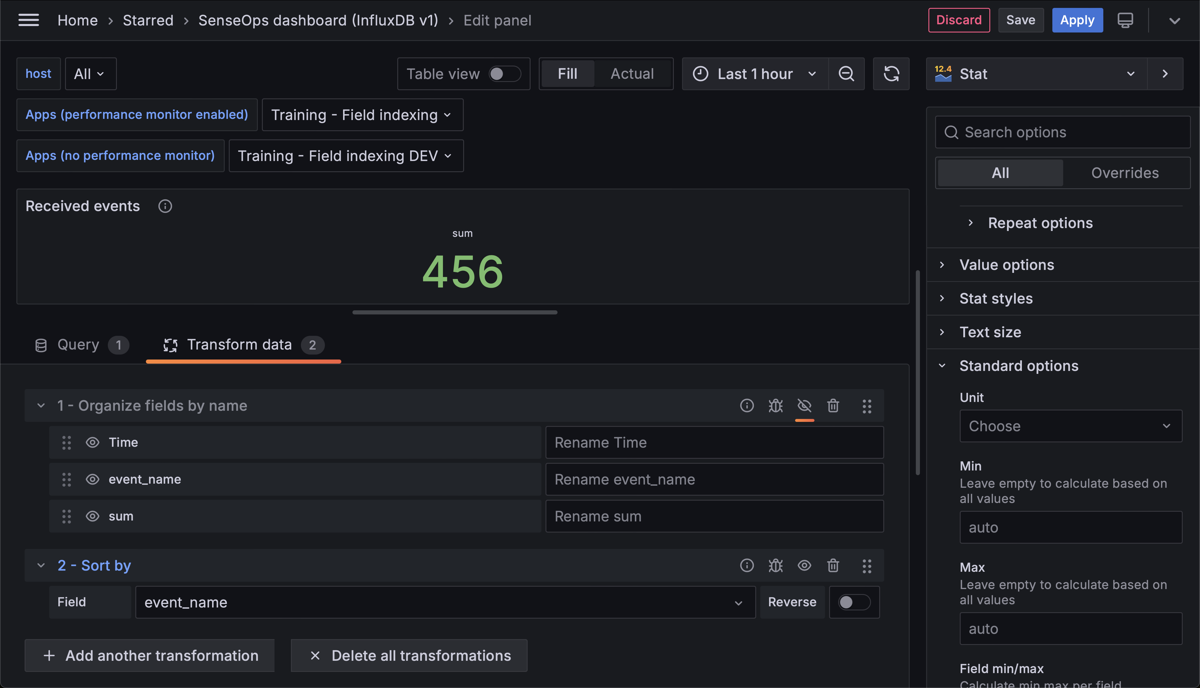
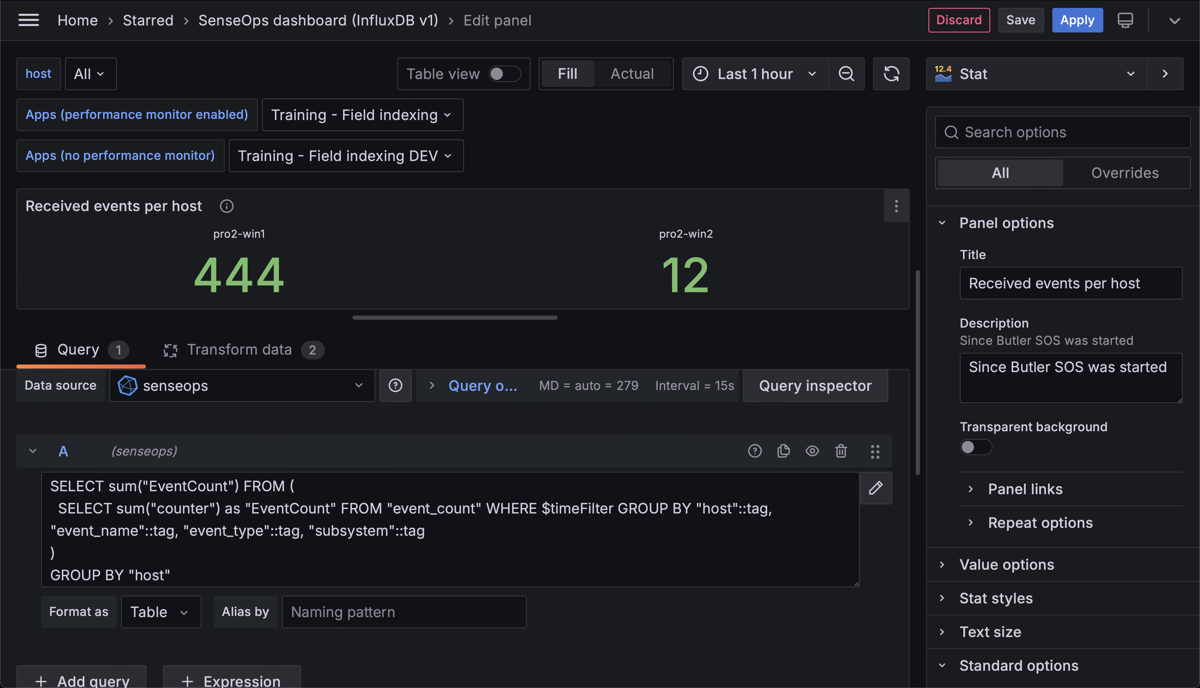
The most common way of using Butler SOS is for creating real-time dashboards based on the data in the InfluxDB or Prometheus database, showing operational metrics for a Qlik Sense Enterprise environment.
Sample screen shots of some basic Grafana dashboards created using data extracted by Butler SOS:
As mentioned above, Butler SOS can also send data to MQTT for use in any MQTT enabled tool or system.
Known limitations & improvement ideas
Things can always be improved, of course. Here are some ideas on things for future versions:
The MQTT messages are kind of basic, at least when it comes to data from the Sense logs and for detailed user sessions. In both those cases a single text string is sent to MQTT. That’s fine, but assumes the downstream consumer of the MQTT message can parse the string and extract the information of interest.
A better approach would be to send more detailed MQTT messages. Those would be easier to consume and act upon for downstream systems, but it would on the other mean lots more MQTT messages being sent.
Send data as Kafka messages. Same basic idea as for MQTT messages, but having the Sense operational data in Kafka would make it easier to process/use it in (big) data pipelines.
If you have ideas or suggestions on new features, please feel free to add them in the Butler SOS Github project.
Where should I go next?
Ready to move on?
Great! Here are some good starting points
Examples: Check out some Grafana dashboards to get inspiration what can be done!
Installation & setup: Learn how to install Butler SOS, then set it up according to your needs.
If you discover any important bug with Butler SOS that may pose a security problem, please disclose it confidentially to security@ptarmiganlabs.com first, so that it can be assessed and hopefully fixed prior to being exploited. Please do not raise GitHub issues for security-related doubts or problems.
Who’s behind Butler SOS?
Butler SOS is an open source project sponsored by Ptarmigan Labs, an IT consulting company in Stockholm, Sweden.
Project lead is Göran Sander from same company.
Please refer to the Contribution guidelines page for details on how to contribute, suggest features etc to the tool.
2.2 - Install
The steps needed for installing and configuring vary slightly depending on what platform you use. The details are found here.
Warning
Butler SOS can store data in InfluxDB 1.x or 2.x databases.
It contains description of issues people have faced when installing Butler SOS, as well as solutions to them.
If in doubt on how to install Butler SOS, please consider Docker (or Kubernetes if available) as the first alternative.
Why? Several reasons:
Very quick to get started. Usually it takes just a few minutes to set up a Butler SOS instance in Docker.
Using Docker is a great way to test new tools without having to install the tool on one of your actual servers. If you decide the tool in question is not for you - just delete the Docker container. Your servers remain 100% the same as before the test.
The previous point is true not only for Butler SOS, but also its companion tools InfluxDB, Prometheus, Grafana and MQTT (via for example the Mosquitto MQTT broker). You can run all of these tools in their own Docker containers, and not install a single piece of new, native applications during your evaluation of Butler SOS.
Make use of your existing Docker runtime environments, or use those offered by Amazon, Google, Microsoft etc.
Benefit from the comprehensive tools ecosystem (monitoring, deployment etc) that is available for Docker.
Updating Butler SOS to the latest version (assuming no config file changes are needed for that particular upgrade) is as easy as stopping the container, doing a “docker pull ptarmiganlabs/butler-sos:latest”, and finally starting the container again.
If Docker is not an option, the pre-built, stand-alone binaries for Windows, Linux and macOS are good options.
They offer a download-configure-execute approach to running Butler SOS.
This will be the easiest way to use Butler SOS if you are not familiar with Docker.
But even with the above recommendations, Butler SOS can be deployed in lots of different configurations.
It is therefore difficult to give precise instructions that will work everywhere, for everyone. Especially the fact that Butler SOS uses certificates to authenticate with Sense is a complicating factor. Certificates are (when correctly used) great for securing systems, but they can also cause headaches.
First we must recognize that Sense uses self signed certificates. This is fine, and as long as you work on a server where Sense Enterprise is installed, that server will have the Sense-provided certificates and Certificate Authority (CA) installed.
This means that the easiest option for getting Butler SOS up and running is usually to install it on one of your Sense servers.
That said, it is probably better system design to run Butler SOS (and maybe other members of the Butler family) on their own server, maybe using some flavour of Linux (lower cost compared to Windows). Windows servers work equally well though.
In this case you might want to consider exporting the Sense CA certificate from one of your Sense servers, and then install it on the Linux server.
This should technically not be needed for Butler SOS to work correctly - as long as you specify the correct root.pem file in the Butler SOS config file, you should be ok.
If you specify an incorrect root CA certificate file in the clientCertCA config option, you will get an error like this:
2018-05-23T20:36:44.393Z - error: Error: Error: unable to verify the first certificate
at TLSSocket.<anonymous> (_tls_wrap.js:1105:38) at emitNone (events.js:106:13) at TLSSocket.emit (events.js:208:7) at TLSSocket._finishInit (_tls_wrap.js:639:8) at TLSWrap.ssl.onhandshakedone (_tls_wrap.js:469:38)2018-05-23T20:36:49.164Z - verbose: Event started: Query log db
2018-05-23T20:36:49.180Z - verbose: Event started: Statistics collection
A general note on host names is also relevant.
If you specify a server name of “myserver.company.com” while exporting certificates from the QMC, you should use that same server name in the Butler SOS config file. Failing to do so will (most likely) result in an error:
2018-05-23T19:51:03.087Z - error: Error: Error: Hostname/IP doesn't match certificate's altnames: "Host: serveralias.company.net. is not in the cert's altnames: DNS:myserver.company.com" at Object.checkServerIdentity (tls.js:223:17) at TLSSocket.<anonymous> (_tls_wrap.js:1111:29) at emitNone (events.js:106:13) at TLSSocket.emit (events.js:208:7) at TLSSocket._finishInit (_tls_wrap.js:639:8) at TLSWrap.ssl.onhandshakedone (_tls_wrap.js:469:38)2018-05-23T19:51:07.701Z - verbose: Event started: Statistics collection
2.2.1 - Choosing a platform - what are the options?
You can run Butler SOS on several platforms, each with their own pros and cons. This section should help you decide which platform is right for you.
As Butler SOS is written in Node.js, the tool in theory runs on all platforms where Node.js is available.
It is also available as a Docker image.
Docker is by far the preferred way of running Butler SOS, mainly because it gives you a very nice, production grade (stable, scalable, monitorable etc) execution environment. If you are really serious about scalability and stability you could even run Butler SOS in Kubernetes.
Other platforms can be used too, of course - let’s look at the pros and cons of some of the more commonly used platforms:
Platform
Pros
Cons
Docker
- Easy to set up Butler SOS in Docker - Easy to test new versions of Butler SOS - Use existing Docker infrastructure - Monitoring, restarts etc built into Docker - Runs on low cost hardware and OSs
- Docker environment needed (if not already available). Setting up and running Docker is not hard, but does require somewhat other skills than those needed to run a Sense environment
- Butler SOS can run on same server as Qlik Sense, saving hardware/server costs - Pre-built, standalone binaries available
- Running Butler SOS natively on the Sense server is a potential risk (usually a good idea to isolate systems/services to their own servers/environments whenever possible) - More difficult (compared to Docker) to achieve a production grade setup (auto restarts etc)
Linux
- No cost for operating system (at least not for most Linux versions) - Runs on low cost hardware - Pre-built, standalone binaries available
- More difficult (compared to Docker) to achieve a production grade setup (auto restarts etc)
Mac OS
- For development, if you want to extend or modify Butler SOS - Signed, pre-built, standalone binaries available
- Not a server grade operating system, i.e. not for production use
Windows (desktop)
- For development, if you want to extend or modify Butler SOS
- Not a server grade operating system, i.e. not for production use
2.2.2 - Native app
How to install Butler SOS as a Node.js application.
Selecting an OS
While Qlik Sense Enterprise is a Windows only system, Butler SOS should be able to run on any OS where Node.js is available.
Butler SOS has been successfully used as a native Node.js app - during development and production - on Windows, Linux (Debian and Ubuntu tested) and mac OS.
Prerequisites
What
Comment
Qlik Sense Enterprise on Windows
Mandatory. Butler SOS is developed with Qlik Sense Enterprise on Windows (QSEoW) in mind. Butler SOS is simply not intended to work with Sense Desktop or Sense cloud.
Node.js
Mandatory. Butler SOS is written in Node - which is thus a firm requirement.
MQTT broker
Optional. MQTT is used for outbound pub-sub messaging. Butler SOS assumes a working MQTT broker is available, the IP of which is defined in the Butler SOS config file. Mosquitto is a great open source broker. It requires very little hardware to run, even the smallest (usually free) Amazon/Google/Microsoft/… instance is enough, if you want a dedicated MQTT server. If you don’t care about the pubsub features of Butler SOS, you don’t need a MQTT broker. In this case you can disable the MQTT features in the config YAML file.
Use at least one of InfluxDB and Prometheus. An open source database for real-time information, used to store metrics around Butler’s own memory usage over time (if this feature is enabled). At this point more metrics and events are sent to InfluxDB, compared to Prometheus.
Use at least one of InfluxDB and Prometheus. The de-facto standard open source tool for metrics gathering in large-scale systems, including Kubernetes. A bit more complex to set up and configure compared to InfluxDB, but also more focused on providing observability features.
Optional. The de-facto open source standard for showing real-time metrics. In order to visualise Sense real-time metrics in Grafana you must enable at least one of InfluxDB or Prometheus.
2.2.2.1 - Windows
Running Butler SOS in Windows.
Installation
There are two options: Run Butler SOS as a standalone binary or as a Node.js app.
The first is by far easier to set up and maintain and thus recommended.
Using the pre-built, standalone app
The pre-build binaries are available from the releases page.
Download the Windows binary
“Unblock” the downloaded zip file
Right-click the zip file
Select “properties”
Mark the “Unblock” check box in the lower right part of the properties window
Click the “Apply” button, then “Ok” to close the properties window
Unzip the zip file
Move the extracted butler-sos.exe file to desired location, for example d:\tools\butler-sos
Use nssm or similar tool to install Butler SOS as a Windows service
Unblocking the Butler SOS zip file on Windows Server
Using Node.js
In this scenario you will use the Butler SOS source code together with the standard Node.js runtime libraries.
The result is the same as with the stand-alone binaries, you just have to do more of the work yourself.
This is usually not preferred, but if you want to add new features to (or modify existing ones) Butler SOS, this option is for you
2. Select a directory from which Butler SOS will be run
This can be pretty much anywhere, in this example d:\tools\butler-sos will be used.
3. Get Butler SOS
Get the desired Butler SOS version and extract it into the directory above.
Get the latest available version unless you have a really good reason to use an older version.
New features are added, bugs fixed and security updates are applied in each version - it’s simply a good idea to use the latest version.
Do not just clone the Butler SOS repository as that will give you the latest development version, which may not yet be fully tested and packaged.
The exception is of course if you want to contribute to Butler SOS development - then forking and cloning the repository is the right thing to do.
4. Install Node.js dependencies
From d:\tools\butler-sos\src, run npm i to install the various Node.js modules used by Butler SOS. Depending on your server configuration you may get some warnings about (for example) Python not being installed, these can usually be ignored.
Configuration
The configuration file is used the same way as when Butler SOS runs on Docker, with one exception:
The path to the certificates used to authenticate with Sense must be specified in the config file. With Docker the certificate path is always the same, but with Windows you need to specify where the certificate files are located.
For example, if the certificate files exported from Sense are stored in d:\secrets\sensecert, the config file would look like this when used on Windows:
...# Certificates to use when querying Sense for healthcheck data. Get these from the Certificate Export in QMC.cert:clientCert:d:\secrets\sensecert\client.pemclientCertKey:d:\secrets\sensecert\client_key.pemclientCertCA:d:\secrets\sensecert\root.pem
Stayin’ alive
A tool like Butler SOS should of course start automatically when the server it runs on is restarted. This can be achieved in at least a couple of ways:
By far the best option is to turn Butler SOS into a Windows service. That way it will be started on server boot, restarted if it fails etc. There are various tools for doing this, with NSSM being a very good one. Butler SOS has been installed in lots of Sense environments this way.
You can also use a Node process monitor such as PM2 to monitor the Butler SOS process, and restart it if it for some reason crashes. PM2 is not entirely easy to use on Windows though.
2.2.2.2 - Linux and Mac OS
Running Butler SOS in Linux and Mac OS. Installation and configuration.
Installation
There are two options: Run Butler SOS as a standalone binary or as a Node.js app.
The first is by far easier to set up and maintain and thus recommended.
Using the pre-built, standalone app
The pre-build binaries are available from the releases page.
Download the Linux/macOS binary
Move the extracted butler-sos file to desired location.
Use the process monitor of choice (see below) to make sure Butler SOS is always running
Using Node.js
This scenario is identical to the Windows scenario, please refer to that page for details. Keep in mind that the format of file systems paths differ between Windows and Linux/Mac OS.
A Node process monitor can be used on Linux or Mac OS too.
Tools like PM2 in fact usually work better on Linux/Mac OS than on Windows.
You can probably also use Linux’ standard service layer to start Butler SOS, that has not been tested though.
2.2.3 - Docker
Running Butler SOS in Docker. Installation and configuration.
Tip
Butler SOS Docker images are automatically built for several architectures:
amd64: This is by far the most common platform - your typical Intel based server use amd64.
arm64: Arm servers are now available from most cloud providers and offer very competitive price/performance. Apple’s new M1 CPUs also use arm64, as does the newer Raspberry Pi models.
arm/v7: An older Arm architecture found in previous-gen Raspberry Pis, for example.
Docker is great in that it runs on many different platforms.
This means that as long as the Docker runtime environment is installed, you can run Butler SOS on your Mac laptop, on a Linux server or on a Windows server.
Or in a Kubernetes cluster to get enterprise grade process monitoring of Butler SOS.
Installation
Docker runtime
Installing Docker is beyond the scope of this document, but there are plenty of online tutorials covering this.
Butler SOS installation and configuration
When using Docker there is no installation in the traditional sense.
Instead we (in this case) use a docker-compose file to define how Butler SOS should be executed within a Docker container. There are also other ways to start Docker containers, but docker-compose is usually a good and robust starting point.
Configuration of Butler specific settings is then done using Butler’s own JSON/YAML config file.
Install & configure - walkthrough
Create a directory for Butler SOS. Config files and logs will be stored here.
This example uses macOS but the commands will be very similar on Linux.
Docker on Windows is another story - it’s there and works great, but not always identical to Linux/macOS.
Copy docker-compose.yml from the GitHub repository to the Butler SOS directory that was created above. The directory where the docker-compose file is stored is the ‘root’ directory of Butler SOS - everything else is relative to this directory.
Adapt the docker-compose file as needed (usually no changes are needed if you want to run the latest version of Butler SOS).
Copy the YAML config file from the GitHub repository into the ./config directory, rename it to production.yaml (or something else, as long as it matches the NODE_ENV environment variable set in the docker-compose.yml file) and edit it as needed. Note that for the Docker setup the path to certificates (as specified in the YAML config file) should be /nodeapp/config/certificate/ (this is the Docker container’s internal path to the certificate directory).
Edit the config file above as needed, with respect to your local Sense environment, folder paths etc. The provided template file has reasonable default settings where possible, but there are also a number of paths, passwords etc that must be configured.
Export certificates from the QMC in Qlik Sense Enterprise, place them in the ./config/certificate directory (i.e. in a subdirectory to the directory where the docker-compose file is stored). The certificates can in theory be placed anywhere, as long as they are made available to the Docker container via a volume mount in the docker-compose.yaml file (e.g. - "./config:/nodeapp/config").
Let’s do this one step at a time.
Here we will bring up a single container with Butler SOS in it.
The Butler SOS config file is called production.yaml.
First, what files are there?
➜ butler-sos-docker ls -la
total 8drwxr-xr-x 5 goran staff 160 Aug 21 19:08 .
drwxr-xr-x 3 goran staff 96 Aug 21 18:49 ..
drwxr-xr-x 4 goran staff 128 Aug 21 19:08 config
-rw-r--r-- 1 goran staff 1505 Aug 21 19:01 docker-compose.yml
drwxr-xr-x 2 goran staff 64 Aug 21 18:49 log
➜ butler-sos-docker
➜ butler-sos-docker ls -la config
total 48drwxr-xr-x 4 goran staff 128 Aug 21 19:08 .
drwxr-xr-x 5 goran staff 160 Aug 21 19:08 ..
drwxr-xr-x 5 goran staff 160 Aug 21 19:08 certificate
-rw-r--r-- 1 goran staff 21903 Aug 21 19:08 production.yaml
➜ butler-sos-docker
➜ butler-sos-docker ls -la config/certificate
total 24drwxr-xr-x 5 goran staff 160 Aug 21 19:08 .
drwxr-xr-x 4 goran staff 128 Aug 21 19:08 ..
-rw-r--r--@ 1 goran staff 1170 Aug 21 19:06 client.pem
-rw-r--r--@ 1 goran staff 1704 Aug 21 19:06 client_key.pem
-rw-r--r--@ 1 goran staff 1224 Aug 21 19:06 root.pem
➜ butler-sos-docker
What does the docker-compose.yml file look like?
➜ butler-sos-docker cat docker-compose.yml
# docker-compose.ymlversion: "3.3"services:
butler-sos:
image: ptarmiganlabs/butler-sos:latest
container_name: butler-sos
restart: always
volumes:
# Make config file and log files accessible outside of container - "./config:/nodeapp/config" - "./log:/nodeapp/log" environment:
- "NODE_ENV=production"# Means that Butler SOS will read config data from production.yaml logging:
driver: "json-file" options:
max-file: "5" max-size: "5m" networks:
- senseops
networks:
senseops:
driver: bridge
➜ butler-sos-docker
Ok, all good. Let’s start the container using docker-compose (the exact output will depend on what version of Butler SOS you are using and what features you have enabled in its YAML config file).
➜ butler-sos-docker docker-compose up
Creating network "butler-sos-docker_senseops" with driver "bridge"Creating butler-sos ... doneAttaching to butler-sos
butler-sos | 2022-08-23T03:45:28.754Z info: CONFIG: Influxdb enabled: truebutler-sos | 2022-08-23T03:45:28.757Z info: CONFIG: Influxdb host IP: 192.168.100.20
butler-sos | 2022-08-23T03:45:28.757Z info: CONFIG: Influxdb host port: 8086butler-sos | 2022-08-23T03:45:28.758Z info: CONFIG: Influxdb db name: senseops
butler-sos | 2022-08-23T03:45:29.003Z info: CONFIG: Found InfluxDB database: senseops
butler-sos | 2022-08-23T03:45:29.219Z info: --------------------------------------
butler-sos | 2022-08-23T03:45:29.220Z info: Starting Butler SOS
butler-sos | 2022-08-23T03:45:29.220Z info: Log level: verbose
butler-sos | 2022-08-23T03:45:29.221Z info: App version: 9.2.0
butler-sos | 2022-08-23T03:45:29.221Z info: Instance ID : 87b978019ae........
butler-sos | 2022-08-23T03:45:29.222Z info:
butler-sos | 2022-08-23T03:45:29.223Z info: Node version : v18.7.0
butler-sos | 2022-08-23T03:45:29.223Z info: Architecture : x64
butler-sos | 2022-08-23T03:45:29.224Z info: Platform : linux
butler-sos | 2022-08-23T03:45:29.224Z info: Release : 11butler-sos | 2022-08-23T03:45:29.224Z info: Distro : Debian GNU/Linux
butler-sos | 2022-08-23T03:45:29.224Z info: Codename : bullseye
butler-sos | 2022-08-23T03:45:29.224Z info: Virtual : falsebutler-sos | 2022-08-23T03:45:29.225Z info: Processors : 4butler-sos | 2022-08-23T03:45:29.225Z info: Physical cores : 4butler-sos | 2022-08-23T03:45:29.225Z info: Cores : 4butler-sos | 2022-08-23T03:45:29.226Z info: Docker arch. : undefined
butler-sos | 2022-08-23T03:45:29.226Z info: Total memory : 6233055232butler-sos | 2022-08-23T03:45:29.226Z info: Standalone app : falsebutler-sos | 2022-08-23T03:45:29.226Z info: --------------------------------------
butler-sos | 2022-08-23T03:45:29.226Z info: Client cert: /nodeapp/config/certificate/client.pem
butler-sos | 2022-08-23T03:45:29.227Z info: Client cert key: /nodeapp/config/certificate/client_key.pem
butler-sos | 2022-08-23T03:45:29.227Z info: CA cert: /nodeapp/config/certificate/root.pem
butler-sos | 2022-08-23T03:45:29.250Z verbose: MAIN: Anonymous telemetry reporting has been set up.
butler-sos | 2022-08-23T03:45:29.252Z verbose: MAIN: Starting Docker healthcheck server...
butler-sos | 2022-08-23T03:45:29.257Z info: USER EVENT: UDP server listening on 0.0.0.0:9997
butler-sos | 2022-08-23T03:45:29.257Z info: LOG EVENT: UDP server listening on 0.0.0.0:9996
butler-sos | 2022-08-23T03:45:29.290Z info: MAIN: Started Docker healthcheck server on port 12398.
butler-sos | 2022-08-23T03:45:29.290Z info: MAIN: Starting Prometheus Butler SOS endpoint on 0.0.0.0:9842.
butler-sos | 2022-08-23T03:45:29.291Z verbose: PROM: Setting up Prometheus client for server: sense1
butler-sos | 2022-08-23T03:45:29.292Z verbose: PROM: Setting up Prometheus client for server: sense2
butler-sos | 2022-08-23T03:45:29.310Z info: PROM: Prometheus Butler SOS metrics server now listening on port 9842butler-sos | 2022-08-23T03:45:29.311Z info: PROM: Prometheus Node.js metrics server now listening on port 0.0.0.0:9001
butler-sos | 2022-08-23T03:45:30.911Z verbose: --------------------------------
butler-sos | 2022-08-23T03:45:30.911Z verbose: Iteration # 1, Uptime: 0 months, 0 days, 0 hours, 0 minutes, 2.005 seconds, Heap used 33.26 MB of total heap 58.39 MB. External (off-heap): 3.57 MB. Memory allocated to process: 92.45 MB.butler-sos | 2022-08-23T03:45:31.051Z verbose: UPTIME NEW RELIC: Sent Butler SOS memory usage data to New Relic account 123456789("Ptarmigan Labs NR account")butler-sos | 2022-08-23T03:45:31.269Z verbose: MEMORY USAGE INFLUXDB: Sent Butler SOS memory usage data to InfluxDB
...
Once everything everything looks good you can stop the containers (ctrl-C), then start them again in daemon mode (i.e. running unattended in the background):
➜ butler-sos-docker docker-compose up -d
Starting butler-sos ... done➜ butler-sos-docker
Setting the log level to info in the config file will reduce log output.
The Docker container implements Docker healthchecks, which means you can run docker ps to see whether the container is healthy or not (assuming Docker healthchecks are enabled in the config file, of course):
➜  butler-sos-docker docker ps
CONTAINER ID   IMAGE                             COMMAND                  CREATED              STATUS                    PORTS     NAMES
9d2253511a24   ptarmiganlabs/butler-sos:latest   "docker-entrypoint.s…"   About a minute ago   Up 17 seconds (healthy)             butler-sos
➜  butler-sos-docker
2.2.4 - InfluxDB & Grafana
How to use Butler SOS with InfluxDB and Grafana using Docker.
Warning
Butler SOS supports InfluxDB version 1.x and 2x.
InfluxDB v3.x is not yet supported.
If you already have InfluxDB and/or Grafana running you can skip this section.
Running in Docker using docker-compose
The easiest way to get started is to run these tools in Docker containers, controlled by docker-compose files.
Running them under Kubernetes will give you a whole other level of fault tolerance, scalability etc - but this also requires much more when it comes to Kubernetes skills. Use the setup that’s relevant to your use case.
You can use a single docker-compose file for Butler SOS, InfluxDB and Grafana - or separate docker-compose files for each tool.
The advantage of using a single docker-compose file is that the entire stack of tools will be launched in unison. You can create dependencies between the tools if needed etc - very convenient.
On the other hand, having separate docker-compose files makes it easier to restart (or upgrade or in other ways change) a single service without affecting other services.
Full stack docker-compose file
Let’s start Butler SOS, InfluxDB and Grafana from a single docker-compose_fullstack_influxdb.yml file:
➜ butler-sos-docker cat docker-compose_fullstack_influxdb.yml
# docker-compose_fullstack_influxdb.ymlversion: "3.3"services:
butler-sos:
image: ptarmiganlabs/butler-sos:latest
container_name: butler-sos
restart: always
volumes:
# Make config file and log files accessible outside of container - "./config:/nodeapp/config" - "./log:/nodeapp/log" environment:
- "NODE_ENV=production_influxdb"# Means that Butler SOS will read config data from production_influxdb.yaml logging:
driver: "json-file" options:
max-file: "5" max-size: "5m" networks:
- senseops
influxdb:
image: influxdb:1.8.10
container_name: influxdb
restart: always
volumes:
- ./influxdb/data:/var/lib/influxdb # Mount for influxdb data directory - ./influxdb/config/:/etc/influxdb/ # Mount for influxdb configuration ports:
# The API for InfluxDB is served on port 8086 - "8086:8086" - "8082:8082" environment:
# Disable usage reporting - "INFLUXDB_REPORTING_DISABLED=true" networks:
- senseops
grafana:
image: grafana/grafana:latest
container_name: grafana
restart: always
ports:
- "3000:3000" volumes:
- ./grafana/data:/var/lib/grafana
networks:
- senseops
networks:
senseops:
driver: bridge
➜ butler-sos-docker
Assuming you’ve already completed the setup of Butler SOS, the result of running the docker-compose_fullstack_influxdb.yml file above is something like this:
➜ butler-sos-docker docker-compose -f docker-compose_fullstack_influxdb.yml up
Creating network "butler-sos-docker_senseops" with driver "bridge"Creating influxdb ... doneCreating butler-sos ... doneCreating grafana ... doneAttaching to butler-sos, grafana, influxdb
...
...
grafana |logger=grafanaStorageLogger t=2022-08-21T18:13:42.76538465Z level=info msg="storage starting"grafana |logger=ngalert t=2022-08-21T18:13:42.780004463Z level=info msg="warming cache for startup"grafana |logger=http.server t=2022-08-21T18:13:42.796364325Z level=info msg="HTTP Server Listen"address=[::]:3000 protocol=http subUrl=socket=grafana |logger=ngalert.multiorg.alertmanager t=2022-08-21T18:13:42.807894344Z level=info msg="starting MultiOrg Alertmanager"butler-sos | 2022-08-21T18:13:42.908Z info: CONFIG: Influxdb enabled: truebutler-sos | 2022-08-21T18:13:42.911Z info: CONFIG: Influxdb host IP: influxdb
butler-sos | 2022-08-21T18:13:42.912Z info: CONFIG: Influxdb host port: 8086butler-sos | 2022-08-21T18:13:42.912Z info: CONFIG: Influxdb db name: senseops
influxdb |ts=2022-08-21T18:13:43.139047Z lvl=info msg="Executing query"log_id=0cSPbmJG000 service=query query="SHOW DATABASES"influxdb |[httpd] 172.24.0.2 - - [21/Aug/2022:18:13:43 +0000]"GET /query?p=&q=show+databases&u= HTTP/1.1"20084"-""-" fd854ac5-217c-11ed-8001-0242ac180003 1084influxdb |ts=2022-08-21T18:13:43.169398Z lvl=info msg="Executing query"log_id=0cSPbmJG000 service=query query="CREATE DATABASE senseops"influxdb |[httpd] 172.24.0.2 - - [21/Aug/2022:18:13:43 +0000]"POST /query?p=&q=create+database+%22senseops%22&u= HTTP/1.1 "20033"-""-" fd89e529-217c-11ed-8002-0242ac180003 2940butler-sos | 2022-08-21T18:13:43.177Z info: CONFIG: Created new InfluxDB database: senseops
influxdb |ts=2022-08-21T18:13:43.219945Z lvl=info msg="Executing query"log_id=0cSPbmJG000 service=query query="CREATE RETENTION POLICY \"10d\" ON senseops DURATION 10d REPLICATION 1 DEFAULT"influxdb |[httpd] 172.24.0.2 - - [21/Aug/2022:18:13:43 +0000]"POST /query?p=&q=create+retention+policy+%2210d%22+on+%22senseops%22+duration+10d+replication+1+default&u= HTTP/1.1 "20033"-""-" fd91ac84-217c-11ed-8003-0242ac180003 2299butler-sos | 2022-08-21T18:13:43.242Z info: CONFIG: Created new InfluxDB retention policy: 10d
butler-sos | 2022-08-21T18:13:43.391Z info: --------------------------------------
butler-sos | 2022-08-21T18:13:43.391Z info: Starting Butler SOS
butler-sos | 2022-08-21T18:13:43.392Z info: Log level: verbose
butler-sos | 2022-08-21T18:13:43.393Z info: App version: 9.2.0
butler-sos | 2022-08-21T18:13:43.394Z info: Instance ID : 964cbd0a36bc....
butler-sos | 2022-08-21T18:13:43.394Z info:
butler-sos | 2022-08-21T18:13:43.395Z info: Node version : v18.7.0
butler-sos | 2022-08-21T18:13:43.396Z info: Architecture : x64
butler-sos | 2022-08-21T18:13:43.396Z info: Platform : linux
butler-sos | 2022-08-21T18:13:43.396Z info: Release : 11butler-sos | 2022-08-21T18:13:43.397Z info: Distro : Debian GNU/Linux
butler-sos | 2022-08-21T18:13:43.397Z info: Codename : bullseye
butler-sos | 2022-08-21T18:13:43.398Z info: Virtual : falsebutler-sos | 2022-08-21T18:13:43.398Z info: Processors : 4butler-sos | 2022-08-21T18:13:43.399Z info: Physical cores : 4butler-sos | 2022-08-21T18:13:43.399Z info: Cores : 4butler-sos | 2022-08-21T18:13:43.400Z info: Docker arch. : undefined
butler-sos | 2022-08-21T18:13:43.400Z info: Total memory : 6233055232butler-sos | 2022-08-21T18:13:43.401Z info: Standalone app : falsebutler-sos | 2022-08-21T18:13:43.401Z info: --------------------------------------
butler-sos | 2022-08-21T18:13:43.402Z info: Client cert: /nodeapp/config/certificate/client.pem
butler-sos | 2022-08-21T18:13:43.402Z info: Client cert key: /nodeapp/config/certificate/client_key.pem
butler-sos | 2022-08-21T18:13:43.402Z info: CA cert: /nodeapp/config/certificate/root.pem
butler-sos | 2022-08-21T18:13:43.421Z verbose: MAIN: Anonymous telemetry reporting has been set up.
butler-sos | 2022-08-21T18:13:43.423Z verbose: MAIN: Starting Docker healthcheck server...
butler-sos | 2022-08-21T18:13:43.428Z info: USER EVENT: UDP server listening on 0.0.0.0:9997
butler-sos | 2022-08-21T18:13:43.429Z info: LOG EVENT: UDP server listening on 0.0.0.0:9996
butler-sos | 2022-08-21T18:13:43.461Z info: MAIN: Started Docker healthcheck server on port 12398.
butler-sos | 2022-08-21T18:13:43.462Z info: MAIN: Starting Prometheus Butler SOS endpoint on 0.0.0.0:9842.
butler-sos | 2022-08-21T18:13:43.464Z verbose: PROM: Setting up Prometheus client for server: sense1
butler-sos | 2022-08-21T18:13:43.465Z verbose: PROM: Setting up Prometheus client for server: sense2
butler-sos | 2022-08-21T18:13:43.482Z info: PROM: Prometheus Butler SOS metrics server now listening on port 9842butler-sos | 2022-08-21T18:13:43.483Z info: PROM: Prometheus Node.js metrics server now listening on port 0.0.0.0:9001
butler-sos | 2022-08-21T18:13:45.080Z verbose: --------------------------------
butler-sos | 2022-08-21T18:13:45.081Z verbose: Iteration # 1, Uptime: 0 months, 0 days, 0 hours, 0 minutes, 2.007 seconds, Heap used 31.56 MB of total heap 60.81 MB. External (off-heap): 2.98 MB. Memory allocated to process: 102.28 MB.influxdb |[httpd] 172.24.0.2 - - [21/Aug/2022:18:13:45 +0000]"POST /write?db=senseops&p=&precision=n&rp=&u= HTTP/1.1 "2040"-""-" feaf181f-217c-11ed-8004-0242ac180003 44267butler-sos | 2022-08-21T18:13:45.137Z verbose: MEMORY USAGE INFLUXDB: Sent Butler SOS memory usage data to InfluxDB
butler-sos | 2022-08-21T18:13:45.198Z verbose: UPTIME NEW RELIC: Sent Butler SOS memory usage data to New Relic account 123456789("Ptarmigan Labs NR account")...
...
From a separate shell we can then ensure that the expected Docker containers are running:
➜  ~ docker ps
CONTAINER ID   IMAGE                             COMMAND                  CREATED              STATUS                        PORTS                                            NAMES
2311d17d1285   ptarmiganlabs/butler-sos:latest   "docker-entrypoint.s…"   About a minute ago   Up About a minute (healthy)                                                    butler-sos
a22307d12263   influxdb:1.8.10                   "/entrypoint.sh infl…"   About a minute ago   Up About a minute             0.0.0.0:8082->8082/tcp, 0.0.0.0:8086->8086/tcp   influxdb
81df665545d0   grafana/grafana:latest            "/run.sh"                About a minute ago   Up About a minute             0.0.0.0:3000->3000/tcp                           grafana
➜  ~
That’s great, we now have a single command (docker-compose -f docker-compose_fullstack_influxdb.yml up -d for background/daemon mode) to bring up all the tools needed to monitor a Qlik Sense cluster!
Now, let’s see if any data has arrived in InfluxDB.
Let’s check this by going into Grafana, which is available on port 3000.
First time logging into a new Grafana instance you can use the default admin account (username=admin, password=admin).
You will be asked to change that password during first login.
First add a data source in Grafana, pointing it to the local InfluxDB server.
Adding an InfluxDB data source in Grafana
Now we can create a basic chart in Grafana, showing for example Butler SOS’ own memory usage.
After a while we should see some data in the chart:
Butler SOS' own memory usage, stored in InfluxDB and visualized in Grafana
Need to stop the entire stack of tools?
Easy - just run docker-compose -f docker-compose_fullstack_influxdb.yml down:
How to use Butler SOS with Prometheus and Grafana using Docker.
Warning
Work in progress
While Butler SOS’ Prometheus support is functional and works well, this documentation page is not yet complete.
Info
Prometheus is extremely powerful and flexible.
In fact, it’s probably the closest thing there is to a de facto standard for monitoring large scale software systems today.
No matter if you run Kubernetes cluster spanning multiple data centers and continents, or just a single Butler SOS instance - Prometheus is an excellent choice for monitoring of operational metrics.
That power and flexibility also means it can be challenging to set up Prometheus.
Usually it’s not that difficult, but if you’re new to Docker and has no previous experience with monitoring tools, using InfluxDB is usually a bit easier.
Or view it as a chance to learn more about one of the absolute stars of open source software - Prometheus is awesome!
This page assumes you don’t already have Prometheus and Grafana running.
If you already have access to those tools you can of course instead configure them to work with Butler SOS.
Running in Docker using docker-compose
The easiest way to get started is to run these tools in Docker containers, controlled by docker-compose files.
Running them under Kubernetes will give you a whole other level of fault tolerance, scalability etc - but this also requires much more when it comes to Kubernetes skills.
Use the setup that’s relevant to your use case.
You can use a single docker-compose file for Butler SOS, Prometheus and Grafana - or separate docker-compose files for each tool.
The advantage of using a single docker-compose file is that the entire stack of tools will be launched in unison. You can create dependencies between the tools if needed etc - very convenient.
On the other hand, having separate docker-compose files makes it easier to restart (or upgrade or in other ways change) a single service without affecting other services.
Full stack docker-compose file
Let’s start Butler SOS, Prometheus and Grafana from a single docker-compose_fullstack_prometheus.yml file:
Assuming you’ve already completed the setup of Butler SOS, the result of running the docker-compose_fullstack_prometheus.yml file above is something like this:
...
...
From a separate shell we can then ensure that the expected Docker containers are running:
➜ docker ps
CONTAINER ID   IMAGE                             COMMAND                  CREATED         STATUS                            PORTS                                                                                  NAMES
➜
That’s great, you now have a single command (docker-compose -f docker-compose_fullstack_influxdb.yml up -d for background/daemon mode) to bring up all the tools needed to monitor a Qlik Sense cluster!
Need to stop the entire stack of tools?
Easy - just run docker-compose -f docker-compose_fullstack_influxdb.yml down:
➜ docker-compose -f docker-compose_fullstack_influxdb.yml down
➜
2.3 - Setup
Everything you wanted to know about Butler SOS configuration but never dared to ask.
2.3.1 - Which config file to use
Butler SOS can use multiple config files. Here you learn to control which one is used by Butler SOS.
A description of the config file format is available here.
Select which config file to use
Butler SOS uses configuration files in YAML format.
Butler SOS comes with a default config file called production_template.yaml.
Make a copy of it, then rename the copy to butler-sos-config-prod.yaml, production.yaml, staging.yaml or something else suitable to your specific use case.
Trying to run Butler SOS with the default config file (the one included in the files download from GitHub) will not work - you must adapt it to your server environment. For example, you need to enter the IP or host name of you Sense server(s), the IP or host name where Butler SOS is running, where the Sense certificates are stored etc.
The name of the config file matters. Unless you specifically name which config to use when starting Butler SOS, it will look for an environment variable called “NODE_ENV” and then try to load a config file named with the value found in NODE_ENV.
Example 1:
Environment variable NODE_ENV = production
Butler SOS is started without specifying a config file: butler.exe --loglevel info
Butler SOS will look for a config file config/production.yaml.
Example 2:
Butler SOS is started with a command line option specifying a config file: butler.exe --configfile d:\some\path\butler-sos-config-prod.yaml --loglevel info
Butler SOS will not look at the NODE_ENV environment variable. Settings will be loaded from the butler-sos-config-prod.yaml instead.
Running several Butler SOS instances in parallel
If you have several Sense clusters (for example DEV, TEST and PROD environments) you can either monitor them all from a single Butler SOS instance, or set up separate instances for each Sense cluster.
The second case is implemented by creating several config files: butler-sos-dev.yaml, butler-sos-test.yaml and butler-sos-prod.yaml.
In this scenario three instances of Butler SOS should be started, each given a different config file by setting the NODE_ENV variable as needed when starting Butler SOS.
Or (this option is usually much easier!) use the --configfile command line option when starting Butler SOS.
Note: If running several Butler SOS instances in parallel, you must also ensure that each one uses unique port numbers for their respective UDP servers etc.
Setting environment variables
The method for setting environment variables varies between operating systems:
On Windows:
set NODE_ENV=production
Mac OS or Linux
export NODE_ENV=production
If using Docker, the NODE_ENV environment variable is set in the docker-compose.yml file (as already done in the template docker-compose files.)
2.3.2 - Config file verification
How to verify that the Butler SOS config file is valid.
A description of the config file format is available here.
Getting the config file correctly set up is usually the most challenging part of setting up Butler SOS.
The config file is written in an easy to read YAML format, but given the number of settings that can be configured, it can be a bit daunting to get it right.
Verify the config file
Config file verification is enabled by default.
Verification is done when Butler SOS is started, and if the config file is not valid, Butler SOS will not start.
Info
All settings in the config file are mandatory.
If you don’t want to use a specific Butler SOS feature, you must still include its settings in the config file, but you are free to disable the feature and set its setting to empty strings/values/arrays, or just leave the default values in place.
Skipping config file verification
If you want to skip config file verification, you can do so by starting Butler SOS with the ‘–skip-config-verificationsetting totrue` in the config file.
This will bypass all checks of the config file’s validity, and Butler SOS will try to start with the provided config file.
This can be useful if you are in the process of setting up Butler SOS and want to start it before the config file is complete, but for production scenarios it is recommended to leave config file verification enabled.
2.3.3 - Visualise the config file
Butler SOS can visualise its config file on a web page, using an internal web server.
This can be useful for troubleshooting and understanding how Butler SOS is configured.
The configuration can optionally be obfuscated to hide sensitive information.
What’s this?
Butler SOS can visualise its config file on a web page, using an internal web server.
This can be useful for troubleshooting and understanding how Butler SOS is configured.
If enabled, the web server will serve a web page on the IP address and port specified in the config file.
The default IP address is localhost and the default port is 3100.
By clicking the “Download
JSON and YAML
The web page will show the config file in both JSON and YAML format.
The JSON format is useful if you want to copy the config file and paste it into a JSON validator, for example.
The YAML format is easier to read and understand for humans, and is also the format used in the config file.
Examples:
Butler SOS config file visualization - JSON view
Butler SOS config file visualization - YAML view
Obfuscation
The configuration can optionally be obfuscated to hide sensitive information.
This is useful if you need to share the config file with someone else, but don’t want to share sensitive information like IP addresses, user names or passwords.
Obfuscation is enabled/disabled in the config file.
For example, if asking for support on the Butler SOS forum, you can share the obfuscated config file without revealing sensitive information.
Disclaimer: Obfuscation is not foolproof, but it should be good enough for most use cases.
Always check the obfuscated config file before sharing it.
Settings in config file
Butler-SOS:......# Should Butler SOS start a web server that serves an obfuscated view of the Butler SOS config file?configVisualisation:enable:truehost:localhost # Hostname or IP address where the web server will listen. Should be localhost in most cases.port:3100# Port where the web server will listen. Change if port 3100 is already in use.obfuscate:true# Should the config file shown in the web UI be obfuscated?......
2.3.4 - Configuring Butler SOS logging
Butler SOS can log its activities to console and disk files.
Log files can be useful for retrospective troubleshooting of Butler SOS.
What’s this?
Butler SOS continuously logs what its doing.
Logging is always done to console and optionally also to disk files.
The top level section Butler-SOS in the config file has a set of settings that control logging.
Log level (verbosity) can be set, logging to disk can be enabled/disabled and the directory where log files are stored can be set.
Log level can also be set on the command line when starting Butler SOS, using the --loglevel option.
Log files are kept for 30 days, after which they are automatically deleted.
Settings in main config file
Butler-SOS:......# Logging configurationlogLevel:info # Log level. Possible log levels are silly, debug, verbose, info, warn, errorfileLogging:true# true/false to enable/disable logging to disk filelogDirectory:log # Subdirectory where log files are stored......
2.3.5 - Configuring Butler SOS heartbeats
Heartbeats provide a way to monitor that Butler SOS is running and working as intended.
Butler SOS can send periodic heartbeat messages to a monitoring tool, which can then alert if Butler SOS hasn’t checked in as expected.
Optional
These settings are optional.
If you don’t need this feature just disable it and leave the default values in the config as they are.
Do note though that Butler SOS expects the configuration properties below to exist in the config file, but will ignore their values if the related features are disabled.
What’s this?
A tool like Butler SOS should be viewed as mission critical, at least if it is used to monitor mission critical Sense apps.
But how can you know whether Butler SOS itself is working?
Somehow Butler SOS should be monitored.
Butler SOS (and most other tools in the Butler family) has a heartbeat feature.
It sends periodic messages to a monitoring tool, which can then alert if Butler SOS hasn’t checked in as expected.
Healthchecks.io is an example of such as tool. It’s open source and can be self-hosted, but also has a SaaS option if so preferred.
Uptime Kuma is another great tool that can be used, it has a somewhat slicker UI than Healthchecks.io - but it’s really a matter of personal preference which one to use.
More info on using Healthchecks.io with Butler (Butler SOS works the same way) can be found in this blog post.
Settings in main config file
Butler-SOS:......# Heartbeats can be used to send "I'm alive" messages to some other tool, e.g. an infrastructure monitoring tool# The concept is simple: The remoteURL will be called at the specified frequency. The receiving tool will then know# that Butler SOS is alive.heartbeat:enable:trueremoteURL:http://my.monitoring.server/some/path/frequency:every 1 hour # https://bunkat.github.io/later/parsers.html#text......
2.3.6 - Docker healthcheck
Docker has a concept of “health checks”, which is a way for Docker containers to tell the Docker runtime engine that the container is alive and well.
Butler SOS can be configured to send such health check messages to Docker.
Optional
These settings are optional.
If you don’t need this feature just disable it and leave the default values in the config as they are.
Do note though that Butler SOS expects the configuration properties below to exist in the config file, but will ignore their values if the related features are disabled.
Note: Sending health check messages is only meaningful when running Butler SOS as a Docker container.
Settings in main config file
Butler-SOS:......# Docker health checks are used when running Butler SOS as a Docker container. # The Docker engine will call the container's health check REST endpoint with a set interval to determine# whether the container is alive/well or not.# If you are not running Butler SOS in Docker you can safely disable this feature. dockerHealthCheck:enable:true# Control whether a REST endpoint will be set up to serve Docker health check messagesport:12398# Port the Docker health check service runs on (if enabled)......
2.3.7 - Configuring Butler SOS uptime monitor
Butler SOS can optionally log how long it’s been running and how much memory it uses.
Optionally the memory usage can also be stored to an InfluxDB database or sent to New Relic, for later viewing/alerting in for example a Grafana dashboard or within New Relic.
Optional
These settings are optional.
If you don’t need this feature just disable it and leave the default values in the config as they are.
Do note though that Butler SOS expects the configuration properties below to exist in the config file, but will ignore their values if the related features are disabled.
What’s this?
In some cases - especially when investigating issues or bugs - it can be useful to get log messages telling how long Butler SOS has been running and how much memory it uses.
This feature is called “uptime monitoring” and can be enabled in the main config file. The feature is being added to more and more tools in the Butler family of tools for Qlik Sense.
The logging interval is configurable, as is the log level required for uptime messages to be shown in the console/file log.
Select a reasonable retention policy and logging frequency!
You will rarely if ever need to know how much memory Butler SOS used a month ago… A retention policy of 1-2 weeks is usually a good start, logging uptime metrics every few minutes.
InfluxDB
The memory usage data can optionally be written to InfluxDB, from where it can later be viewed in Grafana.
The metrics will be stored in the database specified in the Butler-SOS.influxdbConfig section of the config file.
Note that Butler-SOS.influxdbConfig.enable must also be set to true for any data to be sent to InfluxDB.
New Relic
Uptime metrics can be sent to zero or more New Relic accounts.
New Relic attributes (a concept where each data point sent to New Relic is tagged with a set of attributes) can be added to the metrics.
Attributes come in two forms: Static and dynamic.
Static attributes are hard-coded strings that don’t change over time. Could be used to distinguish metrics from DEV, TEST and PROD Sense environments.
Dynamic attributes may change each time Butler SOS is started, or even more often in the future if/when more dynamic attributes are added.
An example is the Butler SOS version, which will change when Butler SOS is upgraded to a new version.
Log level
The log level does not affect storing uptime metrics in InfluxDB or New Relic.
Settings in main config file
Butler-SOS:......# Uptime monitoruptimeMonitor:enable:true# Should uptime messages be written to the console and log files?frequency:every 15 minutes # https://bunkat.github.io/later/parsers.html#textlogLevel:verbose # Starting at what log level should uptime messages be shown in console log and log files?storeInInfluxdb:butlerSOSMemoryUsage:true# Should data on Butler SOS' own memory use be stored in Infludb?instanceTag:PROD # Tag that can be used to differentiate data from multiple Butler SOS instancesstoreNewRelic:enable:truedestinationAccount:- First NR account- Second NR accountmetric:dynamic:butlerMemoryUsage:enable:true# Should Butler SOS' memory/RAM usage be sent to New Relic?butlerUptime:enable:true# Should Butler SOS' uptime (how long since it was started) be sent to New Relic?attribute:static:# Static attributes/dimensions to attach to the data sent to New Relic.- name:metricTypevalue:butler-sos-uptime- name:qs_servicevalue:butler-sos- name:qs_environmentvalue:proddynamic:butlerVersion:enable:true# Should the Butler SOS version be included in the data sent to New Relic?......
2.3.8 - Credentials to third party services
Optional
These settings are optional.
If you do not use any third party services with Butler SOS you can leave the default values in this section.
What’s this?
Butler SOS can interact with certain third party services, such as New Relic.
These services typically require some kind of authentication with associated credentials (username, password etc).
Those credentials are stored in the Butler-SOS.thirdPartyToolsCredentials section of the config file.
New Relic
Zero, one or more New Relic accounts with their respective credentials can be specified.
These accounts can then be used by Butler SOS’ various features.
Note that different Butler SOS features can send their data to different New Relic accounts.
This is specified in each feature’s section in the YAML config file.
Example:
Sense user events are sent to First NR account
Sense log events are sent to Second NR account
Sense RAM usage is sent to both First NR account and Second NR account
Note that the accountName setting is only used within Butler SOS to reference the different New Relic accounts.
Specifically, it is not used by or within New Relic itself.
Settings in main config file
---Butler-SOS:......# Credentials for third party systems that Butler SOS integrate with.# These can also be specified via command line parameters when starting Butler SOS.# Command line options takes precedence over settings in this config file.thirdPartyToolsCredentials:newRelic:# Array of New Relic accounts/insert keys.- accountName:First NR accountinsertApiKey:<API key 1 (with insert permissions) from New Relic>accountId:<New Relic account ID 1>- accountName:Second NR accountinsertApiKey:<API key 2 (with insert permissions) from New Relic>accountId:<New Relic account ID 2>......
2.3.9 - General Sense event settings
Butler SOS can act as a receiver of Qlik Sense events, sent as UDP messages from Qlik Sense Enterprise.
This section of the config file contains general settings for how Butler SOS should handle these events.
More specific settings for each event type (user, log, …) can be found in the respective sections of the config file.
What’s this?
Butler SOS can receive events from Qlik Sense Enterprise, sent as UDP messages.
Two kinds of events are supported: User events and log events.
User events are events that are generated when a user interacts with Qlik Sense, for example logging into Sense or opening an app.
Log events originate from the Sense logging framework itself, which is also responsible for logging things to Qlik Sense’s own log files.
Some aspects of these events are general in nature, i.e. shared between the different event types, and are configured in this section of the config file.
Counters for user and log events
If log and/or user events are enabled there is a risk that the number of events generated by a QSEoW cluster can be overwhelming.
To make it easier to understand the volume of events generated, Butler SOS can be configured to count the number of events generated by the Sense cluster.
The counters are stored in InfluxDB and can be used to create dashboards in Grafana.
Each InfluxDB datapoint has tags and fields as described in the reference section.
Rejected events
Butler SOS can be configured to reject certain events even though the event is correctly formatted and contains valid data.
The need to do this can arise if the Sense cluster generates a large number of events, and not all of them are relevant for the current monitoring use case.
For example, performance log events (event name qseow-qix-perf) will be emitted by Sense every 2 seconds during scheduled reloads.
There is rarely a need to store all these events in InfluxDB, so they can be filtered out (=rejected) by Butler SOS.
But they can also be seen as valid and stored in InfluxDB, depending on the use case.
Rejected events are counted and the counters stored in InfluxDB.
They can be used to understand how many events are rejected by Butler SOS, versus how many are received in total (see the section above).
The InfluxDB measurement name is defined in the config file, Butler-SOS.qlikSenseEvents.rejectedEventCount.influxdb.measurementName.
Each event type and name may have its own rejection settings, defined in the respective sections of the config file.
They may also store different tags and fields in InfluxDB.
The currently defined rejection settings are:
Performance log events
These events come from the Qlik associative engine (the “QIX engine”) an contain very detailed performance data about apps, app objects, charts, user selections in apps etc.
Counters for rejected performance log events are enabled via the Butler-SOS.logEvents.enginePerformanceMonitor.trackRejectedEvents.enable setting in the config file.
Once this data is in InfluxDB it can be used in Grafana dashboards, for example showing how long each app takes to open:
Average time to open Sense apps
The data stored in InfluxDB for performance log events is described here.
Settings in main config file
---Butler-SOS:......# Shared settings for user and log events (see below)qlikSenseEvents:# Shared settings for user and log events (see below)influxdb:enable:false# Should summary (counter) of user/log events, and rejected events be stored in InfluxDB?writeFrequency:20000# How often (milliseconds) should rejected event count be written to InfluxDB?eventCount:# Track how many events are received from Sense.# Some events are valid, some are not. Of the valid events, some are rejected by Butler SOS# based on the configuration in this file.enable:false# Should event count be stored in InfluxDB?influxdb:measurementName:event_count# Name of the InfluxDB measurement where event count is storedtags:# Tags are added to the data before it's stored in InfluxDB- name:envvalue:DEV- name:foovalue:barrejectedEventCount:# Rejected events are events that are received from Sense, that are correctly formatted,# but that are rejected by Butler SOS based on the configuration in this file.# An example of a rejected event is a performance log event that is filtered out by Butler SOS.enable:false# Should rejected events be counted and stored in InfluxDB?influxdb:measurementName:rejected_event_count# Name of the InfluxDB measurement where rejected event count is stored......
Log appender XML files
Sample log appender files are available in the ZIP file available from the download page, in subfolders engine/proxy/repository/scheduler of config/log_appender_xml/ folder.
Note that the log appender files contain slightly different information for each Sense service (engine/proxy/repository/scheduler)!
Also keep in mind that the log appender files must be called LocalLogConfig.xml and placed in these directories on the all Sense servers (assuming the default installation path of Qlik Sense):
C:\ProgramData\Qlik\Sense\Engine
C:\ProgramData\Qlik\Sense\Proxy
C:\ProgramData\Qlik\Sense\Repository
C:\ProgramData\Qlik\Sense\Scheduler
Tip
If you have more than one Sense server you strictly speaking don’t have to deploy log appenders to all servers.
If you are only interested in receiving log events from some servers and/or services (engine, proxy, repository, scheduler) - deploy the log appender files there.
2.3.9.1 - Configuring user events
Optional
These settings are optional.
If you don’t do anything user activity events are turned off by default.
What’s this?
User events are among the most detailed bits of information retrieved from Sense by Butler SOS.
They capture session start/stop events (=users logging in/out) and connection open/close events (apps opened/closed in browser tabs).
These events rely on two things to be correctly configured:
Settings in Butler SOS’ config file.
Log appender XML file(s) being deployed on the Sense server(s) where user activity events should be captured.
Both are described below.
Tech deep-dive
The user events are created by hooking into Sense’s logging framework, which is called Log4Net.
By placing a carefully crafted XML file in the Qlik Sense proxy service’s configuration directory, we can instruct Log4Net to forward certain Sense log events that we are interested in to Butler SOS.
In this case we are interested in session start/stop and connection open/close events.
The XML file is also known as a “log appender file”.
It contains instructions that tell Log4Net to do various things when the specified filter matches the actual log data created by Sense. Examples include sending emails, writing log entries to disk (i.e. regular file logging!), sending the log row as a UDP message and more.
Here we’re interested in the UDP message feature.
So, by means of a log appender file we tell Log4Net to send certain log rows to Butler SOS as UDP messages.
We also have to specify in the log appender file what host/IP address and port Butler SOS listens to, i.e. where the UDP messages should be sent.
Finally we have to make sure firewalls are open and allow UDP traffic from the Sense server(s) to Butler SOS.
If everything is set up correctly UDP messages will arrive at Butler SOS within seconds after the actual event taking place in Qlik Sense, i.e. close to real-time.
Tagging of data
InfluxDB
The tags added to InfluxDB are described in the reference documentation for log events.
New Relic
The following attributes (which is New Relic lingo for tags) are added:
A core set of attributes are added to all user events
qs_host: Host name of the Sense server the event originated at.
qs_event_action: What kind of user event that took place. Examples are “Start session”, “Stop session, “Open connection”, “Close connection”.
qs_userFull: Full directory/user ID of the user the event is about. Will be scrambled if scrambling enabled in config file.
qs_userDirectory: User directory of the user the event is about. Will be scrambled if scrambling enabled in config file.
qs_userId: User ID of the user the event is about. Will be scrambled if scrambling enabled in config file.
qs_origin: What kind of activity caused the event, for example “AppAccess”. May be empty for some user events.
qs_appId: App ID of the app the event is about. May be empty for some user events.
qs_appName: App name of the app the event is about. May be empty for some user events.
qs_uaBrowserName: Browser name of the user agent that caused the event.
qs_uaBrowserMajorVersion: Browser major version of the user agent that caused the event.
qs_uaOsName: OS name of the user agent that caused the event.
qs_uaOsVersion: OS version of the user agent that caused the event.
Custom attributes defined in the Butler SOS config file’s Butler-SOS.userEvents.tags section of the config file.
Note: Attributes defined further down in the list above will overwrite already defined attributes if their names match.
To avoid problems you should make sure not to use already defined attributes.
Settings in config file
---Butler-SOS:......# Track individual users opening/closing apps and starting/stopping sessions. # Requires log appender XML file(s) to be added to Sense server(s).userEvents:enable:falseexcludeUser:# Optional blacklist of users that should be disregarded when it comes to user events- directory:LABuserId:testuser1- directory:LABuserId:testuser2udpServerConfig:serverHost:<IP or FQDN> # Host/IP where user event server will listen for events from SenseportUserActivityEvents:9997# Port on which user event server will listen for events from Sensetags:# Tags are added to the data before it's stored in InfluxDB- tag:envvalue:DEV- tag:foovalue:barsendToMQTT:enable:false# Set to true if user events should be forwarded as MQTT messagespostTo:# Control when and to which MQTT topics messages are sent everythingTopic:# Topic to which all user events are sentenable:truetopic:qliksense/usereventsessionStartTopic:# Topic to which "session start" events are sentenable:truetopic:qliksense/userevent/session/startsessionStopTopic:# Topic to which "session stop" events are sentenable:truetopic:qliksense/userevent/session/stopconnectionOpenTopic:# Topic to which "connection open" events are sentenable:truetopic:qliksense/userevent/connection/openconnectionCloseTopic:# Topic to which "connection close" events are sentenable:truetopic:qliksense/userevent/connection/closesendToInfluxdb:enable:true# Set to true if user events should be stored in InfluxDBsendToNewRelic:enable:false# Should log events be sent to New Relic?destinationAccount:- First NR account- Second NR accountscramble:true# Should user info (user directory and user ID) be scrambled before sent to NR?......
Log appender XML files
A sample log appender file LocalLogConfig.xml is available in the ZIP file available from the download page, in the config/log_appender_xml/proxy/LocalLogConfig.xml folder.
That file includes log appenders for both user and log events.
Looks like this:
<?xml version="1.0" encoding="UTF-8"?><configuration><!-- Log appender finding user session events --><appendername="EventSession"type="log4net.Appender.UdpAppender"><filtertype="log4net.Filter.StringMatchFilter"><paramname="stringToMatch"value="Start session for user"/></filter><filtertype="log4net.Filter.StringMatchFilter"><paramname="stringToMatch"value="Stop session for user"/></filter><filtertype="log4net.Filter.DenyAllFilter"/><paramname="remoteAddress"value="FQDN or IP of server where Butler SOS is running"/><paramname="remotePort"value="9997"/><paramname="encoding"value="utf-8"/><layouttype="log4net.Layout.PatternLayout"><converter><paramname="name"value="hostname"/><paramname="type"value="Qlik.Sense.Logging.log4net.Layout.Pattern.HostNamePatternConverter"/></converter><paramname="conversionpattern"value="/qseow-proxy-session/;%hostname;%property{Command};%property{UserDirectory};%property{UserId};%property{Origin};%property{Context};%message"/></layout></appender><!-- Log appender finding user connection events --><appendername="EventConnection"type="log4net.Appender.UdpAppender"><filtertype="log4net.Filter.StringMatchFilter"><paramname="stringToMatch"value="connection Opened for session"/></filter><filtertype="log4net.Filter.StringMatchFilter"><paramname="stringToMatch"value="connection Closed for session"/></filter><filtertype="log4net.Filter.DenyAllFilter"/><paramname="remoteAddress"value="FQDN or IP of server where Butler SOS is running"/><paramname="remotePort"value="9997"/><paramname="encoding"value="utf-8"/><layouttype="log4net.Layout.PatternLayout"><converter><paramname="name"value="hostname"/><paramname="type"value="Qlik.Sense.Logging.log4net.Layout.Pattern.HostNamePatternConverter"/></converter><paramname="conversionpattern"value="/qseow-proxy-connection/;%hostname;%property{Command};%property{UserDirectory};%property{UserId};%property{Origin};%property{Context};%message"/></layout></appender><!-- Generic appender for detecting warnings and errors --><appendername="LogEvent"type="log4net.Appender.UdpAppender"><paramname="threshold"value="warn"/><paramname="remoteAddress"value="FQDN or IP of server where Butler SOS is running"/><paramname="remotePort"value="9996"/><paramname="encoding"value="utf-8"/><layouttype="log4net.Layout.PatternLayout"><converter><paramname="name"value="rownum"/><paramname="type"value="Qlik.Sense.Logging.log4net.Layout.Pattern.CounterPatternConverter"/></converter><converter><paramname="name"value="hostname"/><paramname="type"value="Qlik.Sense.Logging.log4net.Layout.Pattern.HostNamePatternConverter"/></converter><converter><paramname="name"value="longIso8601date"/><paramname="type"value="Qlik.Sense.Logging.log4net.Layout.Pattern.Iso8601TimeOffsetPatternConverter"/></converter><converter><paramname="name"value="user"/><paramname="type"value="Qlik.Sense.Logging.log4net.Layout.Pattern.ServiceUserNameCachedPatternConverter"/></converter><converter><paramname="name"value="encodedmessage"/><paramname="type"value="Qlik.Sense.Logging.log4net.Layout.Pattern.EncodedMessagePatternConverter"/></converter><converter><paramname="name"value="encodedexception"/><paramname="type"value="Qlik.Sense.Logging.log4net.Layout.Pattern.EncodedExceptionPatternConverter"/></converter><paramname="conversionpattern"value="/qseow-proxy/;%rownum{9999};%longIso8601date;%date;%level;%hostname;%logger;%user;%encodedmessage;%encodedexception;%property{UserDirectory};%property{UserId};%property{Command};%property{Result};%property{Origin};%property{Context}"/></layout></appender><!-- Send UDP message to Butler SOS on user activity --><loggername="AuditActivity.Proxy"><appender-refref="EventSession"/><appender-refref="EventConnection"/></logger><!-- Send UDP message to Butler SOS on warnings and errors --><loggername="Audit.Proxy"><appender-refref="LogEvent"/></logger><loggername="AuditSecurity"><appender-refref="LogEvent"/></logger><loggername="Security.Proxy"><appender-refref="LogEvent"/></logger><loggername="System.Proxy"><appender-refref="LogEvent"/></logger></configuration>
Tip
If you have several servers in your Sense cluster you probably need several log appender files too.
More specifically, you should put a log appender file on each server where the Qlik Sense proxy service is running, i.e. on all servers via which end users access the Sense cluster.
Note the places where you need to fill in the IP/host where Butler SOS is running, as well as the port number to use (set to 9997 but can be changed if needed).
Make necessary changes so the file matches your environment, then deploy to C:\ProgramData\Qlik\Sense\Proxy\LocalLogConfig.xml (adapt path if you have a different installation path).
Note that the file must be called LocalLogConfig.xml!
Sense will usually detect and use the file without any restarts needed, but it can take a while. You can always restart the Sense proxy service to make sure the XML file is applied and used.
Once in place you should see events in the Butler SOS console/file logs if you set logging level to verbose, debug or silly.
2.3.9.2 - Configuring log events
Optional
These settings are optional.
If you don’t do anything log events are turned off by default.
What’s this?
Butler SOS log events are designed to be a replacement for the most important/useful aspects of Qlik Sense’ log database, which was removed from Qlik Sense Enterprise on Windows in mid 2021.
The log events capture warnings, errors and fatals from the various QSEoW subsystems.
These events used to be sent to the PostgreSQL logging database, most (but not all) are also sent to QSEoW’s log files.
Using Butler SOS’ log events is arguably even better than getting the same information from log db:
Log db had to be polled to detect new log events and this polling could realistically only be done every few minutes. It also put additional load on an often already struggling part of many QSEoW clusters.
With Butler SOS’ log events concept the notifications are almost instantaneous.
Errors and warnings show up in the Grafana or New Relic dashboards within seconds after taking place in QSEoW.
Log events rely on two things to work:
Settings in the Butler SOS config file.
Log appender XML files being deployed on the Sense servers where log events should be captured.
Both are described below.
Info
As of Butler SOS version 9.2, log events are captured in these QSEoW services:
Engine
Proxy
Repository
Scheduler
Support for additional modules is reasonably easy to add, please create a ticket if you believe some service should be added to the list above.
Tech deep-dive
The underlying mechanism is the same as described on the user events page.
Tagging of data
Categorizing log events
Log events can optionally be categorized by Butler SOS.
The reason for categorizing log events is to make it easier to make Sense of the potentially large number of log events that can be generated by a QSEoW cluster.
For example, if a QSEoW cluster creates 1000 warnings and errors per hour, it’s difficult to know which warnings are important and which are not.
By categorizing the messages, for example by the subsystem that generated them and/or what they refer to, it’s easier to understand what’s going on.
Possible ways of categorizing log events could be “access denied” issues, “user directory” issues, “app reload failed” issues, “general engine issues” etc.
Log events can be categorized in any number of ways, but the template config file contains a few examples.
Specifically:
Access denied issues
Captures log events of severity WARN and ERROR.
Match log events against two filters.
Log message starts with “Access was denied for User:”.
Log message contains “was denied for User
categorizes them by setting category tag qs_log_category to access-denied.
AD issues
Captures log events of severity WARN and ERROR.
Match log events against one filter.
Log message starts with “Duplicate entity with userId”.
categorizes them by setting category tag qs_log_category to user-directory.
Qlik Sense service down
Captures log events of severity WARN.
Match log events against two filters.
Log message starts with “Failed to request service alive response from”.
Log message contains “Unable to connect to the remote server”.
categorizes them by setting category tag qs_log_category to qs-service.
Reload task failed
Captures log events of severity WARN and ERROR.
Match log events against four filters.
Log message starts with “Task finished with state FinishedFail”.
Log message starts with “Task finished with state Error”.
Log message ends with “Reload failed in Engine. Check engine or script logs.”.
Log message starts with “Reload sequence was not successful (Result=False, Finished=True, Aborted=False) for engine connection with handle”.
categorizes them by setting category tag qs_log_category to reload-failed.
If no rules match the log event, it will be categorized as unknown.
The default rule can be enabled/disabled in the config file via the ruleDefault.enable parameter.
Note 1: It is possible to assign one or more categories to a log event.
This provides flexibility in how you later create dashboards in for example Grafana or New Relic.
Note 2: The sample/template config file may be updated with more examples in the future.
Tip
It is also possible to drop log events that match a certain pattern, for example if you are never interested in seeing them in Grafana or New Relic.
This is done by setting the action parameter to drop in the config file, for that particular rule.
InfluxDB
The tags added to InfluxDB are described in the reference documentation for log events.
Log categories are added as tags to InfluxDB datapoints.
New Relic
The following attributes (which is New Relic lingo for tags) are added:
A core set of attributes are added to all user events. Note that some attributes will be empty for some/many log events.
qs_ts_iso: Event timestamp in ISO format.
qs_ts_local: Event timestamp in local (server) time zone.
qs_log_source: Which Sense service the event originated in, for example “qseow-proxy”, “qseow-repository”.
qs_log_level: Log level of the event. “WARN”, “ERROR”, or “FATAL”.
qs_host: Host name of the Sense server the event originated at.
qs_subsystem: Which part of each Sense service the event originated in, for example “System.Proxy.Proxy.Core.RequestListener”, “System.Engine.Engine”.
qs_windows_user: Name of the Windows user that’s used to run the Window service where the event originated.
qs_message: Event message.
qs_exception_message: Additional information about the event.
qs_user_full: Full directory/user ID of the user the event is about. Will be scrambled if scrambling enabled in config file.
qs_user_directory: User directory of the user the event is about. Will be scrambled if scrambling enabled in config file.
qs_user_id: User ID of the user the event is about. Will be scrambled if scrambling enabled in config file.
qs_command: What command (if any) caused the event. Example: “Doc::DoSave”, “Doc::CreateObject”.
qs_result_code: Result code as reported by Sense. Usually empty.
qs_origin: What kind of activity caused the event, for example “AppAccess”.
qs_context: Additional information about the event.
qs_task_name: Task name (if any) causing the event.
qs_app_name: App name (if any) causing the event.
qs_task_id: Task ID (if any) causing the event.
qs_app_id: App ID (if any) causing the event.
qs_execution_id: Execution ID as reported by Sense.
qs_proxy_session_id: Proxy session ID as reported by Sense.
qs_engine_ts: Engine timestamp (if any) associated with the event.
qs_process_id: Process ID of engine service.
qs_engine_exe_version: Version of engine service’s EXE file.
qs_server_started: Timestamp when Sense engine service was started.
qs_entry_type: Entry type as reported by Sense. Usually empty.
qs_session_id: Session ID as reported by Sense.
Custom attributes defined in the Butler SOS config file’s Butler-SOS.logEvents.tags section.
Custom attributes defined in the Butler SOS config file’s Butler-SOS.newRelic.event.attribute.static section.
Dynamic attributes
butlerSosVersion: Butler SOS version. Enabled by setting Butler-SOS.newRelic.event.attribute.dynamic.butlerSosVersion.enable to true in config file.
Note: Attributes defined further down in the list above will overwrite already defined attributes if their names match.
To avoid problems you should make sure not to use already defined attributes.
Log categories are currently NOT included in the data sent to New Relic.
Being a template, it contains examples on how configuration may be done - not necessarily how it should be done.
For example, the env/DEV and foo/bar tags are optional and can be changed to something else, or removed all together if not used.
Butler-SOS:......# Log events are used to capture Sense warnings, errors and fatals in real timelogEvents:udpServerConfig:serverHost:<IP or FQDN> # Host/IP where log event server will listen for events from SenseportLogEvents:9996# Port on which log event server will listen for events from Sensetags:# - name: env# value: DEV# - name: foo# value: barsource:engine:enable:false# Should log events from the engine service be handled?proxy:enable:false# Should log events from the proxy service be handled?repository:enable:false# Should log events from the repository service be handled?scheduler:enable:false# Should log events from the scheduler service be handled?categorise:# Take actions on log events based on their contentenable:falserules:# Rules are used to match log events to filters# - description: Find access denied errors# logLevel: # Log events of this Log level will be matched. WARN, ERROR, FATAL. Case insensitive.# - WARN# - ERROR# action: categorise # Action to take on matched log events. Possible values are categorise, drop# category: # Category to assign to matched log events. Name/value pairs.# # Will be added to InfluxDB datapoints as tags.# - name: qs_log_category# value: access-denied# filter: # Filter used to match log events. Case sensitive.# - type: sw # Type of filter. sw = starts with, ew = ends with, so = substring of# value: "Access was denied for User:"# - type: so# value: was denied for User# - description: Find AD issues# logLevel: # Log events of this Log level will be matched. WARN, ERROR, FATAL. Case insensitive.# - ERROR# - WARN# action: categorise # Action to take on matched log events. Possible values are categorise, drop# category: # Category to assign to matched log events. Name/value pairs.# # Will be added to InfluxDB datapoints as tags.# - name: qs_log_category# value: user-directory# filter: # Filter used to match log events. Case sensitive.# - type: sw # Type of filter. sw = starts with, ew = ends with, so = substring of# value: Duplicate entity with userId# - description: Qlik Sense service down# logLevel: # Log events of this Log level will be matched. WARN, ERROR, FATAL. Case insensitive.# - WARN# action: categorise # Action to take on matched log events. Possible values are categorise, drop# category: # Category to assign to matched log events. Name/value pairs.# # Will be added to InfluxDB datapoints as tags.# - name: qs_log_category# value: qs-service# filter: # Filter used to match log events. Case sensitive.# - type: sw # Type of filter. sw = starts with, ew = ends with, so = substring of# value: Failed to request service alive response from# - type: so # Type of filter. sw = starts with, ew = ends with, so = substring of# value: Unable to connect to the remote server# - description: Reload task failed# logLevel: # Log events of this Log level will be matched. WARN, ERROR, FATAL. Case insensitive.# - WARN# - ERROR# action: categorise # Action to take on matched log events. Possible values are categorise, drop# category: # Category to assign to matched log events. Name/value pairs.# # Will be added to InfluxDB datapoints as tags.# - name: qs_log_category# value: reload-failed# filter: # Filter used to match log events. Case sensitive.# - type: sw # Type of filter. sw = starts with, ew = ends with, so = substring of# value: Task finished with state FinishedFail# - type: sw # Type of filter. sw = starts with, ew = ends with, so = substring of# value: Task finished with state Error# - type: ew # Type of filter. sw = starts with, ew = ends with, so = substring of# value: Reload failed in Engine. Check engine or script logs.# - type: sw # Type of filter. sw = starts with, ew = ends with, so = substring of# value: Reload sequence was not successful (Result=False, Finished=True, Aborted=False) for engine connection with handleruleDefault:# Default rule to use if no other rules match the log eventenable:truecategory:- name:qs_log_categoryvalue:unknownenginePerformanceMonitor:# Detailed app performance data extraction from log eventsenable:false# Should app performance data be extracted from log events?appNameLookup:# Should app names be looked up based on app IDs?enable:falsetrackRejectedEvents:enable:false# Should events that are rejected by the app performance monitor be tracked?tags:# Tags are added to the data before it's stored in InfluxDB# - name: env# value: DEV# - name: foo# value: barmonitorFilter:# What objects should be monitored? Entire apps or just specific object(s) within some specific app(s)?# Two kinds of monitoring can be done:# 1) Monitor all apps, except those listed for exclusion. This is defined in the allApps section.# 2) Monitor only specific apps. This is defined in the appSpecific section.# An event will be accepted if it matches any of the rules in the allApps section OR any of the rules in the appSpecific section.allApps:enable:false# Should all apps be monitored?appExclude:# What apps should be excluded from monitoring?# If both appId and appName are specified, both must match the event's data for it to be considered a match.# - appId: 5b817efe-472d-43ce-8a31-6cce34af7de9# - appName: Sales forecast# - appId: f42d6b16-8faf-45ca-a783-59f9da47db6e# appName: Inventory analysisobjectType:allObjectTypes:true# Should all object types be monitored?allObjectTypesExclude:# If allObjectTypes is set to true, the object types in this array are excluded from monitoring.# someObjectTypesInclude (below) is ignored in that case.# - LoadModelList# - <Unknown># - linechart# - mapsomeObjectTypesInclude:# What object types should be included in monitoring?# Only applicable if allObjectTypes is set to false.# - LoadModelList# - sheet# - barchartmethod:allMethods:true# Should all methods be monitored?allMethodsExclude:# If allMethods is set to true, the methods in this array are excluded from monitoring.# someMethodsInclude (below) is ignored in that case.# - Global::OpenApp# - Doc::GetAppLayout# - Doc::CreateSessionObjectsomeMethodsInclude:# What methods should be included in monitoring?# Only applicable if allMethods is set to false.# - GenericObject::GetLayout# - GenericObject::GetHyperCubeContinuousDataappSpecific:enable:false# Should app specific monitoring be done?app:- include:# What apps should be monitored?# If both appId and appName are specified, both must match the event's data for it to be considered a match.# - appId: d7cf16f9-6a95-462a-9ff1-a6d413326de4# - appName: Budget 2025# - appId: 6931136d-c234-4358-a40c-e37153aba7c9# appName: Sales basket analysisobjectType:allObjectTypes:true# Should all object types be monitored?allObjectTypesExclude:# If allObjectTypes is set to true, the object types in this array are excluded from monitoring.# someObjectTypesInclude (below) is ignored in that case.# - table# - mapsomeObjectTypesInclude:# What object types should be included in monitoring?# Only applicable if allObjectTypes is set to false.# - sheet# - barchart# - linechart# - mapappObject:allAppObjects:true# Should all app objects be monitored?allAppObjectsExclude:# If allAppObjects is set to true, the app objects in this array are excluded from monitoring.# someAppObjectsInclude (below) is ignored in that case.# - objectId: AaBbCc# - objectId: DdEeFfsomeAppObjectsInclude:# What app objects should be included in monitoring?# Only applicable if allAppObjects is set to false.# - objectId: YJEpPTmethod:allMethods:true# Should all methods be monitored?allMethodsExclude:# If allMethods is set to true, the methods in this array are excluded from monitoring.# someMethodsInclude (below) is ignored in that case.# - Global::OpenApp# - Doc::GetAppLayout# - Doc::CreateSessionObjectsomeMethodsInclude:# What methods should be included in monitoring?# Only applicable if allMethods is set to false.# - GenericObject::GetLayout# - GenericObject::GetHyperCubeContinuousDatasendToMQTT:enable:false# Should log events be sent as MQTT messages?baseTopic:qliksense/logevent # What topic should log events be forwarded to?postTo:baseTopic:truesubsystemTopics:true# Should log events be sent to subtopics corresponding to the QSEoW subsystems where the events originated?sendToInfluxdb:enable:false# Should log events be stored in InfluxDB?sendToNewRelic:enable:false# Should log events be sent to New Relic?destinationAccount:# - First NR account# - Second NR accountsource:engine:enable:true# Should log events from the engine service be handled?logLevel:error:true# Should error level log events be handled by Butler SOS?warn:true# Should warning level log events be handled by Butler SOS?proxy:enable:true# Should log events from the proxy service be handled?logLevel:error:true# Should error level log events be handled by Butler SOS?warn:true# Should warning level log events be handled by Butler SOS?repository:enable:true# Should log events from the repository service be handled?logLevel:error:true# Should error level log events be handled by Butler SOS?warn:true# Should warning level log events be handled by Butler SOS?scheduler:enable:true# Should log events from the scheduler service be handled?logLevel:error:true# Should error level log events be handled by Butler SOS?warn:true# Should warning level log events be handled by Butler SOS?......
2.3.9.2.1 - Engine performance log events
Butler SOS can capture detailed performance data from the Qlik Sense engine service, based on log events generated by that service.
Due to the risk of generating a large number of log events, this feature comes with a comprehensive set of settings to control what data is captured and stored in InfluxDB, and what is rejected.
Warning
Due to the risk of overwhelming the InfluxDB database with a large number of performance log events, this feature is disabled by default in the sample config file.
If you want to use this feature, you must enable it first.
It’s also recommended to start small and gradually increase the number of performance log events captured, to make sure the InfluxDB database can handle the load.
For example, start by capturing only a few specific types of objects types, methods etc for a limited set of apps, and then gradually increase/customize from there if needed.
What’s this?
“Performance log events” are a regular log events generated by the Qlik Sense engine service.
They get a special name in Butler SOS because they contain detailed performance data about the engine’s operations, something that can be very useful when monitoring the performance of the Qlik Sense engine.
These events make it possible to monitor how the engine is performing in close to real time.
Butler SOS can capture all or some of these events and store them in InfluxDB, where they can be used to create dashboards in Grafana - just like any other events or metrics captured by Butler SOS.
How it works
Once a log event has been identified as a performance log event (by looking at the event name, which is qseow-qix-perf in this case), Butler SOS will extract the data of interest from the event.
The data is then checked against a set of rules/filters to determine if the event should be stored in full detail in InfluxDB (=accepted) or not (=rejected).
For rejected events, a counter is incremented to keep track of how many events have been rejected.
The counters are written to InfluxDB at regular intervals, controlled by the Butler-SOS.qlikSenseEvents.influxdb.writeFrequency setting in the config file.
Once the data has been accepted, it is immediately stored in InfluxDB with a set of tags and fields, as described below.
Filtering of log events
There are two kinds of filters that can be defined in the config file:
Filters that apply to all apps
App specific filters that apply to specific apps
An event will be accepted if it matches either or both of the above filter types.
If an event does not match either of the two filter types, it will be rejected.
Filters applying to all apps
Global filters are defined in the Butler-SOS.logEvents.enginePerformanceMonitor.monitorFilter.allApps section of the config file.
All references to config file settings below are relative to this section.
The all-app filter consists of several parts/subfilters:
Apps for which events should be excluded, based on app ID and/or app name
Object types to include/exclude
Methods to include/exclude
An event must match all of the subfilters to be accepted by the all-app filter.
Enabling/disabling
It is possible to enabled/disable monitoring of all apps via the enable setting.
If disabled no events will be accepted via the global all-apps filter type.
Excluding apps
The appExclude[] array can be used to exclude specific apps from monitoring.
The effect is that events from all apps, except the apps listed in appExclude[], will be accepted (unless the event is rejected by some of the other all-app filters).
appExclude[] can contain zero or more objects, each with either an appId or an appName properties, or both.
If both properties are present, both must match the event’s data for it to be considered a match.
Filtering by object type
The objectType section can be used to filter events based on the object type of the event.
“Object types” are things like barchart, sheet, map, but also internal Sense objects like AppPropsList and appprops.
If objectType.allObjectTypes is set to true, all object types are monitored, except those listed in allObjectTypesExclude[].
someObjectTypesInclude[] is not used in this case.
If objectType.allObjectTypes is set to false, only the object types listed in someObjectTypesInclude[] will result in events being accepted.
allObjectTypesExclude[] is not used in this case.
Put differently: You can either start by including all object types and then specify which ones to exclude, or start with an empty list and add the object types you want to include.
Filtering by method
“Methods” refer to the various operations that the Sense engine performs.
Examples include Global::OpenApp, Global::GetProgress, Doc::GetAppLayout, Doc::CreateSessionObject.
The concepts for filtering by method are the same as for filtering by object type (see above).
Filter applying to specific apps
If the all-app filters are not useful (they may generate too much data, for example), it is possible to define app-specific filters in the Butler-SOS.logEvents.enginePerformanceMonitor.monitorFilter.appSpecific section of the config file.
All references to config file settings below are relative to this section.
App-specific filters are defined in the array app[].
It includes zero or more objects, each of which contains the following subfilters:
Apps to include, based on app ID and/or app name.
Object types to include/exclude
App objects to include/exclude
Methods to include/exclude
The concepts for including all (and then excluding some) or starting with an empty list and adding what you want to include are the same as for the all-app filters.
Enabling/disabling
It is possible to enabled/disable app specific monitoring via the enable setting.
If disabled no events will be accepted via the app specific filter type.
Including apps
The app[].include[] contains the app IDs and/or app names of the apps to include in the filter.
Example:
appSpecific:enable:true# Should app specific monitoring be done?app:- include:# What apps should be monitored?# If both appId and appName are specified, both must match the event's data for it to be considered a match.- appId:d7cf16f9-6a95-462a-9ff1-a6d413326de4- appName:Budget 2025- appId:6931136d-c234-4358-a40c-e37153aba7c9appName:Sales basket analysis
Filtering by object type
The objectType section can be used to filter events based on the object type of the event.
The concepts for filtering by object type are the same as for the all-app filters.
Filtering by app object
The appObject section can be used to filter events based on the object ID of the app object that the event is related to.
This is useful if you want to monitor only specific objects within an app, for example certain chart or table.
Getting the ID of an app object is a bit tricky, but for charts, tables and other UI elements it can be done in a few reasonably easy ways.
The below works for Qlik Sense 2024-May - your mileage may vary for other versions.
Share object from within app
Open the app, then move to the sheet the chart is on.
Right click the chart and select “Share”. Click “Embed”.
The object ID is shown under the preview image of the chart. It is also available in the Iframe URL as the obj parameter.
Get the object ID from the "Share" dialog within the Sense app itself.
Use a Chrome extension
This works if you are using Chrome and have the Add Sense extension installed.
Open the app, then move to the sheet the chart is on.
Click the Add Sense icon in the Chrome toolbar, then “Show” in the menu that appears.
Popup windows will appear with information - including the object ID - about all UI objects on the sheet.
Get the object ID from the Add Sense extension in Chrome.
Use the “Single configurator” in the Qlik Sense Dev Hub
While it is possible to get the object ID from the Dev Hub, it is not recommended as the Dev Hub will be removed in a future version of Qlik Sense.
Still, if you are using a version of Sense that has the Dev Hub, you can get the object ID like this:
Being a template, it contains examples on how configuration may be done - not necessarily how it should be done.
For example, the env/DEV and foo/bar tags are optional and can be changed to something else, or removed all together if not used.
Butler-SOS:......# Log events are used to capture Sense warnings, errors and fatals in real timelogEvents:......enginePerformanceMonitor:# Detailed app performance data extraction from log eventsenable:false# Should app performance data be extracted from log events?appNameLookup:# Should app names be looked up based on app IDs?enable:falsetrackRejectedEvents:enable:false# Should events that are rejected by the app performance monitor be tracked?tags:# Tags are added to the data before it's stored in InfluxDB# - name: env# value: DEV# - name: foo# value: barmonitorFilter:# What objects should be monitored? Entire apps or just specific object(s) within some specific app(s)?# Two kinds of monitoring can be done:# 1) Monitor all apps, except those listed for exclusion. This is defined in the allApps section.# 2) Monitor only specific apps. This is defined in the appSpecific section.# An event will be accepted if it matches any of the rules in the allApps section OR any of the rules in the appSpecific section.allApps:enable:false# Should all apps be monitored?appExclude:# What apps should be excluded from monitoring?# If both appId and appName are specified, both must match the event's data for it to be considered a match.# - appId: 5b817efe-472d-43ce-8a31-6cce34af7de9# - appName: Sales forecast# - appId: f42d6b16-8faf-45ca-a783-59f9da47db6e# appName: Inventory analysisobjectType:allObjectTypes:true# Should all object types be monitored?allObjectTypesExclude:# If allObjectTypes is set to true, the object types in this array are excluded from monitoring.# someObjectTypesInclude (below) is ignored in that case.# - LoadModelList# - <Unknown># - linechart# - mapsomeObjectTypesInclude:# What object types should be included in monitoring?# Only applicable if allObjectTypes is set to false.# - LoadModelList# - sheet# - barchartmethod:allMethods:true# Should all methods be monitored?allMethodsExclude:# If allMethods is set to true, the methods in this array are excluded from monitoring.# someMethodsInclude (below) is ignored in that case.# - Global::OpenApp# - Doc::GetAppLayout# - Doc::CreateSessionObjectsomeMethodsInclude:# What methods should be included in monitoring?# Only applicable if allMethods is set to false.# - GenericObject::GetLayout# - GenericObject::GetHyperCubeContinuousDataappSpecific:enable:false# Should app specific monitoring be done?app:- include:# What apps should be monitored?# If both appId and appName are specified, both must match the event's data for it to be considered a match.# - appId: d7cf16f9-6a95-462a-9ff1-a6d413326de4# - appName: Budget 2025# - appId: 6931136d-c234-4358-a40c-e37153aba7c9# appName: Sales basket analysisobjectType:allObjectTypes:true# Should all object types be monitored?allObjectTypesExclude:# If allObjectTypes is set to true, the object types in this array are excluded from monitoring.# someObjectTypesInclude (below) is ignored in that case.# - table# - mapsomeObjectTypesInclude:# What object types should be included in monitoring?# Only applicable if allObjectTypes is set to false.# - sheet# - barchart# - linechart# - mapappObject:allAppObjects:true# Should all app objects be monitored?allAppObjectsExclude:# If allAppObjects is set to true, the app objects in this array are excluded from monitoring.# someAppObjectsInclude (below) is ignored in that case.# - objectId: AaBbCc# - objectId: DdEeFfsomeAppObjectsInclude:# What app objects should be included in monitoring?# Only applicable if allAppObjects is set to false.# - objectId: YJEpPTmethod:allMethods:true# Should all methods be monitored?allMethodsExclude:# If allMethods is set to true, the methods in this array are excluded from monitoring.# someMethodsInclude (below) is ignored in that case.# - Global::OpenApp# - Doc::GetAppLayout# - Doc::CreateSessionObjectsomeMethodsInclude:# What methods should be included in monitoring?# Only applicable if allMethods is set to false.# - GenericObject::GetLayout# - GenericObject::GetHyperCubeContinuousData......
Log appender XML files
Sample log appender files are available in the ZIP file available from the download page, in subfolders engine/proxy/repository/scheduler of config/log_appender_xml/ folder.
Note that the log appender files contain slightly different information for each Sense service (engine/proxy/repository/scheduler)!
Also keep in mind that the log appender files must be called LocalLogConfig.xml and placed in these directories on the all Sense servers:
C:\ProgramData\Qlik\Sense\Engine
C:\ProgramData\Qlik\Sense\Proxy
C:\ProgramData\Qlik\Sense\Repository
C:\ProgramData\Qlik\Sense\Scheduler
Tip
If you have more than one Sense server you strictly speaking don’t have to deploy log appenders to all servers.
If you are only interested in receiving log events from some servers and/or services (engine, proxy, repository, scheduler) - deploy the log appender files there.
2.3.10 - Configuring the log database
Warning
Support for Qlik Sense log db was removed in Butler SOS version 11.0.0.
It’s recommended to use log events instead, they provide a more flexible and scalable way to capture log events from Qlik Sense.
What’s this?
Up until mid 2021 Qlik Sense Enterprise on Windows included a logging database to which log events were sent.
It was removed from the product due to mainly performance reasons - it could be difficult to scale properly for large Sense clusters.
Butler SOS offers a replacement for log db, in the form of log events.
2.3.11 - Connecting to a Qlik Sense server
Details on how to configure the connection from Butler SOS to Qlik Sense Enterprise on Windows.
Mandatory
These settings are mandatory.
They must exist in the config file and be correctly set for Butler SOS to work.
What’s this?
In order to interact with a Qlik Sense Enterprise on Windows (QSEoW) environment, Butler SOS needs to know a few things about that environment. This is true no matter if the Sense cluster consists of a single Sense server or many.
Settings in main config file
---Butler-SOS:......# Certificates to use when connecting to Sense. Get these from the Certificate Export in QMC.cert:clientCert:<path/to/cert/client.pem>clientCertKey:<path/to/cert/client_key.pem>clientCertCA:<path/to/cert/root.pem>clientCertPassphrase:<certificate key password, if one was specified when exporting certificates from Sense QMC ># If running Butler in a Docker container, the cert paths MUST be the following# clientCert: /nodeapp/config/certificate/client.pem# clientCertKey: /nodeapp/config/certificate/client_key.pem# clientCertCA: /nodeapp/config/certificate/root.pem# clientCertPassphrase: ......
Qlik Sense certificates
Butler SOS uses certificates to authenticate with Qlik Sense.
These certificates must be exported from the Qlik Management Console (QMC).
To export certificates you need to provide a few pieces of information:
The IP or full host name that Butler SOS’ will use when calling Butler SOS APIs.
For example, if Butler SOS get data from server1.my.domain (i.e. the config setting Butler.serverToMonitor.server.host is set to server1.my.domain), the value server1.my.domain should be entered as “machine name” when exporting the certificates from the QMC.
You only need to export certificate from one server in multi-server Sense clusters. The exported certificate can be used to access and get data from any server in the cluster.
Butler SOS can handle certificates with or without password protection. If you choose to use a password, you must enter that password in the Butler SOS config file.
Check the “Include secret key” check box.
Export certificates in PEM format.
Then click the “Export certificates” button. If all goes well the certificates are now exported to a folder on the Sense server to which you are connected (i.e. the server hosting the virtual proxy you are connected to):
Butler SOS can use MQTT as a channel for pub-sub style M2M (machine to machine) messages. This page describes how to configure MQTT in Butler SOS.
Optional
These settings are optional.
If you don’t need the MQTT feature, just disable it and leave the default values in the config as they are.
Do note though that Butler expects the configuration properties below to exist in the config file, but will ignore their values if the related features are disabled.
What’s this?
MQTT is a light weight messaging protocol based on a publish-subscribe metaphor. It is widely used in Internet of Things and telecom sectors.
MQTT has features such as guaranteed delivery of messages, which makes it very useful for communicating between Sense and both up- and downstream source/destination systems.
Butler SOS can be configured to forward various metrics and events from Sense as MQTT messages. In order to do so, some shared configuration needs to be in place first. This section covers that configuration.
Specifically, a MQTT broker/gateway has to be configured. All MQTT messages from Butler SOS will be sent to this broker.
Settings in main config file
Butler-SOS:......# MQTT config parametersmqttConfig:enable:false# Items below are mandatory if mqttConfig.enable=truebrokerHost:<IP of MQTT broker/server>brokerPort:1883baseTopic:butler-sos/ # Default topic used if not not otherwise specified elsewhere. Should end with /......
2.3.13 - Setting up the New Relic integration
Butler SOS can send metrics and events to New Relic.
This way it’s possible use their SaaS solution for storing and visualizing Butler SOS data.
Optional
These settings are optional.
If you don’t need the New Relic feature, just disable it and leave the default values in the config as they are.
Do note though that Butler expects the configuration properties below to exist in the config file, but will ignore their values if the related features are disabled.
What’s this?
New Relic offers a suite of online/SaaS products that collectively form a very complete observability stack.
From a Butler SOS perspective the interesting parts are metrics, event and log handling.
By forwarding such data to New Relic it’s not necessary to run local InfluxDB and Grafana instances.
That said, New Relic is a commercial service and while their free tier is very generous, there will be a trade-off between a local/lower cost InfluxDB/Grafana setup and using New Relic.
With InfluxDB/Grafana you also get more fine grained control over both data storage and visualizations, while New Relic offer ease of setup and no need to host InfluxDB/Grafana yourself.
Below the settings for sending Qlik Sense health metrics to New Relic are described.
Tagging of data
The following attributes (which is New Relic lingo for tags) are added.
Note: Attributes defined further down in the list will overwrite already defined attributes if their names match.
To avoid problems you should make sure not to use already defined attributes.
Tags for Qlik Sense health metrics
Static attributes defined in the config file’s Butler-SOS.newRelic.metric.attribute.static section.
Dynamic attributes
butlerSosVersion: Butler SOS version
Dynamic attributes based on whether each item in Butler-SOS.newRelic.metric.dynamic section is enabled/disabled.
If Butler-SOS.newRelic.metric.dynamic.engine.memory section is enabled
qs_memCommited
qs_memAllocated
qs_memFree
If Butler-SOS.newRelic.metric.dynamic.engine.cpu section is enabled
qs_cpuTotal
If Butler-SOS.newRelic.metric.dynamic.engine.calls section is enabled
qs_engineCalls
If Butler-SOS.newRelic.metric.dynamic.engine.selections section is enabled
qs_engineSelections
If Butler-SOS.newRelic.metric.dynamic.engine.sessions section is enabled
qs_engineSessionsActive
qs_engineSessionsTotal
If Butler-SOS.newRelic.metric.dynamic.engine.users section is enabled
qs_engineUsersActive
qs_engineUsersTotal
If Butler-SOS.newRelic.metric.dynamic.engine.saturated section is enabled
qs_engineSaturated
If Butler-SOS.newRelic.metric.dynamic.apps.docCount section is enabled
qs_docsActiveCount
qs_docsLoadedCount
qs_docsInMemoryCount
If Butler-SOS.newRelic.metric.dynamic.cache.cache section is enabled
qs_cacheHits
qs_cacheLookups
qs_cacheaAdded
qs_cacheReplaced
qs_cacheBytesAdded
Tags for Qlik Sense proxy session metrics
If and how Butler SOS should extract proxy session metrics is controlled in the Butler-SOS.userSessions section of the config file.
Static attributes defined in the config file’s Butler-SOS.newRelic.metric.attribute.static section.
Dynamic attributes
butlerSosVersion: Butler SOS version
Settings in main config file
Butler-SOS:......# New Relic config# If enabled, select Butler SOS metrics will be sent to New Relic.newRelic:enable:falseevent:# There are different URLs depending on whther you have an EU or US region New Relic account.# The available URLs are listed here: https://docs.newrelic.com/docs/accounts/accounts-billing/account-setup/choose-your-data-center/## Note that the URL path should *not* be included in the url setting below!# As of this writing the valid options are# https://insights-collector.eu01.nr-data.net# https://insights-collector.newrelic.comurl:https://insights-collector.eu01.nr-data.netheader:# Custom http headers- name:X-My-Headervalue:Header valueattribute:static:# Static attributes/dimensions to attach to the events sent to New Relic.- name:servicevalue:butler-sos- name:environmentvalue:proddynamic:butlerSosVersion:enable:true# Should the Butler SOS version be included in the events sent to New Relic?metric:destinationAccount:- First NR account- Second NR account# There are different URLs depending on whther you have an EU or US region New Relic account.# The available URLs are listed here: https://docs.newrelic.com/docs/accounts/accounts-billing/account-setup/choose-your-data-center/# As of this writing the options for the New Relic metrics API are# https://insights-collector.eu01.nr-data.net/metric/v1# https://metric-api.newrelic.com/metric/v1url:https://insights-collector.eu01.nr-data.net/metric/v1 # Where should uptime data be sent?header:# Custom http headers- name:X-My-Headervalue:Header valuedynamic:engine:memory:# Engine RAM (free/committed/allocated).enable:truecpu:# Engine CPU.enable:truecalls:# Total number of requests made to the engine.enable:trueselections:# Total number of selections made to the engine.enable:truesessions:# Engine session metrics (active and total number of engine sessions).enable:trueusers:# Engine user metrics (active and total number of users in engine.enable:truesaturated:# Engine saturation status (tracks whether engine has high or low load).enable:trueapps:docCount:enable:truecache:cache:# Cache metrics.enable:trueproxy:sessions:# Session metrics as reported by the Sense proxy serviceenable:trueattribute:static:# Static attributes/dimensions to attach to the data sent to New Relic.- name:servicevalue:butler-sos- name:environmentvalue:proddynamic:butlerSosVersion:enable:true# Should the Butler SOS version be included in the data sent to New Relic?......
2.3.14 - Setting up Prometheus
Butler SOS can store metrics in Prometheus.
Optional
These settings are optional.
If you don’t need the Prometheus feature, just disable it and leave the default values in the config as they are.
Do note though that Butler expects the configuration properties below to exist in the config file, but will ignore their values if the related features are disabled.
What’s this?
Prometheus is the de-facto standard, open source tool for achieving observability of both small, large and huge IT systems.
At its heart Prometheus contains a time-series database optimized for storing various kinds of measurements. It has strong support for doing dimensional queries, great integrations with incident management tools and more.
Looking at the visualization side of things, Prometheus is Grafana’s preferred source for time-series data. Put differently, Prometheus has some query features that InfluxDB lack, thus making some Grafana diagrams easier to create using Prometheus vs InfluxDB. The difference is minor though.
Settings in main config file
Butler-SOS:......# Prometheus config# If enabled, select Butler SOS metrics will be exposed on a Prometheus compatible URL from where they can be scraped.prometheus:enable:false# Default falsehost:<IP or FQDN where Butler SOS is running> # On what IP/FQDN should the Prometheus metrics be exposed? Default 0.0.0.0, i.e. all available IPsport:9842......
2.3.15 - Setting up InfluxDB time series database
Butler SOS can store metrics in InfluxDB.
Optional
These settings are optional, but highly recommended.
In theory you can use Butler SOS to pull metrics from Qlik Sense and then forward the metrics as MQTT messages, not storing the data in InfluxDB (no Grafana dashboards then!).
By far the most common use case is to store the metrics in InfluxDB.
If you already have Prometheus deployed you can use it instead of Grafana, see the Prometheus config page.
Using InfluxDB is enabled by default in the config file.
Warning
Butler SOS supports InfluxDB 1.x and 2.x.
There are reports that InfluxDB’s cloud product also works with Butler SOS, that has however not been tested by the Butler SOS team.
Version 3 (in beta at the time of this writing) is not supported.
What’s this?
InfluxDB is a time series database. This means it is optimized for storing data that’s somehow linked to a timestamp.
Measurements and metrics are some of the most obvious kinds of data for which InfluxDB was created.
Butler SOS stores data in InfluxDB in full detail, i.e. Butler SOS doesn’t do any aggregation of older data points.
This has a few consequences:
If you are monitoring many Sense servers and/or query Sense for health metrics very frequently and/or have a long InfluxDB retention policy (many months or even years) you will eventually end up with lots of data.
You should ask yourself how far back you need to look at operational data such as the one collected by Butler SOS. In most cases 30 or 45 days history will be more than enough. 10-14 days are usually a good starting point. Use the Butler-SOS.influxdbConfig.retentionPolicy section of the config file to create a retention policy for Butler SOS.
If you need longer history you should consider using InfluxDB’s excellent aggregation features. These can assist in aggregating older data points, with the effect that you can then keep virtually unlimited history. The older data will not be as detailed (fewer samples per time period) - but you will still have an averaged view of what the history looked like.
Note 1: Instructions for how to aggregate old data is beyond the scope of this documentation.
Note 2: The retention policy specified in the config file will only be created if the InfluxDB database specified in the config file does NOT exist when Butler SOS is started.
I.e. if you store data to an existing InfluxDB database, the retention policy will not be created.
Settings in main config file
Butler-SOS:......# Influx db config parametersinfluxdbConfig:enable:true# Items below are mandatory if influxdbConfig.enable=truehost:influxdb.mycompany.com # InfluxDB host, hostname, FQDN or IP addressport:8086# Port where InfluxDBdb is listening, usually 8086version:1# Is the InfluxDB instance version 1.x or 2.x? Valid values are 1 or 2v2Config:# Settings for InfluxDB v2.x only, i.e. Butler-SOS.influxdbConfig.version=2org:myorgbucket:mybucketdescription:Butler SOS metricstoken:mytokenretentionDuration:10dv1Config:# Settings below are for InfluxDB v1.x only, i.e. Butler-SOS.influxdbConfig.version=1auth:enable:false# Does influxdb instance require authentication (true/false)?username:<username> # Username for Influxdb authentication. Mandatory if auth.enable=truepassword:<password> # Password for Influxdb authentication. Mandatory if auth.enable=truedbName:SenseOps# Default retention policy that should be created in InfluxDB when Butler SOS creates a new database there.# Any data older than retention policy threshold will be purged from InfluxDB.retentionPolicy:name:10dduration: 10d # Possible duration units here:https://docs.influxdata.com/influxdb/v1.8/query_language/spec/#durations# Control whether certain metrics are stored in InfluxDB or not# Use with caution! Enabling activeDocs, loadedDocs or inMemoryDocs may result in lots of data sent to InfluxDB.includeFields:activeDocs:false# Should data on what docs are active be stored in Influxdb (true/false)?loadedDocs:false# Should data on what docs are loaded be stored in Influxdb (true/false)?inMemoryDocs:false# Should data on what docs are in memory be stored in Influxdb (true/false)?......
2.3.16 - Configuring extraction of app names from Qlik Sense
Optional
These settings are optional.
If you don’t do anything app name extraction is turned on by default.
What’s this?
Qlik Sense’s APIs return all its app metrics relative to an app ID, not the app name.
This is fine as the ID is guaranteed to be unique, but the downside is that the ID doesn’t tell us humans much.
Butler SOS therefore provides an app ID-to-app name mapping with a configurable update interval.
The Butler-SOS.appNames section of the config file controls if this mapping should be done at all, how often and which Sense server should be used to get it.
If an app ID for some reason can’t be mapped to an app name, Butler SOS will use the app ID as the app name.
A more comprehensive description of Butler SOS’ strategy for getting correct names of Sense apps is available in the Concepts section.
Settings in main config file
Butler-SOS:......# Extract app namesappNames:enableAppNameExtract:true# Extract app names in addition to app IDs (tue/false)?extractInterval:60000# How often (milliseconds) should app names be extracted?hostIP:<IP or FQDN> # What Sense server should be queried for app names?......
Setting anonTelemetry to true enables telemetry, setting it to false disables telemetry.
2.3.17 - Configuring user sessions
Optional
These settings are optional.
If you don’t do anything user session metrics are turned on by default.
What’s this?
A description of what user sessions are is available in the Concepts section.
Detailed user session metrics are retrieved for all virtual proxies specified in the Butler-SOS.serversToMonitor.servers[].userSessions.VirtualProxies[] array.
In other words: For each monitored Sense server it is possible to specify which of the server’s proxy service’s virtual proxies should be monitored with respect to per-user session metrics.
Right, that’s a long sentence…
Let’s try again: For each monitored Sense server, decide which virtual proxies should be monitored.
Enter those virtual proxies in the Butler-SOS.serversToMonitor.servers[].userSessions.VirtualProxies[] array for the server in question.
Note
In order to get detailed, per-user and virtual proxy session info you need to
Configure the Butler-SOS.userSessions section of the config file with general parameters about how often sessions should be polled, user blacklist etc.
Don’t forget to set Butler-SOS.userSessions.enableSessionExtract to true.
For each server then set Butler-SOS.serversToMonitor.servers[].userSessions.enable to true and specify which virtual proxies should be monitored.
You will only get user session info if you configure both the points above.
Being a template, it contains examples on how configuration may be done - not necessarily how it should be done.
For example, the LAB/testuser1 and LAB/testuser2 user are optional and can be changed to something else, or removed all together if not used.
Butler-SOS:......# Sessions per virtual proxyuserSessions:enableSessionExtract:true# Query unique user IDs of what users have sessions open (true/false)?# Items below are mandatory if enableSessionExtract=true pollingInterval:30000# How often (milliseconds) should session data be polled?excludeUser:# Optional blacklist of users that should be disregarded when it comes to session monitoring.# Blacklist is only applied to data in InfluxDB. All session data will be sent to MQTT.- directory:LABuserId:testuser1- directory:LABuserId:testuser2......
2.3.18 - Configure which Sense servers to monitor
Mandatory
These settings are mandatory.
They must exist in the config file and be correctly set for Butler SOS to work.
What’s this?
This part of the config file contains information on what Sense servers should be monitored and details about those servers.
Note that there is a dependency to the Butler-SOS.userSessions section. Please see the Configuring user sessions page for more info.
Tags
It’s possible to define server specific tags that will be stored together with the Sense metrics in InfluxDB.
The tags can then be used when creating Grafana dashboards, for example to distinguish between DEV, TEST and PROD servers, where servers are located physically etc.
You can define zero or more tags in the Butler-SOS.serversToMonitor.serverTagsDefinition section.
Those tags are then given values for each server.
If a tag is defined it must in fact be given a value for each server!
If nothing else just set it to an empty string or a hyphen, ‘-’.
Being a template, it contains examples on how configuration may be done - not necessarily how it should be done.
For example, the list serverTagsDefinition is optional and can be changed to something else, or removed all together if not used.
Same thing for the list of servers and virtual proxies. Update them so they match your own Sense environment.
Butler-SOS:......serversToMonitor:pollingInterval:30000# How often (milliseconds) should the healthcheck API be polled?# If false, Butler SOS will accept TLS certificates on the server without verifying them with the CA. # If true, data will only be retrieved from the Sense server if that server's TLS cert verifies # successfuully against the list of CAs available on the computer where Butler SOS is running.rejectUnauthorized:true# List of extra tags for each server. Useful for creating more advanced Grafana dashboards.# Each server below MUST include these tags in its serverTags property.# The tags below are just examples - define your own as needed# These tags will also be used to label data exposed on the Prometheus endpoint (if it is enabled)# NOTE: Prometheus only allows label names consisting of ASCII letters, numbers, as well as underscores. They must match the regex [a-zA-Z_][a-zA-Z0-9_]*. # I.e. if the Prometheus endpoint is enabled, the tag names below must follow the label naming standard of Prometheus. serverTagsDefinition:- server_group- serverLocation- server_type- serverBrand# Sense Servers that should be queried for healthcheck data servers:- host: <server1.my.domain>:4747 # Example:10.34.3.45:4747serverName:<server1>serverDescription:<description>logDbHost:<host name as used in QLogs db>userSessions:enable:true# Items below are mandatory if userSessions.enable=truehost: <server1.my.domain>:4243 # Example:10.34.3.45:4243virtualProxies:- virtualProxy:/ # Default virtual proxy- virtualProxy:/hdr # "hdr" virtual proxy- virtualProxy:/sales # "sales" virtual proxyserverTags:server_group:DEVserverLocation:Asiaserver_type:virtualserverBrand:Dellheaders:X-My-Header-1:Header value 1X-My-Header-2:Header value 2- host: <server2.my.domain>:4747 # Example:10.34.3.46:4747serverName:<server2>serverDescription:<description>logDbHost:<host name as used in QLogs db>userSessions:enable:true# Items below are mandatory if userSessions.enable=truehost: <server2.my.domain>:4243 # Example:10.34.3.46:4243virtualProxies:- virtualProxy:/finance # "finance" virtual proxyserverTags:server_group:PRODserverLocation:Europeserver_type:physicalserverBrand:HPheaders:X-My-Header-1:Header value 3X-My-Header-2:Header value 4......
2.3.19 - Configuring telemetry
Optional
These settings are optional.
If you don’t do anything telemetry is turned on by default.
What’s this?
A description of Butler’s telemetry feature is available here.
Settings in main config file
---Butler:# Logging configuration......anonTelemetry:true# Can Butler SOS send anonymous data about what computer it is running on?# More info on what data is collected: https://butler-sos.ptarmiganlabs.com/docs/about/telemetry/# Please consider leaving this at true - it really helps future development of Butler SOS!......
Setting anonTelemetry to true enables telemetry, setting it to false disables telemetry.
2.4 - Day 2 operations
Options for running Butler SOS.
Running Butler SOS
How to start and keep Butler SOS running varies depending on whether you are using Docker or a native Node.js approach.
Docker
Starting Butler SOS using Docker is easy.
First configure the docker-compose.yml file as needed, then start the Docker container in interactive mode (=with output sent to the screen).
This is useful to ensure everything works as intended when first setting up Butler SOS.
docker-compose up
Once Butler SOS has been verified to work as intended, hit ctrl-c to stop it.
Then start it again in daemon (background) mode:
docker-compose up -d
From here on the Docker environment will make sure Butler SOS is always running, including restarting it if it for some reason stops, when server reboots etc.
Pre-built, standalone binaries
Starting Butler SOS using the pre-built binaries could look like this on Windows:
d:
cd \node\butler-sos
butler-sos.exe --configfile butler-sos-prod.yaml --loglevel info
It is of course also possible to put those commands in a command file (.bat on Windows, .sh etc on other platforms) file and execute that file instead.
As Butler SOS is the kind of service that (probably) should always be running on a server, it makes sense running it as a Windows service (or similar mechanism in Linux).
On Windows you can use the excellent Nssm tool (https://nssm.cc) to achieve this, with all the benefits that follow (the service can be monitored using operations tools, automatic restarts etc).
A step-by-step tutorial for running Butler SOS as a Windows service using NSSM is available over at ptarmiganlabs.com.
Starting Butler SOS as a Node.js on Windows could look like this:
d:
cd \node\butler-sos\src
node butler-sos.js
It is of course also possible to put those commands in a command file (.bat on Windows, .sh etc on other platforms) file and execute that file instead.
Windows services & process monitors
As Butler SOS is the kind of service that (probably) should always be running on a server, it makes sense using a Node.js process monitor to keep it alive (if running Butler SOS as a Docker container you get this for free).
On Windows you can use the excellent Nssm tool (https://nssm.cc) to make Butler SOS run as a Windows Service, with all the benefits that follow (can be monitored using operations tools, automatic restarts etc).
Once Butler SOS is running it’s a good idea to also monitor it. Otherwise you stand the risk of not getting notified if Butler SOS for some reason misbehaves.
Butler SOS will log data on its memory usage to InfluxDB if
The config file’s Butler-SOS.uptimeMonitor.enable and Butler.uptimeMonitor.storeInInfluxdb.butlerSOSMemoryUsage properties are both set to true.
The remaining InfluxDB properties of the config file are correctly configured.
Assuming everything is correctly set up, you can then create a Grafana dashboard showing Butler SOS’ memory use over time.
You can also set up alerts in Grafana with notifications going to most popular IM tools and email.
A Grafana dashboard can look like this. This particular chart is for the Butler tool, but the concept for Butler SOS is the same.
Upgrading Butler SOS to a new version?
Here’s how to do it.
First: Don’t panic
Upgrading Butler SOS is usually a smooth process:
Get the new version from the assets section on the download page. Extract the ZIP file.
Back up your existing Butler SOS configuration file.
Edit the configuration file to match the new version’s requirements.
Stop the Butler SOS process/service.
Replace the Butler SOS binary with the new version.
Start the process/service.
🥳 Celebrate!
Then: The details
Version number hints
Different kind of upgrades (usually) result in different levels on modifications needed in the main config file.
“Small” upgrades move from one patch version to another, without changing the feature version.
Example: Upgrading from 7.3.0 > 7.3.4.
“Medium” upgrades involves moving from one minor version to another, without changing the major version.
Example: Upgrading from 7.2.3 > 7.3.0
“Major” upgrades is when you move to a new major version.
Example: 7.4.2 > 8.0.0
Warning
You should always upgrade to the latest available version.
That version has the latest features, bug fixes and security patches.
Minor upgrades
The new release includes bug fixes, security patches, minor updates to documentation etc - but no new features.
In theory there should never be any changes to the config files when doing a minor upgrade.
Medium upgrades
This scenario means that new features are added to Butler SOS.
Usually there are also various bug fixes included.
Most new features need to be configured somehow, meaning that medium upgrades usually require modification to the config files.
The most common change by far is that it’s the main config file that needs to be modified, but a new scheduler related feature could for example mean that the scheduler config file must be modified too.
The changes needed to the config files are usually additive in nature, i.e. some settings must be added to the config file, but the existing settings and general structure of the file remain the same.
Major upgrades
This scenario involves breaking changes of some kind.
These almost certainly require changes to the config files, sometimes even significant ones in the sense that the structure of the config file may have changed.
If very major rework has been done to Butler SOS, this may also result in a major version bump.
Know your config file
Butler SOS is entirely driven by its YAML-formatted configuration file, with an example file serving as a good starting point.
InfluxDB considerations
Some versions include changes to the InfluxDB schema, meaning that you need to do some manual work in order to upgrade to the new schema.
The easiest way to do this is to delete the InfluxDB database used by Butler SOS, then let Butler SOS re-create it using the new schema.
If the InfluxDB database specified in the Butler SOS config file does not exist, Butler SOS will automatically create it for you.
Deleting the InfluxDB database “senseops” can be done with a command similar to this:
influx --host <ip-where-influxdb-is-running> --port <influxdb-port-usually-8086>
drop database senseops
exit
Upgrade checklist
Info
Butler SOS always checks that the config file has the correct format when starting.
This means that if you forget to add or change some setting in the main YAML config file, Butler SOS will tell you what’s missing and refuse to start.
A consequence of this is that all settings are now mandatory, even if you don’t use them.
Make a backup of your YAML configuration file before upgrading. Just… do it.
Look at the release notes to get a general feeling for what is new and what has changed.
Those are the areas that may require changes in the config file.
Compare your existing main config file with the template config file available on GitHub.
This comparison is a manual process and can be a bit tedious, but knowing your config file is really needed in order to make full and correct use of Butler SOS.
That file is also included in the Butler SOS ZIP file available on the download page.
The result of the comparison will show you what parts of the config file are new (for medium-sized upgrades) and which parts have changed in a significant way (for major upgrades).
Get the binaries for the new Butler SOS version from the download page.
Start the new Butler SOS version and let it run for a few minutes.
Review the console logs (or the log files) to make sure there are no warnings or errors.
If there are warnings or errors it can be helpful to start Butler SOS with more verbose logging.
Adding --log-level verbose or even --log-level debug will give you more details on what Butler SOS is doing and what might be causing the problems you are experiencing.
Finally: When things aren’t working - check the logs
By far the most common problem when upgrading to a new Butler SOS version (or doing a fresh install) is an incorrect config file.
All config entries are mandatory, even if you don’t use them.
This may seem a bit harsh, but this way Butler SOS can tell you exactly what is missing in the config file.
Missing entries are shown in the startup log, like this:
2024-09-02T12:17:33.919Z error: VERIFY CONFIG FILE: Errors found in config file. Exiting.
2024-09-02T12:17:33.920Z error: Tip: Start Butler SOS with --no-config-file-verify option to skip this check and start with provided config file.
2024-09-02T12:17:33.920Z error: /home/goran/code/butler-sos/src/config/production.yaml is not following the correct structure, missing:,Butler-SOS.configVisualisation.enable
In the example above the Butler-SOS.configVisualisation.enable entry is missing.
Adding that entry to the config file should make Butler SOS start.
Butler SOS is pretty good at figuring out what is wrong with the config file, but there may be cases where it’s not obvious what is wrong.
Thus, double check your config file, then triple check it.
Then start Butler SOS and read the logs carefully.
If you need more details, start Butler SOS with the --log-level verbose or even --log-level debug options to get more details on what’s going on.
If things still don’t work you can post a question in the Butler SOS forums.
By sharing your installation and upgrade challenges/issues you enable future improvements, which will benefit both yourself and others.
3 - Concepts
Deep dive into the various components that make up Butler SOS.
3.1 - App metrics
“Apps”, “Applications” or “Documents” - in Qlik lingo they all refer to the same thing.
It’s where data and logic is kept in the Qlik Sense system.
Tip
The use cases page contains related information that may be of interest.
App metrics
When it comes to apps we basically want to track which apps are loaded into the monitored Sense server(s).
In-memory vs loaded vs active apps
Given the caching nature of Qlik Sense, some apps will be actively used by users and some will just be sitting there without any current connections.
Sense group apps into three categories, which are all available in Butler SOS:
Active apps. An app is active when a user is currently performing some action on it.
Loaded apps. An app that is currently loaded into memory and that have open sessions or connections.
In-memory apps. Loaded into memory, but without any open sessions or connections.
Butler SOS keeps track of both app IDs and names of the apps in each of the three categories.
Qlik Sense provides app health info based on app IDs.
I.e. we get a list of what app IDs are active, loaded and in-memory.
That’s all good, except those IDs don’t tell us humans a lot.
We need app names.
We can get those app names by simply asking Sense for a list of app app IDs and names, but there are a couple of challenges here:
This query to Sense may not be complex or expensive if done once, but if we do it several times per minute it will create an unwanted load on the Sense server(s).
There is the risk of an app being deleted between we get health data for it and the following appID-name query. Most apps are reasonably long-lived, but the risk is still there.
Right or wrong, Butler SOS takes this approach to the above:
App name queries are done on a separate schedule. In the main config file you can configure both if app names should even be looked up, and how often that lookup should happen. This puts you in control of how up-to-date app names you need in your Grafana dashboards.
The risk of a temporary mismatch between app IDs and app names in Butler SOS remains, and will even get worse if you query app names infrequently. Still, this is typically a very small problem (if even a problem at all).
3.2 - Sessions & Connections
What are user sessions and why are they important?
Who are using the Sense environment right now?
This is a very basic question a sysadmin will ask over and over again.
This question is answered in great detail by the excellent Operations Monitor app that comes with Qlik Sense out of the box.
But that app gives a retrospective view of the data - it does not provide real-time insights.
Butler SOS focus on the opposite: Give as close to real-time insights as possible into what’s happening in the Sense environment.
User behavior is then an important metric to track, more on this below.
Proxy sessions
A session, or more precisely a proxy session starts when a user logs into Sense and ends when the user logs out or the session inactivity timeout is reached.
There may be some additional corner-case variants, but the above is the basic, high-level definition of a proxy session.
Tip
Some useful lingo: The events that can happen for sessions are that they can start and stop.
They can also timeout if the user is inactive long enough (the exact time depends on settings in the QMC).
As long as a user uses the same web browser and doesn’t use incognito mode or similar, the user will reuse the same session for all access to Sense.
On the other hand: If a user uses different browsers, incognito mode etc, multiple sessions will be registered for the user in question. There is a limit to how many sessions a user can have at any given time.
Mashups and similar scenarios where Sense objects are embedded into web apps may result in multiple sessions being created. Whether or not this happens largely depends on how the mashup was created.
A good overview of what constitutes a session is found here.
Proxy session vs engine sessions
The proxy service is responsible for handling users connecting to Qlik Sense.
When a user connects a proxy session is created - assuming the user has permissions to access Sense.
When interacting with individual charts in a Sense app, engine sessions are used to interact with the engine service.
A user typically thus have one (or a few) proxy session and then a larger number of transient engine sessions.
A user may open more than one connection within a session.
A connection is opened when the user opens an app in a browser tab, or when a user opens a mashup which in turn triggers a connection to a Sense app to be set up.
Closing the browser tab will close the connection.
Tip
Some useful lingo: The events that can happen for connections are that they can be opened and closed.
User events
Butler SOS offers a way to monitor individual session and connection events, as they happen.
This is done by Butler SOS hooking into the logging framework of Qlik Sense, which will notify Butler SOS when users start/stop sessions or connections are being open/closed.
The concept is identical to how Butler SOS gets metrics and log events from Sense.
A blacklist in the main config file provides a way to exclude some users (e.g. system accounts) from the user event monitoring.
Configuration of user events monitoring is done in the main config file’s Butler-SOS.userEvents section.
A step-by-step instruction for setting up user event monitoring is available in the Getting started section.
More info about the config file is available here.
On an aggregated level this information is useful to understand how often users log in/out, when peak ours are etc.
On a detailed level this information is extremely useful when trying to understand which users had active sessions when some error occurred.
Think investigations such as “who caused that 250 GB drop in RAM we were just alerted about?”.
3.3 - Log events
3.3.1 - Log events overview
Butler SOS can capture very detailed information about individual charts in apps - or just the high-level information about the apps themselves.
This page explains the different levels of engine performance data that Butler SOS can provide.
Three levels of log event data
Depending on the needs of the Sense admin, Butler SOS can provide three levels of log event data, ranging from high-level counters to detailed performance data for individual charts in apps.
The most high-level data is the “log event counters”, which can be enabled/disabled independently of the more detailed engine performance events.
The engine performance events are then divided into “rejected” and “accepted” events, with the latter being the most detailed.
It’s usually a good idea to start with the high-level metrics and then enable more detailed metrics if needed.
Info
The counters for top-level metrics and rejected performance log events are reset to zero every time Butler SOS is restarted, as well as every time counter data is sent to InfluxDB.
I.e. the counters are not cumulative over time, but rather show the number of events since the last restart/save.
This makes it easy to create Grafana dashboards that show the number of events during the selected time interval, for example.
Just sum the counter fields in the Grafana chart, and you’re done.
High level: Event counters
Event counters can be enabled independently of engine performance events.
The counters are configured in the Butler-SOS.qlikSenseEvents.eventCount section in the Butler SOS config file.
When enabled, Butler SOS will count the number of log and user events that are received from Qlik Sense via UDP messages.
The counters are split across several dimensions, described in the reference section.
These counters can be used to get a general idea of which servers generate the most log events, which Windows services generate the most events, and so on.
A Grafana dashboard can look like this:
Butler SOS event counter charts in Grafana.
Medium: Rejected performance log events
If an event with source=qseow-qix-perfdoes not meet the include filter criteria in the config file, it is considered a “rejected” event.
For rejected events a set of counters are kept, broken down by dimensions described in the reference section.
As both app id/name and the engine method (for example Global::OpenApp) are included as a dimension in the InfluxDB data, it’s possible to create Grafana dashboards that show how long time each app takes to open.
A Grafana dashboard can look like this:
Butler SOS rejected performance log events dashboard in Grafana.
In the upper right chart above we can see that all apps except one open quickly.
Might be a good idea to investigate why the app “Training - Field indexing DEV” takes so long to open.
If an event with source=qseow-qix-perfdoes meet the include filter criteria in the config file, it is considered an “accepted” event.
All accepted events will result in a set of detailed performance metrics being stored in InfluxDB.
The metrics are described in the reference section.
An example Grafana dashboard can look like this:
Butler SOS accepted performance log events dashboard in Grafana.
The upper left chart shows total “work time” per app, during the selected time interval.
Work time is the time it takes for the engine to do the actual work, like calculating the chart data after a selection is made by the user.
The chart shows that the app “Training - Field indexing” has a high work time.
This does not have to be a problem, but it’s worth investigating why the number is so high.
The bottom two charts show the work time per chart object, per app.
The chart tells us that two app objects take on the order of 5 seconds each to calculate.
Which objects are these?
Open the app in Chrome and use the “Add Sense for Chrome” extension to find out.
Turns out it’s the two tables (object 10 and 11) that take a long time to update - that’s expected (but not ideal!) as they contain a lot of complex data that takes time to index.
If the update times get even longer, it might be a good idea to look into the data model and see if it can be optimized.
The "Add Sense for Chrome" extension showing the object ID for objects on a sheet.
3.3.2 - Errors & Warnings
Warnings lead to errors.
Errors lead to unhappy users.
Unhappy users call you.
Wouldn’t you rather get the warnings yourself, before anyone else?
Sense log events
Sense creates a large number of log files for the various parts of the larger Qlik Sense Enterprise environment.
Those logs track more or less everything - from extensions being installed, users logging in, to incorrect structure of Active Directory user directories.
Butler SOS monitors select parts of these logs and provides a way to get an aggregated, close to real-time view into warnings and errors.
Butler SOS stores the log events in InfluxDB together with all other metrics.
It is therefore possible to create Grafana dashboards that combine both operational metrics (apps, sessions, server RAM/CPU etc) with warning and error related charts and tables.
Showing warnings and errors visually is often an effective way to quickly identify developing or recurring issues.
Example 1: Circular Active Directory references
Here is an example where bursts of warnings tell us visually that something is not quite right.
50-60 warnings arriving in bursts every few minutes - something is not right.
There is also a single error during this time period - what’s going on there?
We can then look at the actual warnings (=log events) to see what’s going on.
In this case it turns out to be circular references in the Active Directory data used in Qlik Sense. Not a problem with Sense per se, but still something worth looking into:
Looking at that single error then, it turns out it’s caused by a task already running when it was scheduled to start:
Example 2: Session bursts causing proxy overload
This example is would have been hard or impossible to investigate without Butler SOS.
The problem was that the Sense environment from time to time became very slow or even unresponsive. A restart solved the problem.
Grafana was set up to send alerts when session count increase very rapidly. Thanks to this actions could be taken within minutes from the incident occurring.
Looking in the Grafana dashboard could then show something like below.
New sessions started every few seconds, all coming from a single client. The effect for this Sense user was that Sense was unresponsive.
The log events section of the Grafana dashboard showed that this user had been given 5 proxy sessions, after which further access to Sense internal resources (engine etc) was denied.
In this case the problem was caused by a mashup using iframes that when recovering from session timeouts caused race conditions, trying to re-establish a session to Sense over and over again.
Alerts
Both New Relic and Grafana includes a set of built-in alert features that can be used to set up alerts as well as forward them to destinations such as Slack, MS Teams, email, Discord, Kafka, Webhooks, PagerDuty and others.
More info about Grafana alerts here.
New Relic alerts described here.
3.3.3 - Getting rid of Sense log noise
Let’s say Butler SOS is configured to receive log events from Qlik Sense Enterprise, specifically warnings and errors.
In the best of worlds there will be few such events, but in reality there are usually more than expected. It’s not uncommon for a Sense cluster to generate hundreds or even thousands of error and warning events per hour.
By categorizing these events, Butler SOS can help you focus on the most important ones, and ignore the rest.
What kind of log events are there?
Log events originate from the Qlik Sense logging framework, which is called Log4Net.
The framework is responsible for logging things to Qlik Sense’s own log files, but can also be extended in various ways - for example by sending log events as UDP messages to Butler SOS.
This is done by deploying XML files in well defined folders on the Sense servers, these files are called “log appender files”.
Log4Net assigns a log level to all log events, these are on of the following: DEBUG, INFO, WARN, ERROR and FATAL.
The log appender files that ship with Butler SOS are configured to send WARN and ERROR events to Butler SOS, from the repository, proxy, engine, and scheduler services in Qlik Sense.
So, what Butler SOS receives is a stream of log events, with a log level of either WARN or ERROR, from the repository, proxy, engine, and scheduler services in Qlik Sense.
That’s all fine, but it’s not uncommon for a Sense cluster to generate way more warnings and errors than expected by the Sense admin person.
The challenge then becomes to focus on the most important events, and ignore the rest.
How to categorize log events
Let’s say there are 1000 log events per hour.
When looking at the log events, it turns out that 95% of them are either about
people getting https certificate warnings when accessing the Qlik Sense Hub…
…people getting access denied errors when trying to open an app…
…or that Sense has detected something unusual (like a circular reference) in an Active Directory user directory.
Those events are not good, but they are not critical either.
They are things that can be fixed in a controlled way, and they won’t bring the Sense cluster to its knees.
But there may also be a few log events that are related to the Sense central node not being able to connect to one of the rim nodes.
Maybe the events occur at irregular intervals and therefore more difficult to detect.
These events are critical, and should be investigated immediately.
If Butler SOS is configured to categorize the certificate warnings as “user-certificate, the Active Directory warnings as “active-directory” and the access-denied warnings as “access-denied”, that information is then added as tags to the event data that is stored in InfluxDB.
This means that when creating Grafana dashboards, it’s possible to create a table that show the number of “user-certificate” events and the number of “active-directory” events - and the number of “other” events.
Another Grafana panel can show detailed event info for the “other” events, making it easy to investigate what they are about.
By categorizing log events it is possible to get rid of the log noise that hides the important events.
Sample Grafana dashboard
A few charts and tables give a good overview of the log events.
Butler SOS log events dashboard in Grafana. Uncategorized events by the yellow arrows, and in table/charts to the right.
Butler SOS Configuration
The following settings in the Butler SOS config file were used to categorize the log events that were used in the Grafana dashboard above.
Butler-SOS:......# Log events are used to capture Sense warnings, errors and fatals in real timelogEvents:udpServerConfig:serverHost:0.0.0.0# Host/IP where log event server will listen for events from SenseportLogEvents:9996# Port on which log event server will listen for events from Sensetags:- name:envvalue:DEV- name:foovalue:barsource:engine:enable:true# Should log events from the engine service be handled?proxy:enable:true# Should log events from the proxy service be handled?repository:enable:true# Should log events from the repository service be handled?scheduler:enable:true# Should log events from the scheduler service be handled?qixPerf:enable:true# Should log events relating to QIX performance be handled?categorise:# Take actions on log events based on their contentenable:truerules:# Rules are used to match log events to filters- description:Find access denied errorslogLevel:# Log events of this Log level will be matched. WARN, ERROR, FATAL. Case insensitive.- WARN- ERRORaction:categorise # Action to take on matched log events. Possible values are categorise, dropcategory:# Category to assign to matched log events. Name/value pairs.# Will be added to InfluxDB datapoints as tags.- name:qs_log_categoryvalue:access-deniedfilter:# Filter used to match log events. Case sensitive.- type:sw # Type of filter. sw = starts with, ew = ends with, so = substring ofvalue:"Access was denied for User:"- type:sovalue:was denied for User- description:Find AD issueslogLevel:# Log events of this Log level will be matched. WARN, ERROR, FATAL. Case insensitive.- ERROR- WARNaction:categorise # Action to take on matched log events. Possible values are categorise, dropcategory:# Category to assign to matched log events. Name/value pairs.# Will be added to InfluxDB datapoints as tags.- name:qs_log_categoryvalue:user-directoryfilter:# Filter used to match log events. Case sensitive.- type:sw # Type of filter. sw = starts with, ew = ends with, so = substring ofvalue:Duplicate entity with userId- description:Qlik Sense service downlogLevel:# Log events of this Log level will be matched. WARN, ERROR, FATAL. Case insensitive.- WARNaction:categorise # Action to take on matched log events. Possible values are categorise, dropcategory:# Category to assign to matched log events. Name/value pairs.# Will be added to InfluxDB datapoints as tags.- name:qs_log_categoryvalue:qs-servicefilter:# Filter used to match log events. Case sensitive.- type:sw # Type of filter. sw = starts with, ew = ends with, so = substring ofvalue:Failed to request service alive response from- type:so # Type of filter. sw = starts with, ew = ends with, so = substring ofvalue:Unable to connect to the remote server- description:Reload task failedlogLevel:# Log events of this Log level will be matched. WARN, ERROR, FATAL. Case insensitive.- WARN- ERRORaction:categorise # Action to take on matched log events. Possible values are categorise, dropcategory:# Category to assign to matched log events. Name/value pairs.# Will be added to InfluxDB datapoints as tags.- name:qs_log_categoryvalue:reload-failedfilter:# Filter used to match log events. Case sensitive.- type:sw # Type of filter. sw = starts with, ew = ends with, so = substring ofvalue:Task finished with state FinishedFail- type:sw # Type of filter. sw = starts with, ew = ends with, so = substring ofvalue:Task finished with state Error- type:ew # Type of filter. sw = starts with, ew = ends with, so = substring ofvalue:Reload failed in Engine. Check engine or script logs.- type:sw # Type of filter. sw = starts with, ew = ends with, so = substring ofvalue:Reload sequence was not successful (Result=False, Finished=True, Aborted=False) for engine connection with handleruleDefault:# Default rule to use if no other rules match the log eventenable:truecategory:- name:qs_log_categoryvalue:unknown
3.3.4 - App performance monitoring
Users complain about an app being slow to open.
Or that a certain chart is slow to update.
Butler SOS can help you understand what’s going on by providing very detailed, real-time performance metrics for all apps or just a few.
For all charts or just some.
Knowing is better than guessing
Monitoring a Qlik Sense environment - or any system - comes down to knowing what’s going on.
If you don’t know what’s going on, you’re guessing.
And if you’re guessing, you’re not in control.
If you’re not in control, well - that’s a bad place to be..
Qlik’s performance analysis apps
Qlik has a couple of apps that can be used to analyze performance data from Qlik Sense Enterprise on Windows.
First, the Operations Monitor app ships with every instance of Qlik Sense Enterprise on Windows.
This app is the go-to tool for retrospective analysis of what’s going on in a Sense environment.
The app puts all the great features of Qlik Sense to good use on top of the Sense logs it has access to.
What apps were reloaded when, which reload tasks failed most, which users are most active, etc.
Then there’s the Telemetry Dashboard app.
It uses the same data as Butler SOS, but as it’s a Sense app it must be reloaded in order to get updated data.
Butler SOS on the other hand uses real-time delivery of the events from Sense’s Log4Net logging framework.
If you want to do retrospective analysis of detailed performance data, the Telemetry Dashboard app is an excellent choice.
This page provides additional info about the telemetry logging available in Qlik Sense.
Info
Qlik’s Telemetry Dashboard app requires you to enable performance logging for the Engine service in the QMC.
The effect is that you get a new set of Sense log files that are likely to quickly become BIG.
By using Butler SOS you can get the same metrics and insights, but without the need to enable performance logging in the QMC.
I.e. saving disk space and getting real-time data instead of data that’s hours or days old.
Which is better? That depends on your use case and what you want to achieve.
Lots of use cases
Categorization of events can be done in different ways depending on what you want to achieve.
Here are some examples of what can be done using Butler SOS:
You want high level insights into how long various app actions take for all apps.
Turn on engine performance monitoring in general, but no need for app details
Enable tracking of rejected performance log events. This will capture high-level metrics (such as time used and number of events) for all methods/commands used in the engine.
Create a Grafana dashboard that shows the average time taken for each method/command.
🎉 You get immediate, visual insight into how fast (or slow) apps open.
Users complain about an app being slow to open.
Turn on performance logging for app open events from that particular app. Store data in InfluxDB.
Create a Grafana dashboard that shows a histogram of app open times for that app.
🎉 You get hard numbers on how long the app usually takes to often, and what the outliers are.
A certain chart is slow to update.
Turn on performance logging for that specific app and chart. Store data in InfluxDB.
Create a Grafana dashboard that shows a histogram of chart update times for that chart. Or add a new chart to an existing dashboard.
Define alerts in Grafana so you get notified if rendering time for the chart exceeds some threshold.
Use Butler SOS’ user events features to keep track of what users access the app when the chart is slow.
🎉 You know in real-time how many and which users were impacted, and get a notification when it happens.
You suspect that an app has a poorly designed data model.
Enable detailed performance monitoring for that specific app
Create a Grafana dashboard that
tracks the “traverse_time” metric. This metric shows how long it takes to traverse the data model. A poorly designed data model tend to have longer traverse times. Break it down by app object and proxy session.
tracks the render time for each chart and table in the app. Slow charts and tables may be caused by a bad data model, but not always. Lots of (complex) data may also be a reason.
🎉 You get real-time insight into which objects are slow for what users, due to a bad data model in that specific app.
Performance log events
A “performance log event” is a log event that originates from the Qlik Sense engine, more specifically from the “QixPerformance.Engine.Engine” subsystem.
They are sent to Butler SOS as UDP messages, just like regular log events (using the same port).
The performance log events have INFO log level in the Sense logs but still provide very detailed information about what the engine is doing.
Warning
The XML appender files that ship with Butler SOS don’t do any filtering of log events.
This means that all events from the “QixPerformance.Engine.Engine” subsystem are sent to Butler SOS, regardless of what they are about.
The filtering is then done (if configured) by Butler SOS.
For large Sense environments, there can therefore be a lot of UDP messages sent to Butler SOS.
This is usually not a problem, but at some point Butler SOS may become overwhelmed and start dropping messages.
Use the log message counter feature in Butler SOS to keep track of how many messages are received - this can be a good indicator of how close Butler SOS is to its limits.
Accepted vs rejected performance log events
Due to the potential high volume of performance log events sent by Qlik Sense, Butler SOS has a filtering feature that can be used to only store the events that are of interest.
Events that meet the filtering criteria are called “accepted” events, and events that don’t are “rejected” events.
Accepted events are stored in InfluxDB, including detailed performance metrics for the event.
Details on what is stored for accepted events can be found in the reference section.
Rejected events are not stored in InfluxDB, but are still counted by Butler SOS.
This feature can be enabled/disabled in the Butler SOS config file. More info here.
Data available for accepted and rejected events
The full set of data stored for accepted events is described in the reference section.
Suggested workflows for different use cases
For some use high-level cases, such as identifying apps that are slow to load, the data for rejected events may be sufficient.
Other uses cases, such as monitoring the behavior of specific app objects (charts, tables etc), require the detailed data stored for accepted events.
The recommended, general principle is:
Start with the data captured via rejected events (counter and process_time), and then add detailed monitoring.
The detailed monitoring involves setting up filters to capture specific events for specific apps and/or app objects and/or engine methods.
Also: make sure to have a reasonably short retention period (10-14 days are usually enough) for the InfluxDB database, as the performance log events can generate a lot of data that can easily affect the performance of the InfluxDB instance.
Grafana dashboard examples
High-level monitoring of app performance (rejected events)
High level metrics (counters and process_time) for apps in a Sense environment.
Average time opening apps in a Sense environment. Note the long time for the app "Training - Field indexing DEV".
Total time spent on different engine operations, across all apps that were accessed during the selected time interval. Note the long time for the "Global::OpenApp" operation - this comes from one or more apps being slow to open.
Min, medium and max time spent opening apps in a Sense environment. Here we again see that most apps open quickly, but one app takes a long time to open. We can also see that once that app is in memory, it's fast to open for subsequent users.
Detailed monitoring of app object performance (accepted events)
A large set of metrics are stored for accepted performance log events, the examples below highlight just a few of them.
Detailed performance metrics for app objects in two different Sense apps. "Work time" (upper left) is the time spent by the engine doing the actual work, like calculating chart data after a selection is made by the user.
Work time per per app. The chart shows that one app dominates the work time.
Work time per object type, for all apps accessed during the chosen time interval. The chart shows that "auto-chart" and "table" objects take the most time to calculate. The "" object type is a catch-all for objects that Qlik Sense doesn't care to classify. It is also used in events sent during app reloads.
Detailed information about the various engine performance events that have been captured.
It is possible to inspect any value in the table, and easily copy it to the clipboard.
Work time per app object in the "Test data - Meetup.com DEV" app. Nothing stands out as particularly slow.
Work time per app object in the "Training - Field indexing" app. The chart shows that two objects take on the order of 5 seconds each to calculate. This is worth investigating.
Looking at the app sheet where the two slow objects above are located, we can see that it's two tables, each containing strings with random characters. These are slow to index for the engine after a selection is done by the user (or when first opening the app), causing the high work time.
3.4 - Visualise Butler SOS config file
Butler SOS has a built-in web server that can be used to visualise the configuration file, either as YAML or JSON.
Sensitive config values can be optionally be obfuscated in the visualization.
What is the current configuration?
When Butler SOS starts up, it reads its configuration from a file.
This file is the source of truth for the Butler SOS configuration, so when in doubt about what Butler SOS is doing, this is the place to look.
The config file can be hard to get to though, especially if Butler SOS is running in a container or on a remote machine.
To make it easier to see what the current configuration is, Butler SOS has a built-in web server that can be used to visualise the configuration file, either as YAML or JSON.
Info
This feature is described in the setup guide, here.
4 - Examples
See Butler SOS in action!
The whole SenseOps (Butler family of tools, together with support tools like InfluxDB, Prometheus, Grafana etc) stack is really a platform that can be configured and used in lots of different ways.
Be curious and bold - extend the given examples and use cases with your own!
And when doing so - please consider sharing your successes (and failures..) with others, as inspiration and insight.
Tip
You are strongly recommended to use the latest version of Grafana with the latest version of Butler SOS.
That said, earlier Butler SOS versions included some nice demo dashboards too, these are still found below as a source for inspiration what can be done.
4.1 - Visualizing Butler SOS metrics in New Relic
New Relic is a complete SaaS product that offers both data storage and powerful, yet easy to set up and use visualizations.
In this dashboard most of the data comes from Butler SOS, but the failed reload pie chart and table at the top are created using data from the Butler tool.
New Relic does not give you nearly the same level control as Grafana does, for example when it comes to fine-tuning visual details of charts, tables etc.
That can feel a bit limiting at first, but as New Relic’s query language is very powerful and is very well integrated in the chart editor, it’s not really a problem.
A benefit of New Relic’s dashboards is that their dashboard editor very effectively guide you through the creation of charts, using the various kinds of data (metrics, events, logs) you have sent - and are sending - to their database.
New Relic dashboards are thus definitely on the same level as Grafana ditto, which one to use is a matter of preference.
New Relic dashboard with data from both Butler SOS and Butler (part 1).
New Relic dashboard with data from both Butler SOS and Butler (part 2).
Viewing failed reload logs from within New Relic can save lots of time when investigating incidents.
4.2 - Visualizing Butler SOS metrics in Grafana
Grafana is a powerful tool for creating dashboards that visualise data from various sources.
This page shows examples of Grafana dashboards that visualise data from Butler SOS.
4.2.1 - Qlik Sense monitoring using Butler SOS v9.2 and Grafana v9.1
Grafana 9 adds some interesting features around alerting as well as several new and improved chart types.
The visual appearance is quite similar to previous versions, but line charts, tables etc have been replaced with the updated variants that arrived with Grafana 9.
4.2.2 - Qlik Sense monitoring using Butler SOS v7 and Grafana v8
With version 8 Grafana further establishes its position as the leading open source platform for observability and real-time dashboards.
Butler SOS takes advantage of this, below a sample dashboard is shown.
A concept that has proven useful many times is to use an overview dashboard to monitors high-level metrics for the entire Sense cluster. A separate, parameterized dashboard then drill into the details for each server.
Grafana variables make this both easy to set up, scalable and very powerful.
Sample dashboards are available in the Git repository.
Before importing these to Grafana you should create a Grafana data source called “senseops”, and point it to your InfluxDB database. When you then import the dashboards they should find your database straight away.
Dashboard installation
The dashboard file senseops_v7_0_dashboard.json was created using Butler SOS 7.0 and Grafana 8. It thus uses the new chart, data transformation and alerting features that were introduced in Grafana 8.
Overview metrics
The dashboard has a top section that’s always expanded.
A set of (by default) collapsed sections contain different kinds of metrics and log events.
Top level metrics
Low memory alerts can be set (using Grafana’s alert feature). Such alerts can be sent (using features built into Grafana) as notifications to Slack, Teams, Pager Duty, as email etc.
To keep the dashboard nice and clean it’s usually a good idea to put alert charts in their own section at the bottom, or in a separate dashboard dedicated to alerts.
Apps in memory
From a sysadmin perspective it’s often interesting to know what apps are loaded into memory on each Sense server.
For example, when a server is quickly loosing RAM it’s extremely useful to be able to zoom in to the very minute when the RAM drop occurs, then look at what apps were present in memory. One of those apps is probably not well designed, or is at least using a lot of memory.
The dashboard separates regular apps and session apps.
You can also use Grafana’s standard filtering features to narrow down on the server(s) of interest.
Apps loaded into memory
Users & sessions per server
If things really go wrong wrong in a Qlik Sense Enterprise environment there connected users might be kicked out. It is therefore important to know at any given time how many users are connected, and be able to detect sudden drops in user count.
Another use case could be for maintenance windows: You then want to know how many - and which - users are connected, so you can send them a message that maintenance is about to start.
Users and sessions per server
User events
If Butler SOS has been configured to handle user level events coming from Sense, these are shown here.
You get information about where the event took place and which user has
logged in (started a session)
logged out (stopped a session)
timed out (stopped a session)
opened a connection to a new app
closed a connection to an app (for example closed a browser tab)
… and more
User events
Warnings & Errors
In previous Butler SOS demo dashboards this information came from log db.
Starting with Butler SOS 7 the source of this data is instead the log events introduced in version 7.
Some of this information is also available in the standard Operations Monitor app in Qlik Sense Enterprise, but only in a retrospective way.
Having access to it in close to real time makes it possible to act on developing issues quicker.
Charts provide overview while tables then give the actual messages, as they appear in the log files.
Error and warning charts
Error and warning tables
It’s also possible to drill down into individual warnings and errors to get very detailed information about what happened:
Detailed view into errors and warnings
Butler SOS metrics
Butler SOS is very robust indeed, but it may still be of interest to track its memory use, to make sure there aren’t any memory leaks etc.
Butler SOS memory usage
4.2.3 - Qlik Sense monitoring using Grafana 7
Grafana 7 is a big update when it comes to visualizations. Grafana was excellent already in version 6, but with v7 things are taken to a new level.
A concept that has proven useful many times is to use an overview dashboard to monitors high-level metrics for the entire Sense cluster. A separate, parameterized dashboard then drill into the details for each server.
Sample dashboards are available in the Git repository.
Before importing these to Grafana you should create a Grafana data source called “SenseOps”, and point it to your InfluxDB database. When you then import the dashboards they should find your database straight away.
Overview metrics
This view gives high level insights into the 3 virtual proxies (/sales, /sourcing, /finance) in this particular Sense environment, as well as top-level numbers on users and sessions.
Top level metrics
Low memory alerts can be set (using Grafana’s alert feature). Such alerts can be sent (using features built into Grafana) as notifications to Slack, Teams, Pager Duty, as email etc.
To keep the dashboard nice and clean it’s usually a good idea to put alert charts in their own section (see below for an example).
Apps in memory
From a sysadmin perspective it’s often interesting to know what apps are loaded into memory on each Sense server.
Here you get the details broken down by regular apps and session apps.
You can also use Grafana’s standard filtering features to narrow down on the server(s) of interest.
Apps loaded into memory
Users & sessions per server
If things really go wrong wrong in a Qlik Sense Enterprise environment there connected users might be kicked out. It is therefore important to know at any given time how many users are connected, and be able to detect sudden drops in user count.
Another use case could be for maintenance windows: You then want to know how many - and which - users are connected, so you can send them a message that maintenance is about to start.
Users and sessions per server
Warnings & Errors
This information is available in the standard Operations Monitor app in Qlik Sense Enterprise, but only in a retrospective way.
Having access to it in close to real time makes it possible to act on developing issues quicker.
Charts provide overview while tables then give the actual messages, as they appear in the log files.
Error and warning charts
Error and warning tables
Butler SOS metrics
Butler SOS is very robust indeed, but it may still be of interest to track its memory use, to make sure there aren’t any memory leaks etc.
Butler SOS memory usage
Alerts
While it’s perfectly possible to include alerts in almost any Grafana chart, sometimes its nice to tuck the alert-enabled charts away, out of sight. They will do their job and alert when needed.
Alerts
4.2.4 - Qlik Sense monitoring using Grafana 6
Probably the most obvious and common use case for Butler SOS. View Qlik Sense and Windows operational metrics in great looking Grafana dashboards.
Grafana is an incredibly capable tool for showing time series data.
The dashboards shown here are thus just examples and inspiration - feel free to extend and adapt these to meet your particular needs. There are also plenty of sample Grafana dashboards out there to get inspiration from.
If you experience issues with the Grafana dashboards included in the Butler SOS release on Github, you might want to try upgrading to a later/latest Grafana version.
This is a top use case for Butler SOS.
These kind of dashboards give you detailed insights into several important metrics for your Sense servers:
CPU load
Amount of free RAM memory
Number of sessions in total
Success rate of the Qlik engine’s cache
Number of loaded apps in the Qlik engine
A concept that has proven useful many times is to use an overview dashboard to monitors high-level metrics for the entire Sense cluster. A separate, parameterized dashboard then drill into the details for each server.
Sample dashboards are available in the Git repository.
Before importing these to Grafana you should create a Grafana data source called “SenseOps”, and point it to your InfluxDB database. When you then import the dashboards they should find your database straight away.
Overview dashboard
An overview dashboard could look something like this:
RAM usage for each server
Low memory alerts can be set (using Grafana’s alert feature). Such alerts can be sent (using features built into Grafana) as notifications to Slack, Teams, Pager Duty, as email etc.
General/high level user sessions info for both whole system and each server
You can also get very detailed sessions metrics, down to the level of individual sessions per server and virtual proxy.
One possible use case for this information is to see what users will be affected by a pending server reboot. You could even use this information to send a chat message to these users, informing them that their connection to Sense will be lost in x minutes. This feature is not available in Butler SOS out of the box, but is quite possible to implement if needed.
As of Butler SOS v5.0.0, detailed user session metrics stored in a fairly comprehensive way in InfluxDB. The visualization of these metrics is still kind of rough though. The charts below can serve as inspiration, but can surely be improved upon..
Detailed user sessions info per server and virtual proxy
When something breaks in a Qlik Sense environment the logs immediately fill up with warning and/or error messages. By keeping track of these it’s easy to quickly spot (and get notified) issues when they first occur:
Detailed user sessions info per server and virtual proxy
Note how there are lots of INFO level messages generated (note the y axis scales in the diagram above!).
In a production setting it’s usually a good idea to turn off extraction of INFO level log messages into InfluxDB.
This example shows how to use Butler SOS to count user and log events received from one or more Qlik Sense servers.
Overview
Goal
The goal is to count how many user and log events are received from one or more Qlik Sense servers.
This can be useful for several reasons:
To get a general feeling if the Qlik Sense environment is healthy or not. A sudden increase in the number of warnings, errors or fatals can be an early warning sign that something is wrong. The event counters can be seen as a kind of heart beat of the Qlik Sense environment. Too fast - or too slow - can be a sign of trouble.
The counters count all log and user events sent from the Qlik Sense servers to Butler SOS. They can be used to confirm that the Qlik Sense servers are indeed sending events to Butler SOS at all. Other, more detailed event data can then be used to drill down into the details of what is happening in the Qlik Sense environment.
A Grafana dashboard is used to visualize the event counters:
A set of Grafana panels showing the number of user and log events received from two Qlik Sense servers. The panels are broken down by event type (log or user) and by server. The table contains event count per host, Sense service and subsystem.
Prerequisites
Butler SOS 11.0 or later. Downloads are available here.
Store the data collected by Butler SOS in an InfluxDB v1 or v2 database. Setup instructions here
XML appender files deployed on the Sense servers you want to monitor. The appender files tell Sense to send log events to Butler SOS via UDP messages. Setup instructions here.
A reasonably recent version of Grafana. At the time of writing, Grafana 11.2 is the latest version.
Data connections set up in Grafana to the InfluxDB database where Butler SOS stores its data.
Configure Butler SOS
Info
InfluxDB is the only supported database for this feature.
It is configured elsewhere in the YAML config file, more info here.
# Shared settings for user and log events (see below)qlikSenseEvents:# Shared settings for user and log events (see below)influxdb:enable:true# Should summary (counter) of user/log events, and rejected events be stored in InfluxDB?writeFrequency:20000# How often (milliseconds) should event counts be written to InfluxDB?......# Log events are used to capture Sense warnings, errors and fatals in real time# Shared settings for user and log events (see below)qlikSenseEvents:# Shared settings for user and log events (see below)influxdb:enable:true# Should summary (counter) of user/log events, and rejected events be stored in InfluxDB?writeFrequency:20000# How often (milliseconds) should rejected event count be written to InfluxDB?eventCount:# Track how many log and user events are received from Sense.# Some events are valid, some are not. Of the valid events, some are rejected by Butler SOS# based on the configuration in this file.enable:true# Should event count be stored in InfluxDB?influxdb:measurementName:event_count# Name of the InfluxDB measurement where event count is storedtags:# Tags are added to the data before it's stored in InfluxDB- name:qs_tag1value:somevalue1- name:qs_tag2value:somevalue2
Configure Grafana
Total count of user and log events received from two Qlik Sense servers
The upper left panel of the Grafana dashboard at the top of this page is defined as below.
Note the two-layered query.
It is needed to get the data from the InfluxDB database in a format that Grafana can use.
Total count of user and log events received from two Qlik Sense servers.
There are also a couple of transformations applied to the data:
Transformations applied to the data before it's displayed in the Grafana panel. The sorting is done to make sure the data is displayed in the correct order. Renaming/reorder is not used in this example.
Count of user and log events per host
The center left panel of the Grafana dashboard at the top of this page is defined as below.
The query is very similar to the one above, but with a different grouping.
Count of user and log events per host.
Transformations…
Transformations applied to the data before it's displayed in the Grafana panel.
Count of user and log events per event type
The lower left panel of the Grafana dashboard at the top of this page is defined as below.
Count of user and log events per event type.
Transformations…
Transformations applied to the data before it's displayed in the Grafana panel.
Table of received events
The table at the right of the Grafana dashboard at the top of this page is defined as below.
Table of received events and event count per event type, host, Sense service/source and subsystem.
Transformations…
Transformations applied to the data before it's displayed in the Grafana panel.
Next steps
4.4 - Monitor Qlik Sense engine performance in Grafana
The combination of Butler SOS and Grafana provides a powerful combo for monitoring the performance of your Qlik Sense engines.
Here are some recipes for how to set up Butler SOS to implement various specific monitoring scenarios.
4.4.1 - Track how long it takes to open Sense apps
This example shows how to use Butler SOS to track how long it takes to open apps on a Qlik Sense server.
Overview
Goal
The goal is to show how to use Butler SOS to track how long it takes to open apps on a Qlik Sense server.
This is useful for several reasons:
It provides baseline for how long it takes to usually open apps on your server, and allows you to track changes over time.
It can help identify apps that are slow to open, and then investigate why.
Add Grafana based alerts to get notified when the time to open some app(s) exceeds a certain threshold.
If end users complain about slow app opening times, the concept in this tutorial can be used to verify if there actually is a problem, and if so, where and how severe it is.
A Grafana chart showing this data could look something like this:
Chart showing mean time needed to open apps on a Qlik Sense server.
Prerequisites
Butler SOS 11.0 or later. Downloads are available here.
Store the data collected by Butler SOS in an InfluxDB v1 or v2 database. Setup instructions here
XML appender files deployed on the Sense servers you want to monitor. The appender files tell Sense to send log events to Butler SOS via UDP messages. Setup instructions here.
A reasonably recent version of Grafana. At the time of writing, Grafana 11.2 is the latest version.
Data connections set up in Grafana to the InfluxDB database where Butler SOS stores its data.
Configure Butler SOS
Enable engine performance monitoring.
Enable tracking of rejected performance log events.
Butler SOS will track two things related to rejected events: Number of events (=counter), and the processing time for these events.
If detailed engine performance log events are enabled, Butler SOS will not create counters for these events. Instead, it will store the detailed data in InfluxDB.
This data can then be aggregated to create the same kind of counters as for rejected engine performance log events.
Note: “Rejected events” are engine performance log events that do not meet the criteria set up in Butler SOS for detailed engine performance monitoring.
Bottom line is that you can disable all detailed engine monitoring in Butler SOS, and only enable the tracking of rejected events.
This will give you a counter for the number of rejected events, and the processing time for these events, across a set of dimensions - of which engine “method” is one.
Or you can enable detailed engine performance monitoring for some apps, and only track rejected events for others.
Either way it will be possible to create Grafana charts that show the average time it takes to open apps on your Sense server(s).
Info
InfluxDB is the only supported database for this feature.
It is configured elsewhere in the YAML config file, more info here.
# Shared settings for user and log events (see below)qlikSenseEvents:# Shared settings for user and log events (see below)influxdb:enable:true# Should summary (counter) of user/log events, and rejected events be stored in InfluxDB?writeFrequency:20000# How often (milliseconds) should event counts be written to InfluxDB?......rejectedEventCount:# Rejected events are events that are received from Sense, that are correctly formatted,# but that are rejected by Butler SOS based on the configuration in this file.# An example of a rejected event is a performance log event that is filtered out by Butler SOS.enable:true# Should rejected events be counted and stored in InfluxDB?influxdb:measurementName:rejected_event_count# Name of the InfluxDB measurement where rejected event count is stored......# Log events are used to capture Sense warnings, errors and fatals in real timelogEvents:udpServerConfig:serverHost:0.0.0.0# Host/IP where log event server will listen for events from SenseportLogEvents:9996# Port on which log event server will listen for events from Sensetags:- name:qs_tag1value:somevalue1- name:qs_tag2value:somevalue2......enginePerformanceMonitor:# Detailed app performance data extraction from log eventsenable:true# Should app performance data be extracted from log events?appNameLookup:# Should app names be looked up based on app IDs?enable:truetrackRejectedEvents:enable:true# Should events that are rejected by the app performance monitor be tracked?tags:# Tags are added to the data before it's stored in InfluxDB- name:qs_tag1value:somevalue1- name:qs_tag2value:somevalue2
Configure Grafana
Create a Grafana chart (in an existing dashboard or a new one) that shows the average time it takes to open apps on your Sense server(s).
You do this by only show data in the chart for the engine method Global::OpenApp.
The definition of such a chart in Grafana could look something like this (slightly different set of apps selected, compared to screenshot above):
Definition of a Grafana chart showing the average time it takes to open apps on a Qlik Sense server.
Note how the tag method is set to Global::OpenApp. This is the engine method that is called when an app is opened in Qlik Sense, it covers the entire time it takes to open an app.
For apps currently not in memory, this will include the time it takes to load the app from disk (which can be significant for large apps).
For apps already in memory, the time for this method will be much shorter.
Also note how the app_name tag is used to filter out only the apps you are interested in, by matching it to the app_name_unmonitored variable.
See below for detailed on how to set up this variable.
Grafana variables
By using Grafana variables, you can easily change which apps you want to show data for in the chart.
Here is how you can set up a variable in Grafana that allows you to select which apps to show data for (see above too, for how to use this variable in a chart):
Create a Grafana variable that allows you to select which apps to show data for in a chart. The entire definition is not shown here, make sure to check the "Multi-value" and "Include All option" checkboxes too (further down that page).
Next steps
Using the concept in this tutorial, but with a slightly different chart definition in Grafana, it is possible to visualise the mean time for each method that Butler SOS tracks.
Combine with a app-selection filter variable in Grafana, and you can easily switch between different apps to see how long the various engine operations take in each of them:
Chart showing mean time for all engine methods that were used during the selected time interval, for the selected apps(s).
4.4.2 - Find charts that are slow to update
This example shows how to use Butler SOS to monitor which parts of a Qlik Sense app that are slow to update.
Overview
Goal
The goal is to monitor how long each app object in a Sense app takes to open, and also identify which objects are slow to update.
This is useful for several reasons:
Identify misbehaving charts, tables etc in important apps. This can be especially important for apps that are used by many users, or that are in some way business critical.
To get a baseline for how long it takes for each app object (chart, table, …) to open and update. This can then be used to set thresholds for alerts, or to identify when performance degrades over time.
An end user may experience slow performance when interacting with an app. By monitoring the time it takes for each object to both open and update when selections are done, you can identify which objects are slow to update.
A Grafana chart showing this data for the app “Training - Field indexing” could look something like this:
In order to understand the chart you must also know the ID of each app object. More on this further down this page.
Prerequisites
Butler SOS 11.0 or later. Downloads are available here.
Store the data collected by Butler SOS in an InfluxDB v1 or v2 database. Setup instructions here
XML appender files deployed on the Sense servers you want to monitor. The appender files tell Sense to send log events to Butler SOS via UDP messages. Setup instructions here.
A reasonably recent version of Grafana. At the time of writing, Grafana 11.2 is the latest version.
Data connections set up in Grafana to the InfluxDB database where Butler SOS stores its data.
A way to get the ID of each app object in the Sense apps you want to monitor. This can be done in several ways.
The app being monitored
The “Training - Field indexing” app is used as an example in this tutorial.
It’s a basic app that is used to explain to Sense developers how in-app data indexing works in Qlik Sense.
The consists of a single table with two fields, with 10 million rows of random data:
Data model in the "Training - Field indexing" app.
The “LongStrings” field contains random strings of 32 characters each.
The idea of the app is to stress the Sense engine by having it index random data - something that can be done, but also something that will be slower and slower as the number of rows or the length of the “LongStrings” field increases.
There are two things that may require a lot of time to update in this app:
Opening the app when it is not already in memory. This will trigger an indexing of the data, which takes time given the randomness of the data and the number of rows.
Making a selection in the app once it is open. This will trigger a re-indexing of the selected data, which can also take some time (depending on what/how much data is selected).
A word of caution
Enabling detailed performance monitoring can generate a lot of data, especially if it is enabled for many apps.
This can lead to a large amount of data being stored in InfluxDB, which in turn can lead to performance issues in InfluxDB and Grafana.
It is therefore recommended to only enable detailed performance monitoring for a limited number of apps, and possibly only for a limited time period.
For example, it can be useful to start off by monitoring all app objects in an app to begin with, and then limit the monitoring to only a few objects that are of special interest.
It’s also possible to limit the monitoring to only certain app object types, such as charts and tables, and not other object types.
Configure Butler SOS
Info
InfluxDB is the only supported database for this feature.
It is configured elsewhere in the YAML config file, more info here.
# Shared settings for user and log events (see below)qlikSenseEvents:# Shared settings for user and log events (see below)influxdb:enable:true# Should summary (counter) of user/log events, and rejected events be stored in InfluxDB?writeFrequency:20000# How often (milliseconds) should event counts be written to InfluxDB?......# Log events are used to capture Sense warnings, errors and fatals in real timelogEvents:udpServerConfig:serverHost:0.0.0.0# Host/IP where log event server will listen for events from SenseportLogEvents:9996# Port on which log event server will listen for events from Sensetags:- name:envvalue:DEV- name:foovalue:bar......enginePerformanceMonitor:# Detailed app performance data extraction from log eventsenable:true# Should app performance data be extracted from log events?appNameLookup:# Should app names be looked up based on app IDs?enable:true......monitorFilter:# What objects should be monitored? Entire apps or just specific object(s) within some specific app(s)?# Two kinds of monitoring can be done:# 1) Monitor all apps, except those listed for exclusion. This is defined in the allApps section.# 2) Monitor only specific apps. This is defined in the appSpecific section.# An event will be accepted if it matches any of the rules in the allApps section OR any of the rules in the appSpecific section.allApps:enable:false# Should all apps be monitored?appExclude:# What apps should be excluded from monitoring?# If both appId and appName are specified, both must match the event's data for it to be considered a match.t objectType:allObjectTypes:false# Should all object types be monitored?allObjectTypesExclude:# If allObjectTypes is set to true, the object types in this array are excluded from monitoring.# someObjectTypesInclude (below) is ignored in that case.someObjectTypesInclude:# What object types should be included in monitoring?# Only applicable if allObjectTypes is set to false.method:allMethods:false# Should all methods be monitored?allMethodsExclude:# If allMethods is set to true, the methods in this array are excluded from monitoring.# someMethodsInclude (below) is ignored in that case.someMethodsInclude:# What methods should be included in monitoring?# Only applicable if allMethods is set to false.appSpecific:enable:true# Should app specific monitoring be done?app:- include:# What apps should be monitored?# If both appId and appName are specified, both must match the event's data for it to be considered a match.- appName:Training - Field indexingobjectType:allObjectTypes:true# Should all object types be monitored?allObjectTypesExclude:# If allObjectTypes is set to true, the object types in this array are excluded from monitoring.# someObjectTypesInclude (below) is ignored in that case.someObjectTypesInclude:# What object types should be included in monitoring?# Only applicable if allObjectTypes is set to false.appObject:allAppObjects:true# Should all app objects be monitored?allAppObjectsExclude:# If allAppObjects is set to true, the app objects in this array are excluded from monitoring.# someAppObjectsInclude (below) is ignored in that case.someAppObjectsInclude:# What app objects should be included in monitoring?# Only applicable if allAppObjects is set to false.method:allMethods:true# Should all methods be monitored?allMethodsExclude:# If allMethods is set to true, the methods in this array are excluded from monitoring.# someMethodsInclude (below) is ignored in that case.someMethodsInclude:# What methods should be included in monitoring?# Only applicable if allMethods is set to false.
Configure Grafana
With the above Butler SOS configuration in place (remember to restart Butler SOS after making changes to its configuration file), you can now set up Grafana to visualize the data.
Here is a chart that shows the average time it takes for each app object in the “Training - Field indexing” app to open and update (the chart shown at the top of this page):
Definition of a Grafana chart showing the average time it takes to open and update each app object in the "Training - Field indexing" app.
Grafana variables
The chart repeats itself over the “app_name_monitored” Grafana variable, which means one chart is shown for each selected app in that variable filter (at the top of the Grafana dashboard).
The variable is set up like this:
List of variables in a SenseOps dashboard in Grafana.
Definition of the "app_name_monitored" Grafana variable.
Next steps
Given the detailed information captured about all app objects in the “Training - Field indexing” app, it is possible to slice and dice the data in many ways.
For example, it could be interesting to see what kinds of app objects use most time, and which ones are faster.
Something like this:
Chart showing the _total_ time spent updating the "Training - Field indexing" app, grouped by object type, during last hour.
5 - Reference docs
Technical reference docs and general sources of information that might be useful.
References in this site
Config file format
A detailed description of all configuration options in the main config file is available here.
Available metrics
A complete list of all metrics provided by Butler SOS is found here.
There are various MQTT brokers available, both commercial and open source. Mosquitto is an open sourceMQTT broker with a solid track record and available as a Docker container.
There are also plenty of companies offering SaaS MQTT brokers, ranging from small specialized companies to the big cloud providers.
5.1 - Command line options
Description of Butler SOS’ command line options.
Command line options
When starting Butler SOS, you can pass command line options to customize its behavior.
Looks like this:
Usage: butler-sos [options]Butler SenseOps Stats ("Butler-SOS") is a microservice publishing operational Qlik Sense metrics to InfluxDB, Prometheus and New Relic.
User events and log events can be forwarded from Sense to Butler SOS and then acted upon there. Events can be stored in InfluxDB and sent to New Relic.
Add Grafana for great looking dashboards and you get real-time monitoring of what happens inside a Qlik Sense environment.
Options:
-V, --version output the version number
-c, --configfile <file> path to config file
-l, --loglevel <level> log level (choices: "error", "warn", "info", "verbose", "debug", "silly") --new-relic-account-name <name...> New Relic account name. Used within Butler SOS to differentiate between different target New Relic accounts
--new-relic-api-key <key...> insert API key to use with New Relic
--new-relic-account-id <id...> New Relic account ID
--skip-config-verification Disable config file verification (default: false) -h, --help display helpforcommand
-V, –version
Output the version number of Butler SOS.
-c, –configfile
Specifies the configuration file to use.
Valid values: A path to a configuration file.
Default: Whatever is specified in the NODE_ENV environment variable, with a .yaml extension added. Butler SOS will look for that file in the ./config directory.
Example:
-c or --configfile are not specified. NODE_ENV is set to production. Butler SOS will try to read settings from ./config/production.yaml.
-l, –loglevel
Specifies the log level to use.
When set, this overrides the log level specified in the configuration file.
When using New Relic as backend for storing metrics, you can specify New Relic credentials in the config file - but that is not ideal from a security perspective.
To avoid that, you can specify the New Relic credentials on the command line using the following options.
–new-relic-account-name
List of New Relic account names. Used within Butler SOS to differentiate between different target New Relic accounts to which data can be sent. This name has nothing to do with the account name used in New Relic - it’s purely for Butler SOS’ internal use.
Specifically, it’s at multiple places in the config file where you can specify to which New Relic account to send data.
Enclose account names in quotes if they contain spaces.
Separate multiple account names with a space.
List of New Relic API keys. Used to authenticate with New Relic.
Enclose API keys in quotes if they contain spaces.
Separate multiple API keys with a space. Note that the order of the API keys must match the order of the account names, i.e. the first API key corresponds to the first account name, the second API key corresponds to the second account name, and so on.
List of New Relic account IDs. Used to identify the New Relic account to which data should be sent.
Enclose account IDs in quotes if they contain spaces.
Separate multiple account IDs with a space. Note that the order of the account IDs must match the order of the account names, i.e. the first account ID corresponds to the first account name, the second account ID corresponds to the second account name, and so on.
–skip-config-verification
Disable config file verification.
By default, Butler SOS verifies the config file when it starts. If the config file is invalid, Butler SOS will log an error and exit.
Use this option to disable config file verification.
-h, –help
Display help for command.
5.2 - Config file format
Everything you ever wanted to know about the Butler SOS configuration file.
Tip
The config file uses YAML notation, with file extensions of .yaml or .yml.
The .yaml extension is recommended.
The config file is the heart of Butler SOS.
All setting must be defined in the config file - run time errors are likely to occur otherwise.
A sample config file is included in the release ZIP files, and also available on GitHub.
A few things to keep in mind:
Topic names (e.g. “Butler-SOS.logLevel”) are case sensitive.
First time Butler SOS is started, a new check is done if the specified InfluxDB database already exists.
If it doesn’t exist it will be created together with a default InfluxDB retention policy. The retention policy is based on the time period set in the config file.
Top level
Parameter
Description
logLevel
The level of details in the logs. Possible values are silly, debug, verbose, info, warn, error (in order of decreasing level of detail).
fileLogging
true/false to enable/disable logging to disk file
logDirectory
Subdirectory where log files are stored
anonTelemetry
Can Butler SOS share anonymous data about itself with the Butler SOS project? More info on what data is collected here.
Butler-SOS.configVisualisation
Parameter
Description
enable
Should Butler SOS’ config file be visualized in a web UI? true/false
host
Hostname or IP address where the web server will listen. Should be localhost or the host’s IP address in most cases.
port
Port where the web server will listen. Change if port 3100 is already in use.
obfuscate
Should the config file shown in the web UI be obfuscated? true/false
Butler-SOS.heartbeat
Heartbeats can be used to send “I’m alive” messages to some other tool, e.g. an infrastructure monitoring tool.
The concept is simple: The remoteURL will be called at the specified frequency. The receiving tool will then know that Butler SOS is alive.
Parameter
Description
enable
Should heartbeats be sent to some URL, indicating that Butler SOS is alive and well? true/false
Docker health checks are used when running Butler SOS as a Docker container.
The Docker engine will call the container’s health check REST endpoint with a set interval to determine whether the container is alive/well or not.
If you are not running Butler SOS in Docker you can disable this feature.
Parameter
Description
enable
Should a Docker healthcheck endpoint be created within Butler SOS? Set to false if not running Butler SOS under Docker. true/false
port
Port the healthcheck should use. Usually 12398, but might need be changed if several Butler instances run on the same server
Butler-SOS.uptimeMonitor
Parameter
Description
enable
Should messages with Butler SOS uptime and memory usage be written to console and logs? true/false
Starting at what log level should uptime messages be used? Possible values are silly, debug, verbose, info, warn, error. For example, if you specify “verbose” here, uptime messages will appear if you set overall log level to silly, debug or verbose.
storeInInfluxdb. butlerSOSMemoryUsage
Should data on Butler SOS’ own memory use be stored in Infludb? true/false
storeInInfluxdb. instanceTag
Tag used to differentiate data from multiple Butler SOS instances. Useful if running different Butler SOS instances against (for example) DEV, TEST and PROD environments
storeNewRelic. enable
Should uptime data be sent to New Relic? true/false
storeNewRelic. destinationAccount
Array of New Relic account names to which uptime data will be sent
Should uptime metrics be tagged with Butler SOS version number? true/false
Butler-SOS.thirdPartyToolsCredentials
Parameter
Description
newRelic
Array of credentials for the New Relic accounts to which data should be sent. Each array item consists of several items, see below.
newRelic[] accountName
Name of New Relic account. This is a “friendly name” that’s used within Butler SOS to identify each NR account.
newRelic[] insertApiKey
Insert API key associated with the NR account. Get this from the NR account’s settings page.
newRelic[] accountId
New Relic account id. Get this from the NR account’s settings page.
Butler-SOS.userEvents
Track individual users opening/closing apps and starting/stopping sessions.
Requires log appender XML file(s) to be added to Sense server(s).
Parameter
Description
enable
Should Butler SOS track detailed user events (i.e. session start/stop, connection open/close)? true/false
excludeUser
Array of users (=directory/userId pairs) that should be disregarded when user events arrive from Sense. Remove sample users before deploying Butler SOS.
udpServerConfig. serverHost
IP/host where the user event UDP server should listen for incoming connections. Usually the same IP/host as where Butler SOS is running. Using 0.0.0.0 will cause Butler SOS to listen on all available IPs.
udpServerConfig. portUserActivityEvents
Port on which the user event UDP server will listen. Should match the port specified in the log appender.
tags
Array of tags (tagName/tagValue pairs) that should be added to each user event before sending it to InfluxDB. Remove sample tags before deploying Butler SOS.
sendToMQTT.enable
Should user events be sent to MQTT? true/false
sendToMQTT.postTo. everythingTopic.enable
Should all user event messages be sent to an MQTT topic? true/false
sendToMQTT.postTo. everythingTopic.topic
MQTT topic to which all user event messages will be sent.
sendToMQTT.postTo. sessionStartTopic.enable
Should session start user event messages be sent to an MQTT topic? true/false
sendToMQTT.postTo. sessionStartTopic.topic
MQTT topic to which session start user event messages will be sent.
sendToMQTT.postTo. sessionStopTopic.enable
Should session stop user event messages be sent to an MQTT topic? true/false
sendToMQTT.postTo. sessionStopTopic.topic
MQTT topic to which session stop user event messages will be sent.
sendToMQTT.postTo. connectionOpenTopic.enable
Should connection open user event messages be sent to an MQTT topic? true/false
sendToMQTT.postTo. connectionOpenTopic.topic
MQTT topic to which connection open user event messages will be sent.
sendToMQTT.postTo. connectionCloseTopic.enable
Should connection close user event messages be sent to an MQTT topic? true/false
sendToMQTT.postTo. connectionCloseTopic.topic
MQTT topic to which connection close user event messages will be sent.
sendToInfluxdb.enable
Should user events be saved in InfluxDB? true/false
sendToNewRelic.enable
Should user events be saved in New Relic? true/false
sendToNewRelic.destinationAccount
Array of New Relic account names to which user events will be sent.
sendToNewRelic.scramble
Should user directory and user ID fields be scrambled before user events are sent to New Relic? true/false
Butler-SOS.logEvents
Log events are used to capture Sense warnings, errors and fatals in real time.
Requires log appender XML file(s) to be added to Sense server(s).
Note that log events can be enabled/disabled per source (repository, proxy, scheduler etc).
Parameter
Description
udpServerConfig. serverHost
IP/host where the log event UDP server should listen for incoming connections. Usually the same IP/host as where Butler SOS is running. Using 0.0.0.0 will cause Butler SOS to listen on all available IPs.
udpServerConfig. portLogEvents
Port on which the log event UDP server will listen. Should match the port specified in the log appender.
tags
Array of tags (tagName/tagValue pairs) that should be added to each log event before sending it to InfluxDB. Remove sample tags before deploying Butler SOS.
source. engine.enable
Should log events from the engine service be handled by Butler SOS? true/false
source. proxy.enable
Should log events from the proxy service be handled by Butler SOS? true/false
source. repository.enable
Should log events from the repository service be handled by Butler SOS? true/false
source. scheduler.enable
Should log events from the scheduler service be handled by Butler SOS? true/false
categorise.enable
Should categorization of log events be enabled? true/false
categorise.rules
Array of rules that will be used to categorise log events. Each rule consists of a set of properties.
categorise.rules[]. description
Description of the rule.
categorise.rules[]. logLevel[]
Array of log levels that will be used to match log events against this rule.
categorise.rules[]. action
Action to take if a log event matches this rule. Possible values are “categorise” and “drop”.
categorise.rules[]. category[]
Array of name-value pairs that will be added to the log event if it matches this rule.
categorise.rules[]. category[].name
Name of the category.
categorise.rules[]. category[].value
Value of the category.
categorise.rules[]. filter[]
Array of type-value pairs that will be used to match log events against this rule.
categorise.rules[]. filter[].type
Type of filter. Possible values are “sw” = starts with, “ew” = ends with, “so” = substring of.
categorise.ruleDefault
Default values for categorization, if no other rule matches.
categorise.ruleDefault. enable
Should the default rule be used? true/false
categorise.ruleDefault. category[]
Array of name-value pairs that will be added to the log event if no other rule matches.
categorise.ruleDefault. category[].name
Name of the category.
categorise.ruleDefault. category[].value
Value of the category.
sendToMQTT.enable
Should log events be sent to MQTT? true/false
sendToMQTT.baseTopic
Root MQTT topic. All log events MQTT messages will be posted in this topic or subtopics of it.
sendToMQTT.postTo .baseTopic
Should all log events be posted to the root topic? true/false
sendToMQTT.postTo .subsystemTopics
All log events originate from a specific subsystem in a Sense server. These subsystems are organized in a hierarchical tree that can be directly mapped to MQTT topics. Should log events be posted as MQTT messages to such topics? true/false
sendToInfluxdb.enable
Should log events be saved in InfluxDB? true/false
sendToNewRelic.enable
Should log events be sent to New Relic? true/false
sendToNewRelic.destinationAccount
Array of New Relic account names to which log events will be sent.
sendToNewRelic. source.engine.enable
Should log events from the engine service be handled?
sendToNewRelic. source.engine.logLevel.error
Should ERROR log events from the engine service be handled?
sendToNewRelic. source.engine.logLevel.warn
Should WARN log events from the engine service be handled?
sendToNewRelic. source.proxy.enable
Should log events from the proxy service be handled?
sendToNewRelic. source.proxy.logLevel.error
Should ERROR log events from the proxy service be handled
sendToNewRelic. source.proxy.logLevel.warn
Should WARN log events from the proxy service be handled
sendToNewRelic. source.repository.enable
Should log events from the repository service be handled?
sendToNewRelic. source.repository.logLevel.error
Should ERROR log events from the repository service be handled
sendToNewRelic. source.repository.logLevel.warn
Should WARN log events from the repository service be handled
sendToNewRelic. source.scheduler.enable
Should log events from the scheduler service be handled?
sendToNewRelic. source.scheduler.logLevel.error
Should ERROR log events from the scheduler service be handled
sendToNewRelic. source.scheduler.logLevel.warn
Should WARN log events from the scheduler service be handled
Butler-SOS.cert
Certificates to use when connecting to Sense. Get these from the Certificate Export in QMC.
Parameter
Description
clientCert
Certificate file. Exported from QMC
clientCertKey
Certificate key file. Exported from QMC
clientCertCA
Root certificate for above certificate files. Exported from QMC
clientCertPassphrase
Password used to protect the certificate (as set when exporting cert from QMC)
Butler-SOS.mqttConfig
MQTT config parameters. These must be correctly defined for any other MQTT features in Butler SOS to work.
Parameter
Description
enable
Should health metrics be sent to MQTT? true/false
brokerHost
IP or FQDN of MQTT broker
brokerPort
Broker port
baseTopic
Default topic used if not not otherwise specified elsewhere. Should end with /. For example butler-sos/
Butler-SOS.newRelic
If enabled, select Butler SOS metrics and events will be sent to New Relic.
Note that New Relic destination accounts for events are defined in the Butler-SOS.userEvent and Butler-SOS.logEvent sections, whereas destination accounts for metrics are defined in this section (Butler-SOS.newRelic).
Parameter
Description
enable
Should Qlik Sense health metrics be sent to New Relic? true/false
Should Butler SOS’ version be attached as an attribute to Sense health metrics sent to New Relic? true/false
Butler-SOS.prometheus
If enabled, select Butler SOS metrics will be exposed on a Prometheus compatible URL from where they can be scraped by Prometheus.
Parameter
Description
enable
Should health metrics be made available for scraping on a Prometheus compatible API http endpoint? true/false
host
IP on which the Prometheus compatible endpoint should be available. Using 0.0.0.0 will cause Butler SOS to listen on all available IPs.
port
Port on which the Prometheus compatible endpoint will be made available. Default 9842.
Butler-SOS.influxdbConfig
InfluxDB config parameters. These must be correctly defined for any other InfluxDB features in Butler SOS to work.
Parameter
Description
enable
Should health metrics be stored in Influxdb? true/false
host
IP or FQDN of Influxdb server.
port
Port where Influxdb server is listening. Useful if Influxdb for some reason is not using its standard port of 8086. NOTE: Must be set to a value (for example 8086), otherwise this config entry will be flagged as invalid when the config file format is verified on startup.
version
Influxdb version. Valid values are 1 and 2.
v2Config.org
Organization name to use when connecting to Influxdb v2.
v2Config.bucket
Bucket name to use when connecting to Influxdb v2.
v2Config.description
Description of the Inflluxdb bucket.
v2Config.token
Token to use when connecting to Influxdb v2.
v2Config.retentionDuration
Retention duration for the Influxdb bucket.
v1Config. auth.enable
Enable if data is to be stored in a password protected Influxdb v1 database.
v1Config. auth.username
Influxdb username.
v1Config. auth.password
Influxdb password.
v1Config.dbName
Name of Influxdb v1 database to use.
v1Config. retentionPolicy.name
Name of default retention policy that will be created in InfluxDB database when that database is created during first execution of Butler SOS.
v1Config. retentionPolicy.duration
Duration during which metrics are kept in InfluxDB. After the duration has passed, InfluxDB will purge all data older than duration from the database. See InfluxDB docs for details on syntax.
includeFields. activeDocs
Should a list of currently active Sense apps be stored in Influxdb? true/false
includeFields. loadedDocs
Should a list of Sense apps opened in a user session be stored in Influxdb? true/false
includeFields. activeDocs
Should a list of Sense apps loaded into memory (some apps might not currently be associated with a user session) be stored in Influxdb? true/false
Butler-SOS.appNames
Parameter
Description
enableAppNameExtract
Should app names be extracted from Qlik Sense server? true/false
extractInterval
How often (milliseconds) should app names be extracted from Sense server?
hostIP
IP or FQDN of Sense server from which app names should be extracted
Butler-SOS.userSessions
Extract user session data per virtual proxy.
Parameter
Description
enableSessionExtract
Influxdb password
pollingInterval
Influxdb password
excludeUser
Array of users (=directory/userId pairs) that should be disregarded when user session data arrives from Sense.
Butler-SOS.serversToMonitor
Parameter
Description
pollingInterval
How often to query the Sense healthcheck API
rejectUnauthorized
Set to false to ignore warnings/errors caused by Qlik Sense’s self-signed certificates. Set to true if the Qlik Sense root CA is available on the computer where Butler SOS is running.
serverTagsDefinition
List of tags to add to each server when storing the data in Influxdb. All tags defined here MUST be present in each server’s definition section further down in the config file!
servers
Array of servers to monitor. For each server a set of properties MUST be defined.
servers. host
FQDN of server. Domain should match that of the certificate exported from QMC - otherwise certificate warnings may appear. NOTE: You need to specify the port too - should be :4747 unless it’s been changed from default value (very unusual to change this).
servers. serverName
Human friendly server name
servers. serverDescription
Human friendly server description
servers. userSessions. enable
Control whether user session data should be retrieved for this server
servers. userSessions. host
Host and port from which to retrieve user session data. Usually on the form servername.mydomain.net:4243
servers. userSessions. virtualProxies
A list of key-value pairs. Use to specify for which virtual proxies on this server user session data should be retrieved.
serverTags
A list of key-value pairs. Use to provide more metadata for servers. Can then (among other things) be used to created more advanced Grafana dashboards.
headers
A list of key-value pairs. Headers specified here will be used when retrieving metrics from this Sense server.
5.3 - Available Metrics
In order to create graphs in for example Grafana, you must understand what metrics are available and how they are structured.
5.3.1 - Available metrics: InfluxDB
In order to create dashboards in for example Grafana, you must understand what metrics are available and how they are structured.
InfluxDB
Metrics retrieved from the Sense servers can be stored in an InfluxDB database. You don’t have to be an InfluxDB expert to use Butler SOS, but understanding some basic concepts are helpful.
Storing metrics in InfluxDB is not mandatory, but some kind of metrics storage - either in InfluxDB, New Relic or Prometheus - is needed to take full benefit of Butler SOS’ features.
InfluxDB is a time series database. This means it is super good at storing values that have a timestamp associated with them - and pretty bad at everything else. In many respects time series databases are the opposite of traditional SQL databases (who are usually pretty bad at handling time series data).
Because of it’s focus on time series data, InfluxDB v1 has its own query language, InfluxQL. It is somewhat similar to SQL, but also has many unique commands and features.
Influx DB v2 has a new query language called Flux. There are compatibility layers in InfluxDB v2 that allow you to use InfluxQL, meaning that existing Grafana dashboards and can be kept as they are, even if you upgrade to InfluxDB v2.
Flux is a more powerful query language than InfluxQL, but it also has a steeper learning curve. By learning Flux you will be able to do more advanced things with your data, for example in Grafana dashboards.
It’s worth browsing through the InfluxDB documentation to get a feel for what InfluxDB is and how it works.
The list of metrics below shows all metrics that Butler SOS can store in InfluxDB.
If you have disabled some features of Butler SOS, the associated metrics will not be stored in InfluxDB.
InfluxDB v1 vs v2
That are some differences between InfluxDB v1 and v2 when it comes to terminology and concepts.
For example in InfluxDB v1, the main concepts are databases, measurements, field keys and tag keys.
In InfluxDB v2 the main concepts are buckets, measurements, fields and tags.
The concepts are very similar, but the names are different.
The metrics below are the same for both InfluxDB v1 and v2.
Overview
Measurements are just what it sounds like: snapshots of some value(s), taken at a specific point in time.
A measurement can contain several field keys, which for practical purposes can be viewed as the individual metrics.
For example, the list of measurements look like this (using the InfluxDB command line client to explore the database structure):
> use senseops
Using database senseops
> show measurements
name: measurements
name
----
apps
butlersos_memory_usage
cache
cpu
log_event
log_event_logdb
mem
saturated
sense_server
session
user_events
user_session_details
user_session_list
user_session_summary
users
>
Let’s take a look at what field keys the apps measurement contains:
Ok, so the field keys are the actual metrics for which we gather data. Collectively those metrics (again: field keys in InfluxDB lingo) above are grouped into a measurement called apps.
There is one more concept you need to understand: tag keys
It’s pretty simple: Tag keys are used to categorize (or simply “tag”) measurements.
Let’s say you use Butler SOS to collect data from ten Sense servers. That’s great, but how will you later distinguish between server 3 and server 8? You need some way of telling your Grafana dashboard to show the data for server 3 (if that’s what you want).
Tags solve this. In the Butler SOS YAML config file you can define any number of tags that will be used to tag data coming in from Qlik Sense.
The beauty of tags is that they play very nicely with Grafana - without them the Grafana dashboards would not be nearly as flexible as they are.
To see what tag keys a certain measurement has you use a query similar to the one above/for fields:
> show tag keys from apps
name: apps
tagKey
------
host
serverBrand
serverLocation
server_description
server_group
server_name
server_type
Note that this list of tags consists of two parts:
Tags always present. These are inserted by Butler SOS and are present for all measurements. These are host, server_description and server_name.
Tags configured in Butler SOS’ config file. In the example above these are serverBrand, serverLocation, server_group andserver_type.
Measurements and fields
The measurements are grouped based on what part of Sense they are retrieved from. The groups are
General health metrics.
Metrics about user sessions, for example how many sessions there are per virtual proxy.
Event counters: Counters for the different types of events received from Sense.
User events: Session and connection related messages from QSEoW logs.
Log events: Warning, error and fatal messages from QSEoW logs.
Performance log events. Events from the QIX engine. Used to monitor performance of individual charts and other app objects.
Messages from the log database (deprecated, will be removed during 2nd half of 2024).
Metric relating to Butler SOS itself (i.e. not retrieved from Sense).
General health metrics
A shared set of tag keys are available for all general health metrics:
Tag key
Description
host
Host name, taken from config file’s Butler-SOS.serversToMonitor.servers[].host property. Usually a fully qualified host name, or in some cases an IP address.
server_name
Human readable/friendly server name, taken from config file’s Butler-SOS.serversToMonitor.servers[].serverName property.
server_description
Description of the server, taken from config file’s Butler-SOS.serversToMonitor.servers[].serverDescription property.
In addition to the above, all tags defined in the YAML config file for the servers will be included as tag keys.
An array of GUIDs of active apps. Empty if no apps are active. An app is active when a user is currently performing some action on it.
active_docs_count
integer
Number of currently active apps
active_docs_names
string
Names of currently active (non-session) apps
active_session_docs_names
string
Names of currently active session apps
in_memory_docs
string
An array of the GUIDs of all apps currently loaded into the memory, even if they do not have any open sessions or connections to it. The apps disappear from the list when the engine has purged them out from memory.
in_memory_docs_count
integer
Number of apps currently in memory
in_memory_docs_names
string
Names of (non-session) apps currently in memory
in_memory_session_docs_names
string
Names of session apps currently in memory
loaded_docs
string
An array of the GUIDs of apps currently loaded into memory and that have open sessions or connections. Empty if no apps are loaded.
loaded_docs_count
integer
Number of currently loaded apps
loaded_docs_names
string
Names of currently loaded (non-session) apps
loaded_session_docs_names
string
Names of currently loaded session apps
calls
integer
Number of calls to the Qlik associative engine since it started
selections
integer
Number of selections made in Qlik associative engine since it started
Number of active engine sessions. A session is active when a user is currently performing some action on an app, for example, making selections or creating content.
Number of users currently doing something in some app.
total
integer
Number of users with established sessions to the Sense server.
User session details
User session metrics have slightly different tag keys depending on the granularity level of the metric - those metrics are therefore listed under each heading below.
Total number of sessions, per server and virtual proxy.
session_user_id_list
string
List of user IDs with sessions, per server and virtual proxy. NOTE: A single user may have more than one session open to a particular server/virtual proxy.
Tag keys:
Tag key
Description
host
Host name, taken from config file’s Butler-SOS.serversToMonitor.servers[].host property. Usually a fully qualified host name, or in some cases an IP address.
server_name
Human readable/friendly server name, taken from config file’s Butler-SOS.serversToMonitor.servers[].serverName property.
server_description
Description of the server, taken from config file’s Butler-SOS.serversToMonitor.servers[].serverDescription property.
user_session_host
Host name the session metrics are associated with.
user_session_virtual_proxy
Virtual proxy name the session metrics are associated with.
Session GUID, uniquely identifying the session in the entire Sense cluster.
user_directory
string
Session user’s user directory.
user_id
string
Session user ID
Tag keys:
Tag key
Description
host
Host name, taken from config file’s Butler-SOS.serversToMonitor.servers[].host property. Usually a fully qualified host name, or in some cases an IP address.
server_name
Human readable/friendly server name, taken from config file’s Butler-SOS.serversToMonitor.servers[].serverName property.
server_description
Description of the server, taken from config file’s Butler-SOS.serversToMonitor.servers[].serverDescription property.
user_session_host
Host name the session metrics are associated with.
user_session_virtual_proxy
Virtual proxy name the session metrics are associated with.
user_session_id
Session GUID
user_session_user_directory
User’s user directory
user_session_user_id
User ID
Event counters
Event counters are used to count the number of events received from Sense.
The measurement name is configured in the Butler SOS YAML config file, Butler-SOS.qlikSenseEvents.eventCount.influxdb.measurementName.
Tag key
Description
event_type
Type of event. log or user.
host
Host name of the Sense server generating the event.
source
Source system within Sense that caused the event. Examples: qseow-scheduler, qseow-proxy, qseow-engine, qseow-repository
subsystem
Subsystem where the event originated. More granular than source. Example: System.Scheduler.Scheduler.Master.Task.TaskSession
Static tags defined in the config file, Butler-SOS.qlikSenseEvents.eventCount.influxdb.tags, are also added to the InfluxDB datapoints.
Field key
Description
counter
Number of events received.
Unrecognized events
Unrecognized events are events that Butler SOS receives from Sense, but that do not have a valid source (qseow-scheduler, qseow-proxy, qseow-engine, qseow-repository etc).
These events will get a event_type of user or log based on what UDP port they arrived on.
The source, host and subsystem tags will be set to Unknown.
User events
User events capture real-time events in Qlik Sense as they happen.
They originate from Sense’s log4net logging framework and are forwarded from Sense to Butler SOS by means of XML log appenders in Sense.
These events are also forwarded as MQTT messages, allowing other systems to act when warnings/errors/fatals occur in Qlik Sense.
The following user events are handled by Butler SOS:
Session start
Session stop
Connection open
Connection close.
Measurement: user_events
Tag keys present for all user_events records:
Tag key
Description
event_action
Indicates what the event is about. Examples: Start session, Stop session, Open connection, Close connection.
host
Host name as reported in Qlik Sense’s proxy log files.
origin
Textual description of what caused the event. Can for example be AppAccess, which means a user opened or closed a browser tab with a Sense app in it.
userDirectory
Sense user directory of the user causing the event.
userId
Sense user ID for the user causing the event.
userFull
The combination of userDirectory and userId.
If the user event includes browser user agent information, the following tags will be present:
Tag key
Description
uaBrowserName
Name of connecting user’s browser.
uaBrowserMajorVersion
Connecting user’s browser version.
uaOsName
Connecting user’s operating system.
uaOsVersion
Connecting user’s operating system version.
In addition to the above tags defined in the Butler SOS config file will be added.
More info here.
Fields:
Field key
Description
appId
Id of app that is opened/closed.
appName
Name of app that is opened/closed.
userFull
Same as the userFull tag.
userId
Same as the userId tag.
Log events
Log events are used to capture warning, error and fatal messages in Sense. Once in Butler SOS these events are stored in InfluxDB (enabling Grafana dashboards).
These events are also forwarded as MQTT messages, allowing other systems to act when warnings/errors/fatals occur in Qlik Sense.
There is only one measurement for log events. It’s simply called log_event.
Different QSEoW services (Qlik Sense Enterprise on Windows) will send different tags and metrics in the log events.
Each variant is described below.
This modular approach to log events makes it possible to extend Butler SOS’ with additional log events if/when needed..
Note 1: Static tags are added as for all log events, as defined in the config file, Butler-SOS.logEvents.tags.
Note 2: If log event categorization is enabled in the YAML config file, the categories defined there will be added as tags to the log event data points written to InfluxDB.
Source: Proxy service
Events such as failed login attempts will be sent from the proxy service.
Proxy log events have these tags:
Tag key
Description
host
Host name as reported in Qlik Sense’s log files.
level
Sense log level. Possible values are WARN, ERROR, FATAL.
log_row
Row number in Sense log file where the event can be found. Useful if you after all have to dig into the log files.
result_code
Result code as reported by the Sense source system that caused the event. Its meaning will differ depending on where the event originated.
source
Source system within Sense that caused the event. Examples: qseow-scheduler, qseow-proxy, qseow-repository
subsystem
Subsystem where the event originated. More granular than source. Example: System.Scheduler.Scheduler.Master.Task.TaskSession
user_directory
Sense user directory of the user causing the event. Example: MYCOMPANY
user_id
Sense user ID for the user causing the event. Example: joe
user_full
The combination of user_directory and user_id. Example: MYCOMPANY\joe
Fields in proxy log events:
Field key
Description
command
Description of what caused the event, as found in the Sense logs. Example: Login:TryLogin
context
In what context (if one exists) the event occurred. If no context is available Not available will be used.
exception_message
If a serious problem/exception occurs the associated message is available here.
message
Description of what the event is about. Example: Login failed for user 'LAB\\goran' wrong credentials?
origin
Example: qseow-repository.
raw_event
The raw event message as received from QSEoW. Described here.
result_code
Example: 500
The raw_event is the actual log event message sent from QSEoW to Butler SOS.
It has the following components:
Part of message
Description
command
Description of what caused the event, as found in the Sense logs. Example: Login:TryLogin
context
In what context (if one exists) the event occurred. If no context is available Not available will be used.
exception_message
If a serious problem/exception occurs the associated message is available here.
host
Host name as reported in Qlik Sense’s log files.
level
Sense log level. Possible values are WARN, ERROR, FATAL.
log_row
Row number in Sense log file where the event can be found. Useful if you after all have to dig into the log files.
message
Description of what the event is about. Example: Login failed for user 'LAB\\goran' wrong credentials?
origin
Party of the proxy service the event originated from. Rarely used by Sense.
result_code
Result code as reported by the Sense source system that caused the event. Its meaning will differ depending on where the event originated. Example: 500
source
Source system within Sense that caused the event. Examples: qseow-scheduler, qseow-proxy, qseow-repository
subsystem
Subsystem where the event originated. More granular than source. Example: System.Scheduler.Scheduler.Master.Task.TaskSession
tags
User defined tags. Set in the main YAML config file. Example: {"env":"DEV","foo":"bar"}
ts_iso
Timestamp (ISO format) when the event occurred, according to QSEoW. Example: 20211126T214006.122+0100
ts_local
Event timestamp (time format of Sense server). Example: 2021-11-26 21:40:06,122
user_directory
Sense user directory of the user causing the event. Example: MYCOMPANY
user_full
The combination of user_directory and user_id. Example: MYCOMPANY\joe
user_id
Sense user ID for the user causing the event. Example: joe
windows_user
Windows account used to run the proxy QSEoW Windows service. Example: LAB\\qlikservice
Source: Scheduler service
Events such as failed reload tasks will be sent from the scheduler service.
Scheduler log events have these tags:
Tag key
Description
host
Host name as reported in Qlik Sense’s log files.
level
Sense log level. Possible values are WARN, ERROR, FATAL.
log_row
Row number in Sense log file where the event can be found. Useful if you after all have to dig into the log files.
source
Source system within Sense that caused the event. Examples: qseow-scheduler, qseow-proxy, qseow-repository
subsystem
Subsystem where the event originated. More granular than source. Example: System.Scheduler.Scheduler.Master.Task.TaskSession
user_directory
Sense user directory of the user causing the event. Example: MYCOMPANY
user_id
Sense user ID for the user causing the event. Example: joe
user_full
The combination of user_directory and user_id. Example: MYCOMPANY\joe
task_id
Task ID (if a task is involved in the event, for example task failing). Example: 58dd8322-e39c-4b71-b74e-13c47a2f6dd4
task_name
Task name (if a task is involved in the event). Example: Reload task of Meetup.com
Fields in scheduler log events:
Field key
Description
app_id
Application ID (if an app is involved in the event). Example: deba4bcf-47e4-472e-97b2-4fe8d6498e11
app_name
Application name (if an app is involved in the event). Example: Meetup.com
exception_message
If a serious problem/exception occurs the associated message is available here.
execution_id
ID identifying a particular task execution. Example: 67a56c3b-2e20-4df8-ad1b-e48de28e1bfa
message
Description of what the event is about. Example: Login failed for user 'LAB\\goran' wrong credentials?
raw_event
The raw event message as received from QSEoW. Described here.
The raw_event is the actual log event message sent from QSEoW to Butler SOS.
It has the following components:
Part of message
Description
app_id
Application ID (if an app is involved in the event). Example: deba4bcf-47e4-472e-97b2-4fe8d6498e11
app_name
Application name (if an app is involved in the event). Example: Meetup.com
exception_message
If a serious problem/exception occurs the associated message is available here.
execution_id
ID identifying a particular task execution. Example: 67a56c3b-2e20-4df8-ad1b-e48de28e1bfa
host
Host name as reported in Qlik Sense’s log files.
level
Sense log level. Possible values are WARN, ERROR, FATAL.
log_row
Row number in Sense log file where the event can be found. Useful if you after all have to dig into the log files.
message
Description of what the event is about. Example: Login failed for user 'LAB\\goran' wrong credentials?
source
Source system within Sense that caused the event. Example: qseow-scheduler
subsystem
Subsystem where the event originated. More granular than source. Example: System.Scheduler.Scheduler.Slave.Tasks.ReloadTask
tags
User defined tags. Set in the main YAML config file. Example: {"env":"DEV","foo":"bar"}
task_id
Task ID (if a task is involved in the event, for example task failing). Example: 58dd8322-e39c-4b71-b74e-13c47a2f6dd4
task_name
Task name (if a task is involved in the event). Example: Reload task of Meetup.com
ts_iso
Timestamp (ISO format) when the event occurred, according to QSEoW. Example: 20211126T214006.122+0100
ts_local
Event timestamp (time format of Sense server). Example: 2021-11-26 21:40:06,122
user_directory
Sense user directory of the user causing the event. Example: MYCOMPANY
user_full
The combination of user_directory and user_id. Example: MYCOMPANY\joe
user_id
Sense user ID for the user causing the event. Example: joe
windows_user
Windows account used to run the proxy QSEoW Windows service. Example: LAB\\qlikservice
Source: Repository service
The repository service is the hub around which the rest of Qlik Sense revolves.
As such it emit events in many different situations. One example can be when a Sense node is offline (this example is used in the field description below).
Repository log events have these tags:
Tag key
Description
host
Host name as reported in Qlik Sense’s log files.
level
Sense log level. Possible values are WARN, ERROR, FATAL.
log_row
Row number in Sense log file where the event can be found. Useful if you after all have to dig into the log files.
source
Source system within Sense that caused the event. Examples: qseow-scheduler, qseow-proxy, qseow-repository
subsystem
Subsystem where the event originated. More granular than source. Example: System.Scheduler.Scheduler.Master.Task.TaskSession
result_code
Result code as reported by the Sense source system that caused the event. Its meaning will differ depending on where the event originated.
user_directory
Sense user directory of the user causing the event. Example: MYCOMPANY
user_id
Sense user ID for the user causing the event. Example: joe
user_full
The combination of user_directory and user_id. Example: MYCOMPANY\joe
Fields in scheduler log events:
Field key
Description
command
Description of what caused the event, as found in the Sense logs. Example: Login:TryLogin
context
In what context (if one exists) the event occurred. If no context is available Not available will be used.
exception_message
If a serious problem/exception occurs the associated message is available here.
message
Description of what the event is about. Example: Login failed for user 'LAB\\goran' wrong credentials?
origin
Example: qseow-repository.
raw_event
The raw event message as received from QSEoW. Described here.
result_code
Example: 500
The raw_event is the actual log event message sent from QSEoW to Butler SOS.
It has the following components:
Part of message
Description
command
Description of what caused the event, as found in the Sense logs. Example: Check service status
context
In what context (if one exists) the event occurred. If no context is available Not available will be used. Example: /qps/servicestatusworker
exception_message
If a serious problem/exception occurs the associated message is available here.
host
Host name of event source, as reported in Qlik Sense’s log files. Example: pro2-win1
level
Sense log level. Possible values are WARN, ERROR, FATAL.
log_row
Row number in Sense log file where the event can be found. Useful if you after all have to dig into the log files. Example: 7296
message
Description of what the event is about. Example: Method: 'SendRimQrsStatusRequest'. Failed to retrieve service status from 'http://pro2-win3.lab.ptarmiganlabs.net:4444/status/'. Server host 'pro2-win3.lab.ptarmiganlabs.net'. Error message: 'Unable to connect to the remote server'
origin
Part of the proxy service the event originated from. Rarely used by Sense.
result_code
Result code as reported by the Sense source system that caused the event. Its meaning will differ depending on where the event originated. Example: 500
source
Source system within Sense that caused the event. Example: qseow-repository
subsystem
Subsystem where the event originated. More granular than source. Example: Service.Repository.Repository.Core.Status.ServiceStatusWorker
tags
User defined tags. Set in the main YAML config file. Example: {"env":"DEV","foo":"bar"}
ts_iso
Timestamp (ISO format) when the event occurred, according to QSEoW. Example: 20211128T201538.508+0100
ts_local
Event timestamp (time format of Sense server). Example: 2021-11-28 20:15:38,508
user_directory
Sense user directory of the user causing the event. Example: MYCOMPANY
user_full
The combination of user_directory and user_id. Example: MYCOMPANY\joe
user_id
Sense user ID for the user causing the event. Example: joe
windows_user
Windows account used to run the proxy QSEoW Windows service. Example: LAB\\qlikservice
Source: Engine service (errors and warnings)
The associative engine (the “QIX” engine) is the core of Qlik Sense. This is where the magic happens, all the calculations and selections in apps are ultimately done here.
Engine log events have these tags:
Tag key
Description
host
Host name as reported in Qlik Sense’s log files.
level
Sense log level. Possible values are WARN, ERROR, FATAL.
log_row
Row number in Sense log file where the event can be found. Useful if you after all have to dig into the log files.
result_code
Result code as reported by the Sense source system that caused the event. Its meaning will differ depending on where the event originated.
source
Source system within Sense that caused the event. Examples: qseow-scheduler, qseow-proxy, qseow-repository
subsystem
Subsystem where the event originated. More granular than source. Example: System.Scheduler.Scheduler.Master.Task.TaskSession
user_directory
Sense user directory of the user causing the event. Example: MYCOMPANY
user_id
Sense user ID for the user causing the event. Example: joe
user_full
The combination of user_directory and user_id. Example: MYCOMPANY\joe
windows_user
Windows account used to run the engine QSEoW Windows service. Example: LAB\\qlikservice
task_id
Task ID (if a task is involved in the event, for example task failing). Example: 58dd8322-e39c-4b71-b74e-13c47a2f6dd4
task_name
Task name (if a task is involved in the event). Example: Reload task of Meetup.com
app_id
Application ID (if an app is involved in the event). Example: deba4bcf-47e4-472e-97b2-4fe8d6498e11
app_name
Application name (if an app is involved in the event). Example: Meetup.com
engine_exe_version
Version of the QIX engine executable.
Fields in engine log events:
Field key
Description
command
Description of what caused the event, as found in the Sense logs. Example: Login:TryLogin
context
In what context (if one exists) the event occurred. If no context is available Not available will be used.
exception_message
If a serious problem/exception occurs the associated message is available here.
message
String. Description of what the event is about. Example: Login failed for user 'LAB\\goran' wrong credentials?
origin
Part of the engine service the event originated from. Rarely used by Sense.
raw_event
The raw event message as received from QSEoW.
session_id
Engine session ID.
result_code
Result code as reported by the Sense source system that caused the event. Its meaning will differ depending on where the event originated. Example: 500
Source: Engine service (performance related events)
Performance log events are used to capture performance related events from the associative/QIX engine.
Due to the potentially large number of performance log events, these can be filtered by Butler SOS.
Accepted and rejected performance log events are stored in InfluxDB in slightly different ways.
Accepted performance log events
Tag key
Description
host
The hostname of the Sense server that generated the event.
level
The log level of the event. Always INFO for performance log events.
source
The source of the event. Always qseow-qix-perf for performance log events.
log_row
The log row number as created by Sense’s logging framework.
subsystem
The subsystem that generated the event. Always QixPerformance.Engine.Engine for performance log events.
method
The engine method that generated the performance data. Global::GetProgress, GenericObject::GetLayout, Global::OpenApp etc
object_type
The type of object that the performance data is about. table, barchart, sheet, CurrentSelection etc.
proxy_session_id
The ID of the proxy session that generated the event. Will be a GUID for user sessions, 0 for internal work done by Sense.
session_id
The ID of the engine session that generated the event.
| user_full | The full name of the user that generated the event. <user id> |
| user_directory | The user directory of the user that generated the event. |
| user_id | The user ID of the user that generated the event. |
| app_id | The GUID of the app that the performance data is from. |
| app_name | The name of the app that the performance data is from, if available. Blank if not. |
| object_id | The ID of the app object that the performance data is about. |
Field key
Description
app_id
String. The GUID of the app that the performance data is from.
process_time
Float. The amount of time that was needed to process the request. Milliseconds.
work_time
Float. The amount of time that the request did actual work. Milliseconds.
lock_time
Float. The amount of time that the request had to wait for an internal lock. Milliseconds.
validate_time
Float. The amount of time that the request used for validation. Milliseconds.
traverse_time
Float. The amount of time the request uses for the traverse part of the calculation. Milliseconds.
handle
String. The ID of the interface that handled the request. The interface can be Global, a certain sheet, a certain object, or similar.
net_ram
Integer. The amount of memory used for the calculation. Bytes.
peak_ram
Integer. The peak amount of memory used for the calculation. Bytes.
raw_event
JSON. The raw event data in JSON format. Useful together with the log chart type in Grafana.
For rejected performance log events, the individual events are not stored in InfluxDB.
Instead, counters are used to keep track of how many events were rejected, broken down by a set of tags.
Tag name
Description
source
Name of the event. Always qseow-qix-perf for rejected performance log events.
app_id
The GUID of the app that the performance data is from.
app_name
The name of the app that the performance data is from, if available. Blank if not.
method
The engine method that generated the performance data. Global::GetProgress, GenericObject::GetLayout, Global::OpenApp etc
object_type
The type of object that the performance data is about. table, barchart, sheet, CurrentSelection etc.
A separate set of tags are added to the rejected performance log events.
These tags are defined in the config file, Butler-SOS.logEvents.enginePerformanceMonitor.trackRejectedEvents.tags.
Field key
Description
counter
Integer. The number of rejected performance log events.
process_time
Float. The amount of time that was needed to process the request. Milliseconds.
Messages from the log database
All log data written to InfluxDB share a common set of tag keys:
Tag key
Description
host
Host name, taken from config file’s Butler-SOS.serversToMonitor.servers[].host property. Usually a fully qualified host name, or in some cases an IP address.
server_name
Human readable/friendly server name, taken from config file’s Butler-SOS.serversToMonitor.servers[].serverName property.
server_description
Description of the server, taken from config file’s Butler-SOS.serversToMonitor.servers[].serverDescription property.
log_level
The logging level of the log event (ERROR, WARNING, INFO etc).
source_process
Which Sense service the log event originated in.
Measurement: log_event_logdb
Source: More or less log db. A query is done to the log db in Postgres, the results are stored in InfluxDB. There is thus no Qlik API call per se.
Field key
Type
Description
message
string
Log entry as retrieved from the Sense log database (Postgres).
Butler SOS metrics
Measurement: butlersos_memory_usage
These metrics tell you how much memory Butler SOS itself uses.
More info on these metrics and what they mean is available here.
Field key
Type
Description
heap_total
float
Total size of the allocated heap.
heap_used
float
Actual memory used during the execution of Butler SOS.
process_memory
float
Total memory allocated for the execution of Butler SOS.
5.3.2 - Available Metrics: New Relic
Once data has been sent to New Relic, its web based user interface makes it very intuitive to both create charts and combine these into dashboards.
New Relic
New Relic offers a complete SaaS observability stack, ranging from high-volume ingestion of events/metrics/logs/traces to advanced dashboards that can be created ad-hoc using a web UI or from files and templates, for more of an infrastructure-as-code approach.
Storing metrics in New Relic is not mandatory, but some kind of metrics storage - either in New Relic, InfluxDB or Prometheus - is needed to take full benefit of Butler SOS’ features.
In order to view data in New Relic you first have to send data to them.
Butler SOS does this for you.
Furthermore, you can to a large degree control which Qlik Sense metrics, logs and events are sent to New Relic.
Data volumes and pricing
At the time of this writing New Relic offers a generous free plan.
It will be a great starting point for everyone, if there’s a need for more dashboard users etc the account can be upgraded as needed.
In most cases Butler SOS will not generate a lot of data and you can stay within New Relic’s free tier.
The amount of data generated by Sense health metrics and Butler SOS uptime metrics is very small indeed, but if your Qlik Sense environment for some reason generate a lot of log events that can cause the data volumes to increase rapidly.
For example, if a user connects to Sense and gets a https certificate warning in the browser, this will also cause a number of warnings and errors in the proxy logs. Multiple this by X users and there can suddenly be thousands of errors and warnings per hour in the Sense logs.
If these are also sent to New Relic the data volumes increase quickly.
Overview of New Relic
New Relic is similar to InfluxDB in that Butler SOS pushes data to both systems.
The basic concepts are
Metrics represent a measurement of some kind. Number or sessions in the Sense proxy, amount of free RAM on a Sense server etc.
Events are something that happened. Warnings and errors in the Sense log files can be forwarded to New Relic as events.
Various user activities (user session start/stop etc) in Sense can also be sent to New Relic as events.
Attributes are conceptually tags that are attached to metrics or events. These act as dimensions for the data.
Metrics in visualizations can be grouped by attributes, much in the same way Qlik Sense measurements are grouped by dimensions in Sense charts and tables.
Static attributes are defined in Butler SOS’ config file.
Dynamic attributes are determined at runtime.
In addition to the above these data formats exist but are not currently used by Butler SOS. This may change in the future.
Logs are essentially regular lines in a log file, consisting of several fields.
Distributed tracing collects data as requests travel from one service to another, recording each segment of the journey as a span.
These spans contain important details about each segment of the request and are eventually combined into one trace.
The completed trace gives you a picture of the entire request.
5.3.3 - Available Metrics: Prometheus
In order to create graphs in for example Grafana, you must understand what metrics are available and how they are structured.
Prometheus
Metrics retrieved from the Sense servers can be stored in Prometheus. You don’t have to be a Prometheus expert to use Butler SOS, but understanding some basic concepts are helpful.
Storing metrics in Prometheus is not mandatory, but some kind of metrics storage - either in Prometheus, InfluxDB or New Relic - is needed to take full benefit of Butler SOS’ features.
Prometheus gathers metrics by “scraping” data from web pages (“endpoints”) on which metrics are displayed in a well specified format.
Most metrics from the Sense servers are exposed on a Prometheus compatible endpoint, but not all.
InfluxDB is more flexible for some types of data, while Prometheus provides more easily used features for data aggregation when data should be displayed in Grafana.
Prometheus endpoint
Prometheus is enabled/disabled in the Butler-SOS.prometheus section in the config file.
Prometheus metrics are available on the /metrics URL on the IP and port specified in the config file.
For example, if the host is 0.0.0.0 and the port is 9842, Butler SOS will listen on port 9842 on all available network interfaces.
If the Butler SOS’ server’s IP address is 192.168.1.168, a call from a web browser can look like this:
This is the web page Prometheus will scrape and ingest into it’s time-series database.
Overview of Prometheus
In contrast to InfluxDB, to which Butler SOS pushes data, Prometheus works the other way around.
The Prometheus server is responsible for gathering data exposed by the systems that should be monitored (for example Butler SOS).
The basic concepts are
Metrics represent the measurements of interest. “fields” in InfluxDB.
Labels are used to categorize metrics (similar to tags in InfluxDB).
Labels
The labels available for all Prometheus metrics are:
Label name
Source
Description
host
Butler-SOS.serversToMonitor.servers[].host
Host IP or FQDN of the server from which the metric comes.
All tags defined in the config file will be added as Prometheus labels.
Metrics
Available metrics are similar to those in InfluxDB, with a few exceptions.
Prometheus is awesome when it comes to storing all kinds of measurements, but it doesn’t offer a good way to store strings.
For that reason Butler SOS metrics involving strings (for example list of apps loaded in memory) are not available on the Prometheus endpoint.
Most of the metrics come from Qlik Sense’ health check API.
Qlik Sense metrics
These are the Prometheus metrics exposed by Butler SOS:
Metric
Type
Description
butlersos_apps_calls
Gauge
Total number of requests made to the Qlik Sense engine.
butlersos_apps_selections
Gauge
Total number of selections made to the Qlik Sense engine.
butlersos_apps_activedocs_total
Gauge
Number of active apps. An app is active when a user is currently performing some action on it.
butlersos_apps_inmemorydocs_total
Gauge
Number of apps apps currently loaded into memory, even if they do not have any open sessions or connections to it. Apps disappear from this metric when the engine has purged them from memory.
butlersos_apps_loadeddocs_total
Gauge
Number of apps apps currently loaded into memory, that also have open sessions or connections.
butlersos_cache_added
Gauge
Number of cache objects added.
butlersos_cache_hits
Gauge
Number of cache hits.
butlersos_cache_lookups
Gauge
Number of cache lookups.
butlersos_cache_replaced
Gauge
Number of cache replaced cache objects.
butlersos_cache_saturated
Gauge
When the value is 1, the engine is running with high resource usage; otherwise the value is 0.
butlersos_cpu_total
Gauge
Percentage of the CPU used by the engine, averaged over a time period of 30 seconds.
butlersos_mem_committed
Gauge
The total amount of committed memory for the engine process in MB.
butlersos_mem_allocated
Gauge
The total amount of allocated memory (committed + reserved) from the operating system in MB.
butlersos_mem_free
Gauge
The total amount of free memory (minimum of free virtual and physical memory) in MB.
butlersos_session_active
Gauge
Number of active engine sessions. A session is active when a user is currently performing some action on an app, for example, making selections or creating content.
butlersos_session_total
Gauge
Total number of engine sessions.
butlersos_users_active
Gauge
Number of distinct active users. An active user is one who is currently performing an action on an app.
butlersos_users_total
Gauge
Total number of distinct users within the current engine sessions.
butlersos_engine_metadata
Gauge
Metadata about the Qlik Sense engine.
butlersos_user_session_total
Gauge
Number of sessions (as reported by the proxy service).
Node.js metrics
A set of Node.js specific metrics are also available on Butler SOS’ Prometheus endpoint.
These are described in the “Default metrics” section on this page.
6 - Security considerations
Security is important! Keep these things in mind when deploying Butler.
Security is a whole field in its own.
What’s considered secure in one company might be considered insecure in another.
It’s a good idea to review your tools and services every now and then, for example making sure they are updated to include the latest security patches etc.
When in doubt, be paranoid.
Security considerations
Security/Disclosure
If you discover a serious bug with Butler SOS that may pose a security problem, please disclose it confidentially to security@ptarmiganlabs.com first, so that it can be assessed and hopefully fixed prior to being exploited. Please do not raise GitHub issues for security-related doubts or problems.
Make sure to configure the firewall on the server where Butler SOS is running to only accept connections from the desired clients/IP addresses.
A reasonable first approach would be to configure the firewall to only allow calls from localhost. That way calls to/from Butler SOS can only be made from the server where Butler SOS itself is running.
If Butler SOS is not running on the Sense server, the IPs of the Sense servers should also be whitelisted in the firewall, of course.
The MQTT connections are not secured by certificates or passwords.
For use within a controlled network that might be fine, but nonetheless something to keep in mind. Adding certificate based authentication (which MQTT supports) would solve this.
Butler SOS uses various Node.js modules from npm. If concerned about security, you should review these dependencies and decide whether there are issues in them or not.
Same thing with Butler SOS itself - while efforts have been made to make Butler SOS secure, you need to decide for yourself whether the level of security is enough for your use case.
Butler SOS is continuously checked for security vulnerabilities by using GitHub security audit, Snyk, npm audit and other tools.
Butler SOS talking to Qlik Sense
Butler SOS uses https for all communication with Sense, using Sense’s certificates for authentication.
7 - Legal stuff
Information om licenses, personal integrity and more.
MIT License

Copyright (c) 2024 Göran Sander

Permission is hereby granted, free of charge, to any person obtaining a copy
of this software and associated documentation files (the "Software"), to deal
in the Software without restriction, including without limitation the rights
to use, copy, modify, merge, publish, distribute, sublicense, and/or sell
copies of the Software, and to permit persons to whom the Software is
furnished to do so, subject to the following conditions:

The above copyright notice and this permission notice shall be included in all
copies or substantial portions of the Software.

THE SOFTWARE IS PROVIDED "AS IS", WITHOUT WARRANTY OF ANY KIND, EXPRESS OR
IMPLIED, INCLUDING BUT NOT LIMITED TO THE WARRANTIES OF MERCHANTABILITY,
FITNESS FOR A PARTICULAR PURPOSE AND NONINFRINGEMENT. IN NO EVENT SHALL THE
AUTHORS OR COPYRIGHT HOLDERS BE LIABLE FOR ANY CLAIM, DAMAGES OR OTHER
LIABILITY, WHETHER IN AN ACTION OF CONTRACT, TORT OR OTHERWISE, ARISING FROM,
OUT OF OR IN CONNECTION WITH THE SOFTWARE OR THE USE OR OTHER DEALINGS IN THE
SOFTWARE.
Data collection
This documentation site was built using Hugo and consists of static web pages hosted on GitHub Pages.
GitHub probably keep log files for GitHub Pages, your visit to this documentation site is thus likely to be recorded there. For questions about such logs you should contact GitHub.
Analytics
Plausible is used to track general site usage.
The collected data is not shared with any third parties.
Aggregated data may be used to determine, and in some cases publicly communicate, how popular the site is.
Examples of aggregated metrics are how many users have visited the site and from where in the world they accessed the site.
Telemetry data
If enabled in the config file, Butler SOS will send anonymous telemetry data to PostHog, with data stored within the EU.
A detailed description of what’s included in the telemetry data is found here.
Ptarmigan Labs collects this information to better understand
what the execution environment looks like for Butler SOS out there, and
which Butler SOS features are used/not used
The purpose of the telemetry data is to aid in future development of Butler SOS, so focus be put on the most important features and execution environments.
If you want your historical telemetry data to be deleted, you must provide Ptarmigan Labs with the system ID mentioned in the logs when Butler SOS is starting.
This ID is what identifies your specific instance of Butler SOS.
Until you tell Ptarmigan Labs what your ID is there is no link between you and that ID.
The idea is simply that the anonymous telemetry should be just that: anonymous.
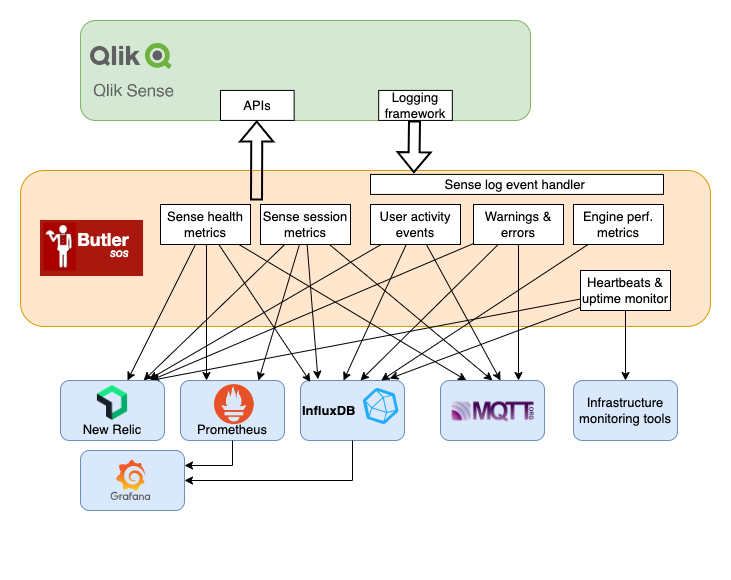


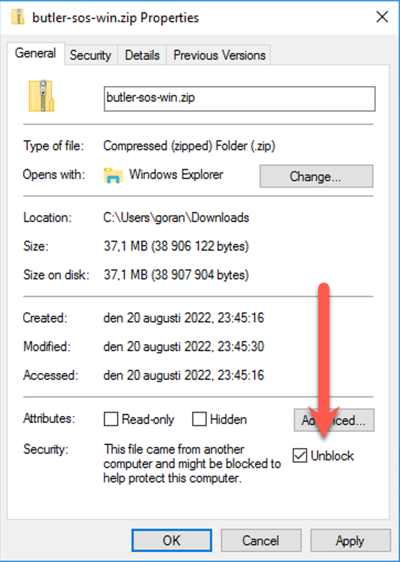
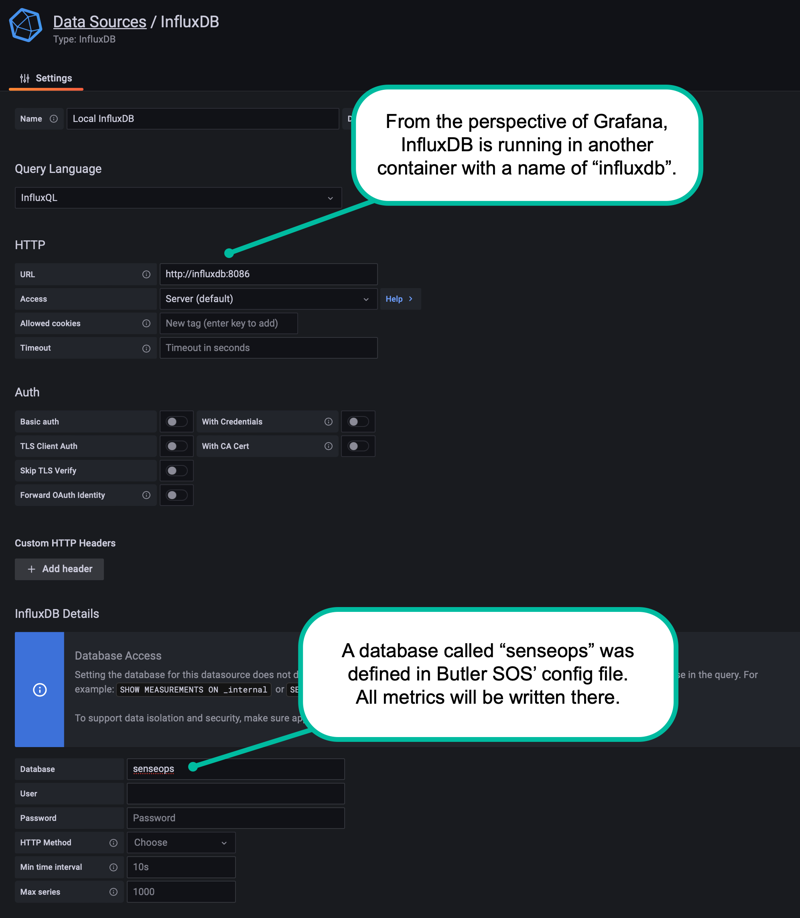
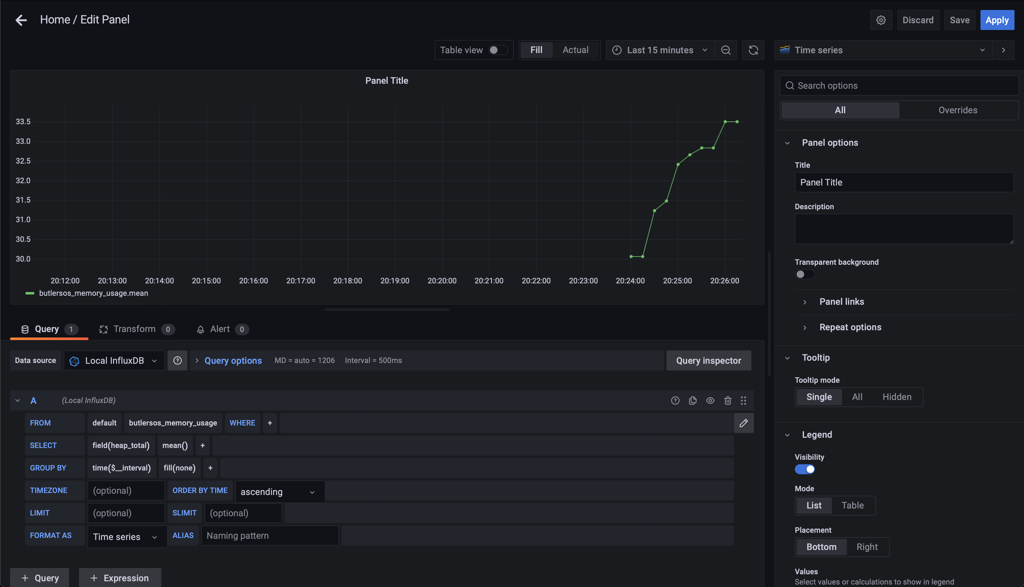
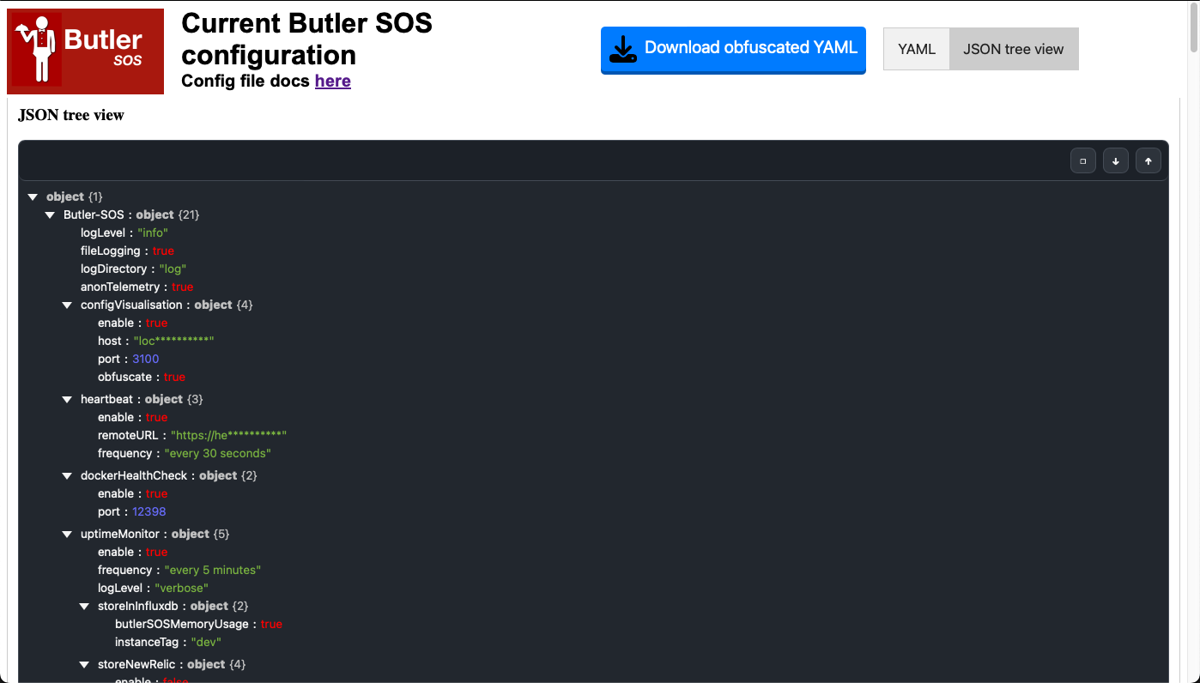
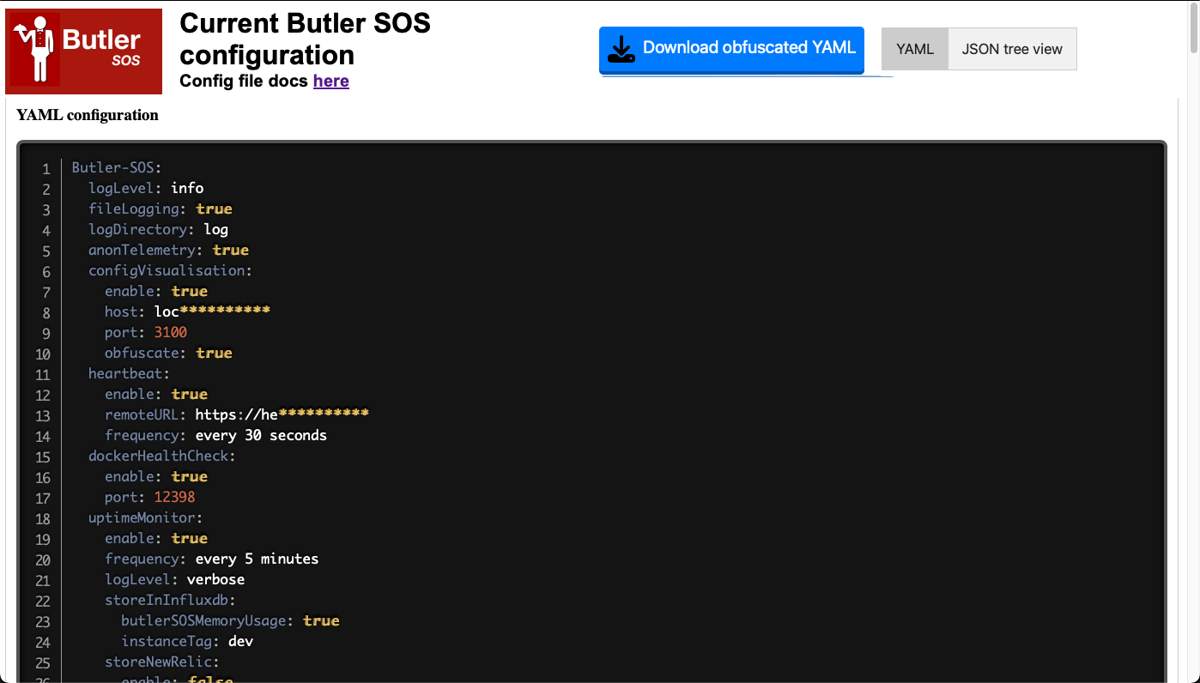
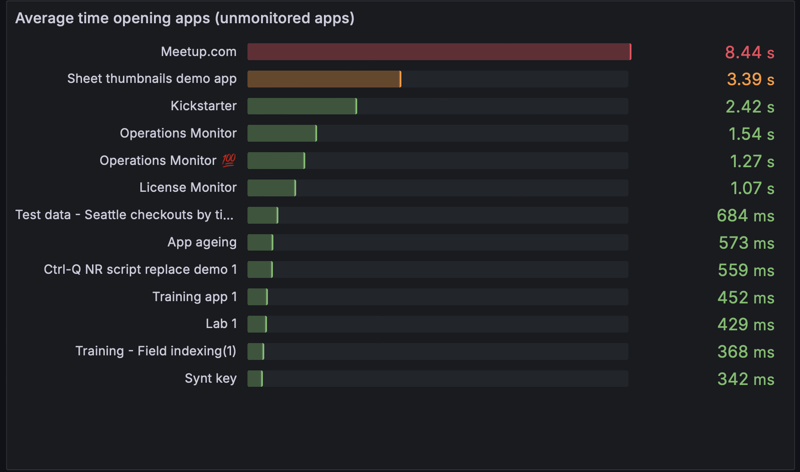
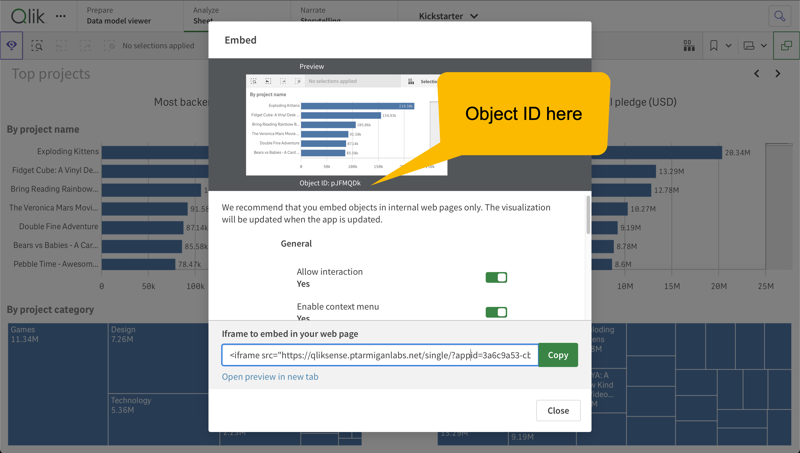
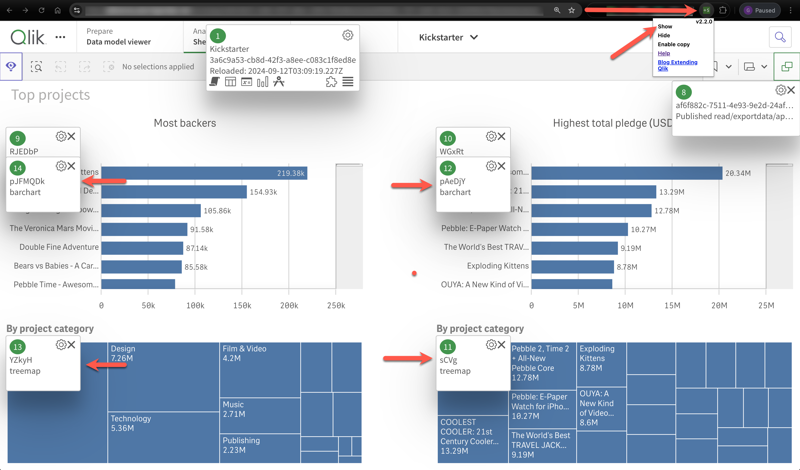


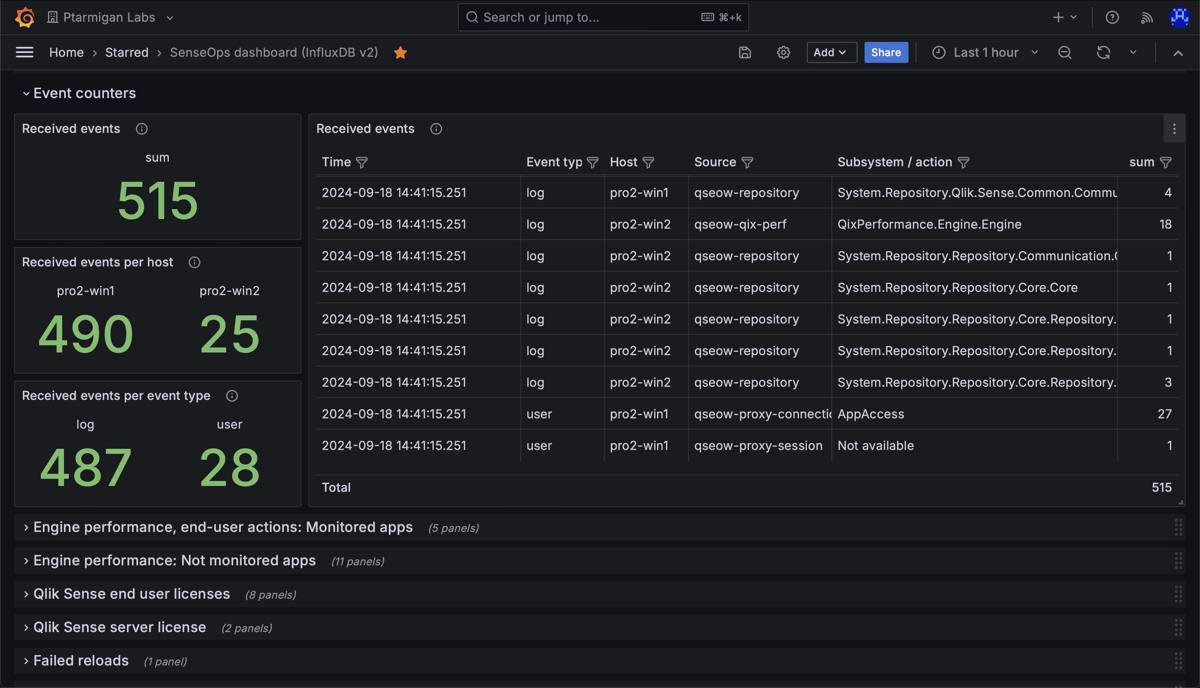

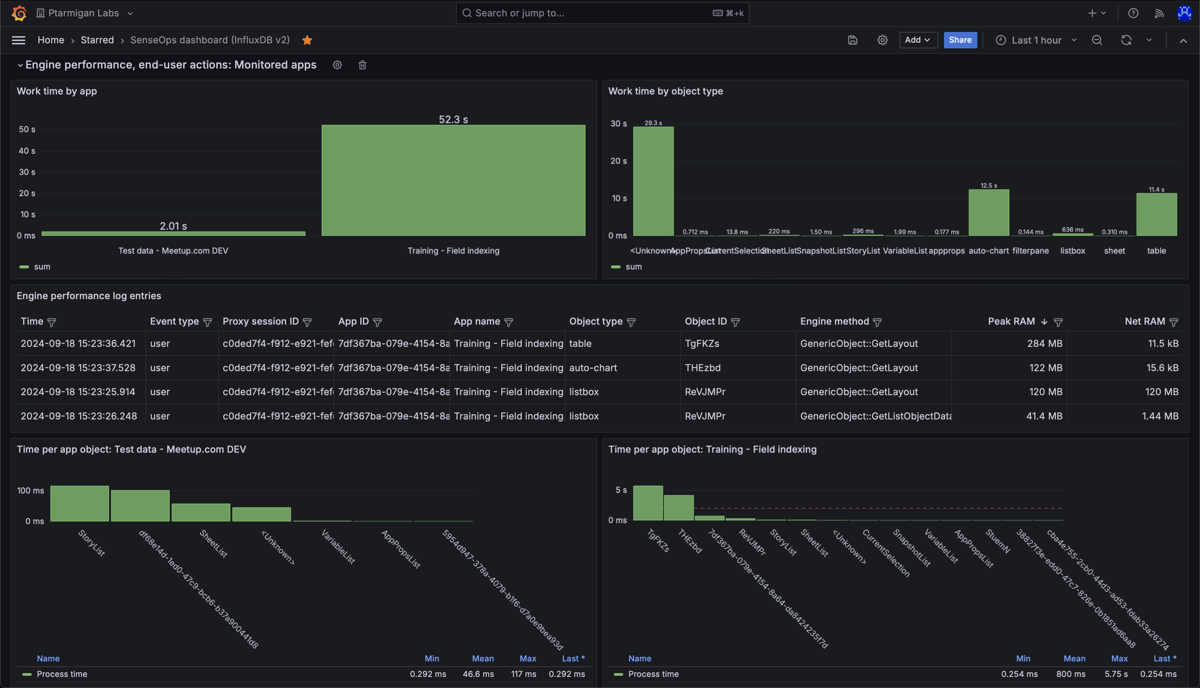


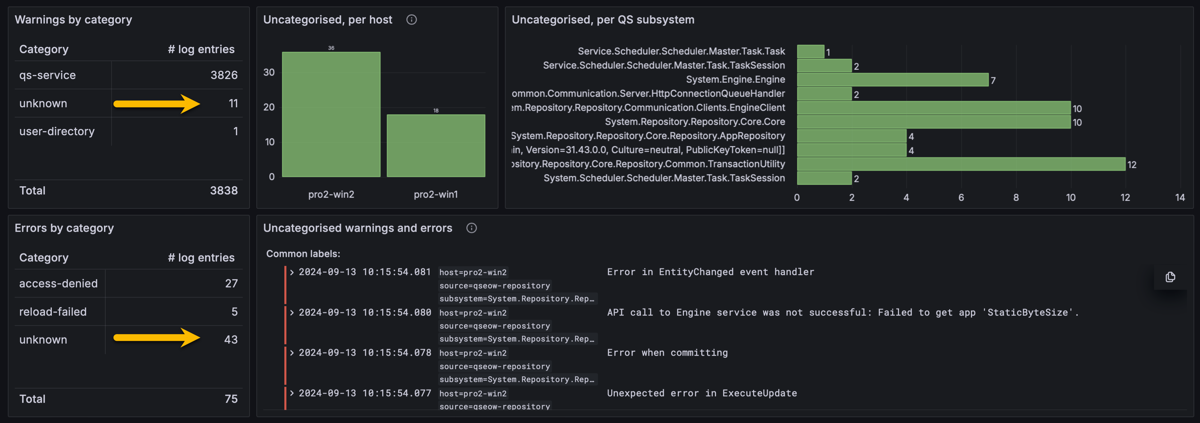
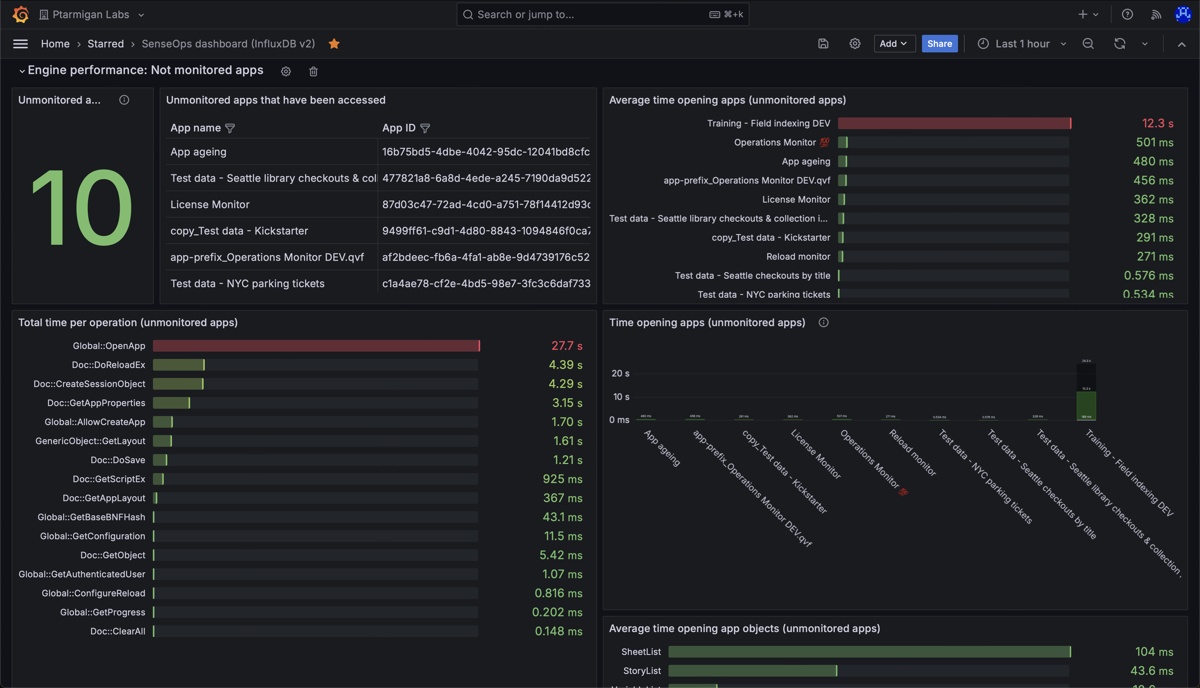


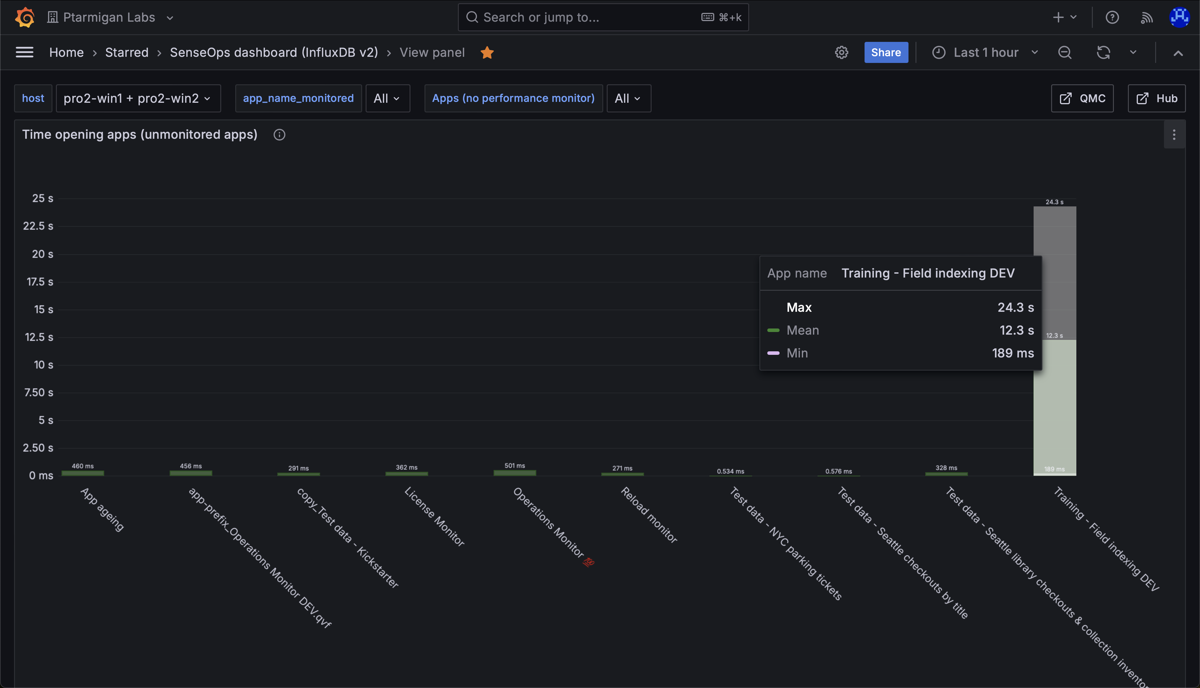

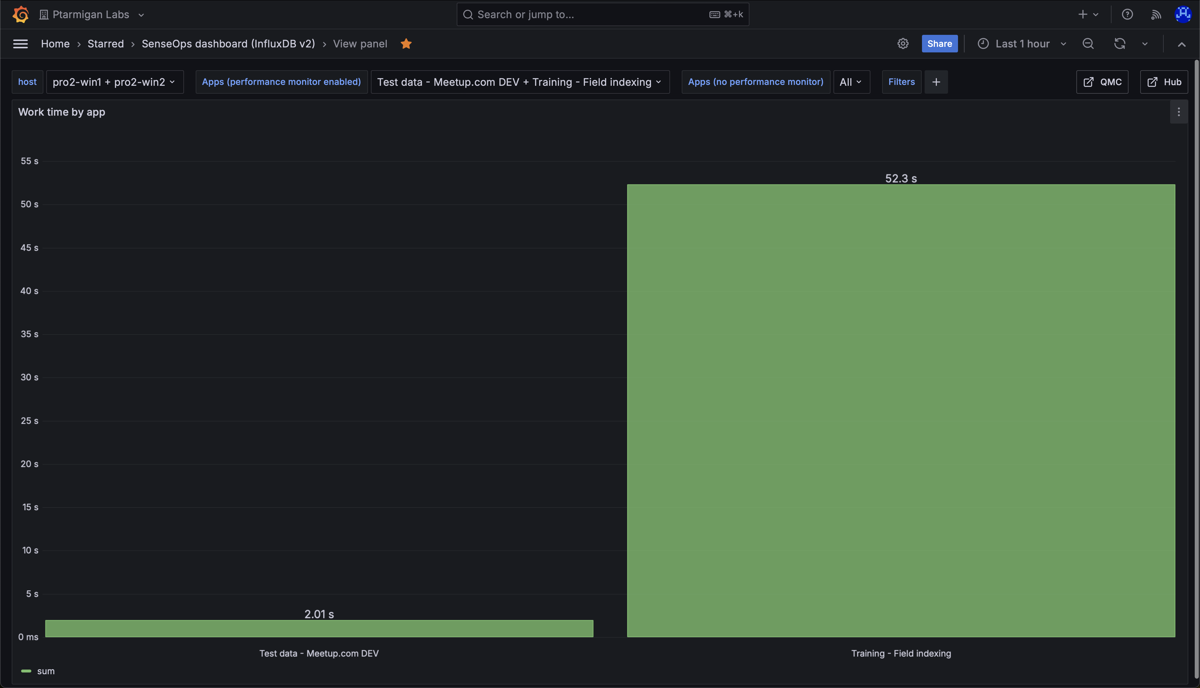
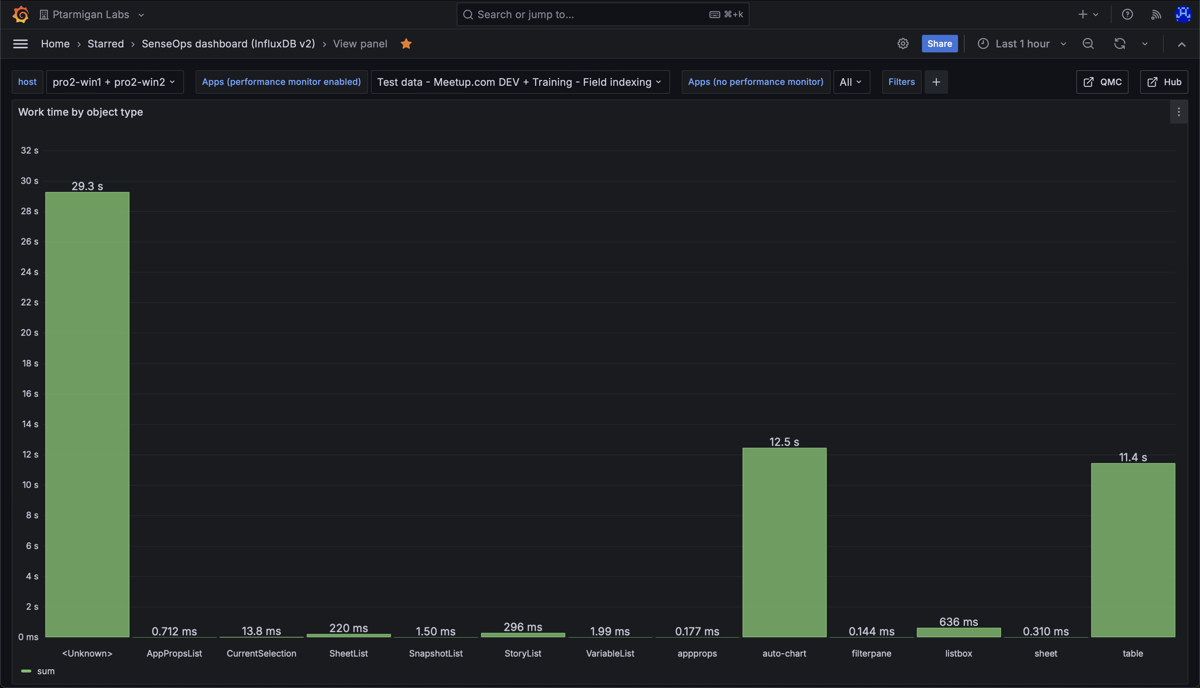
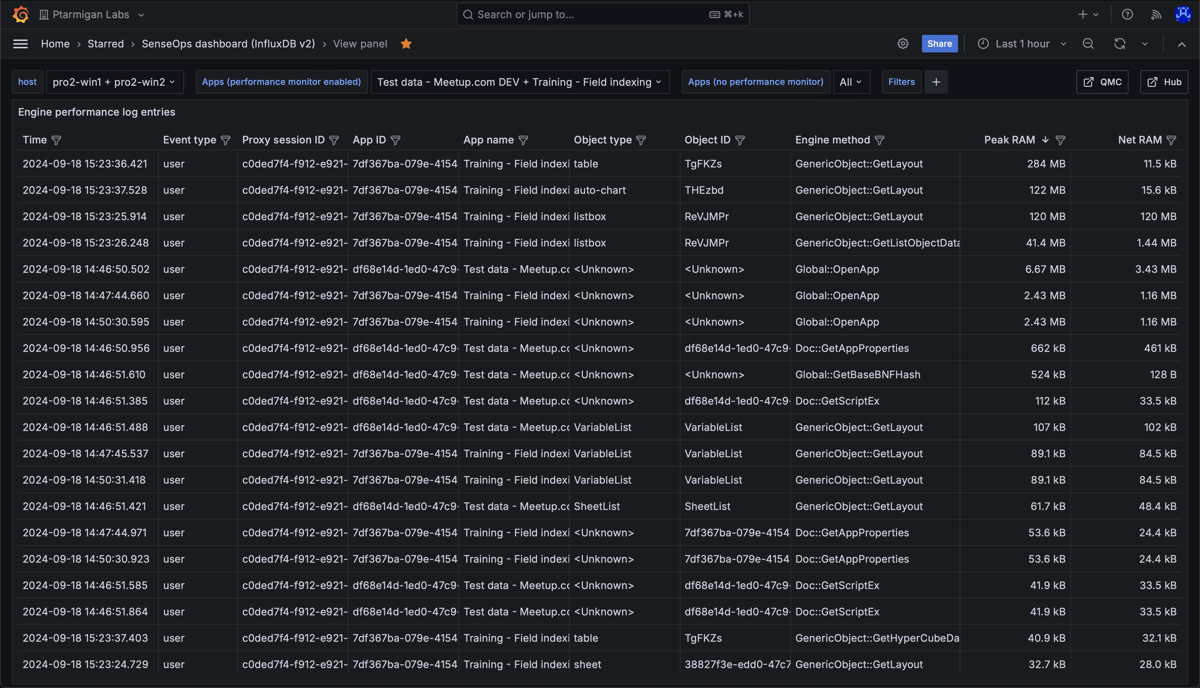
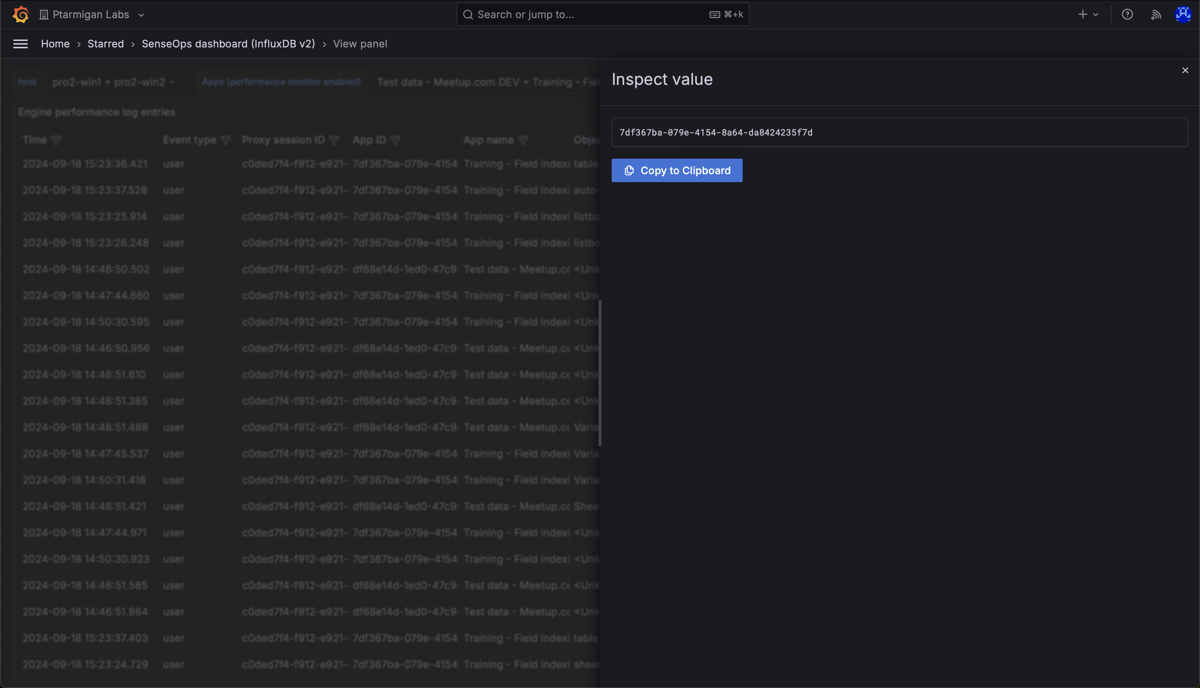
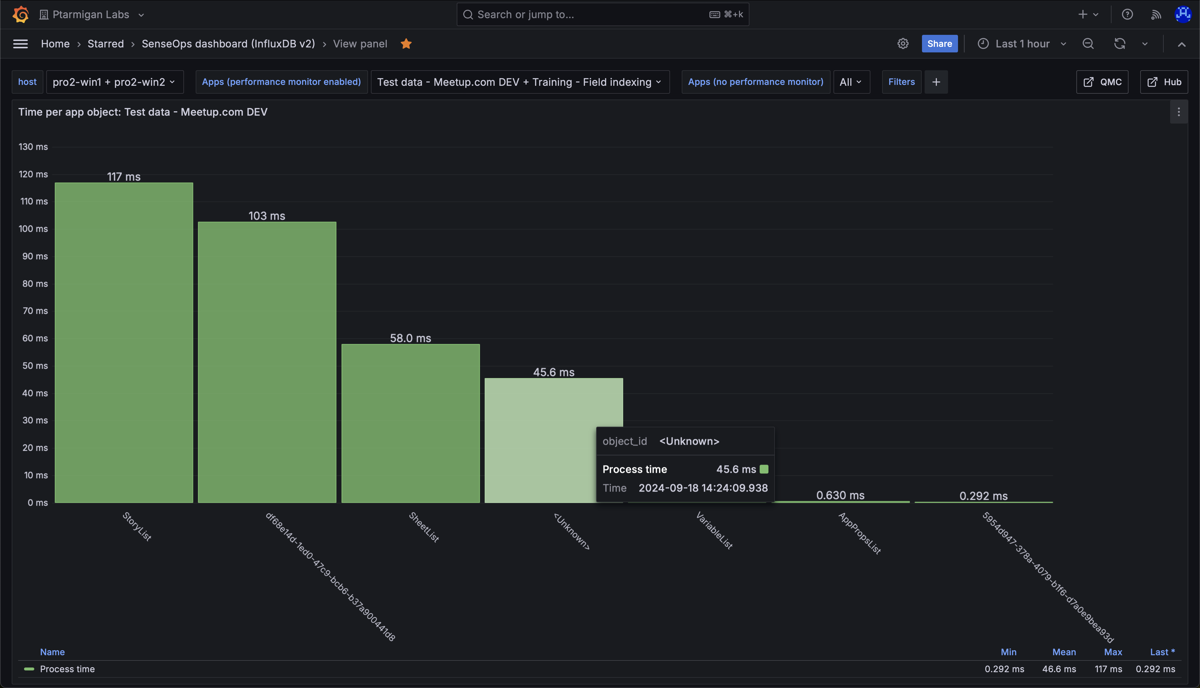

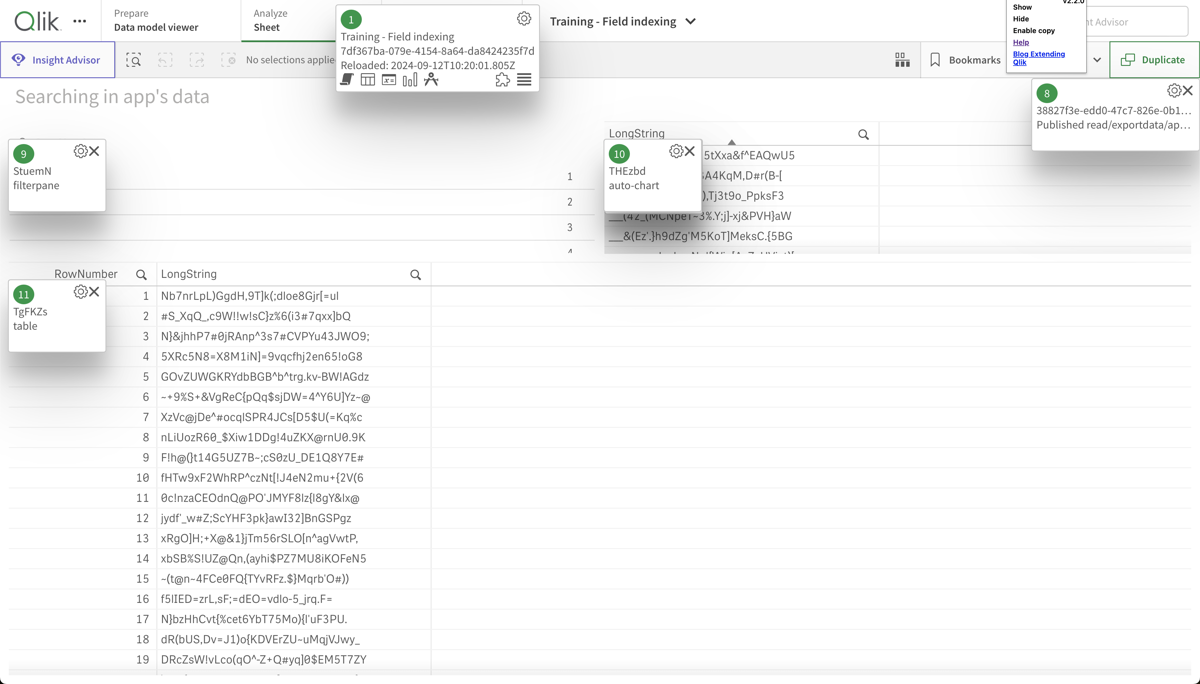
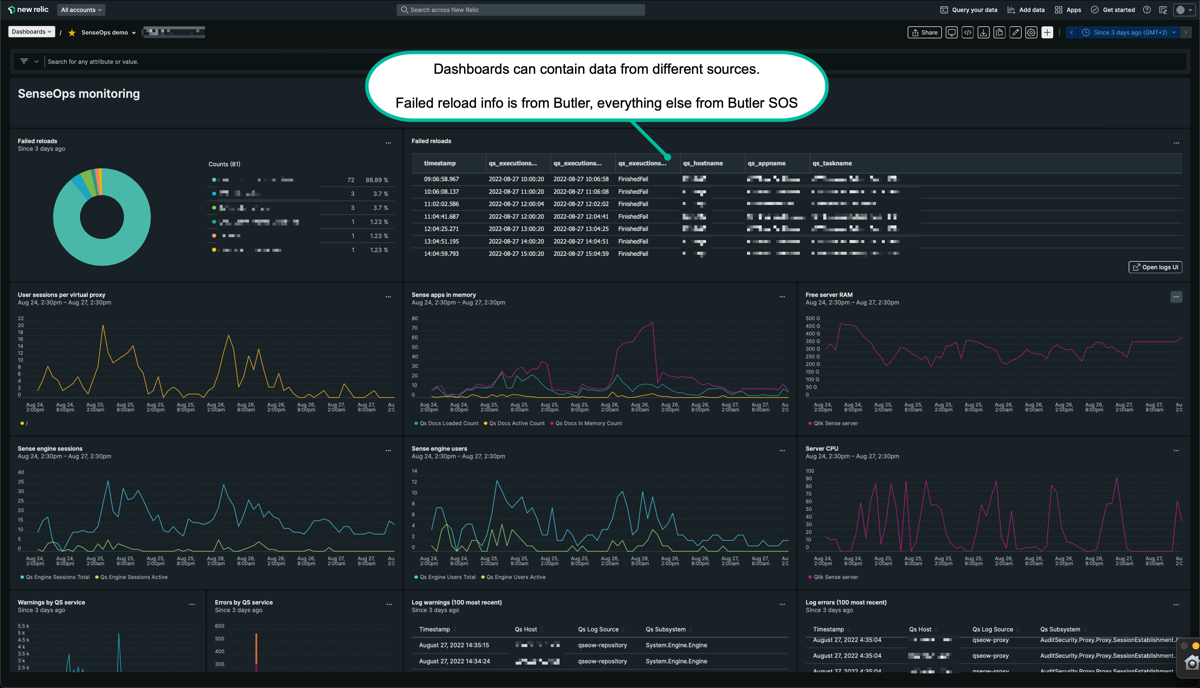
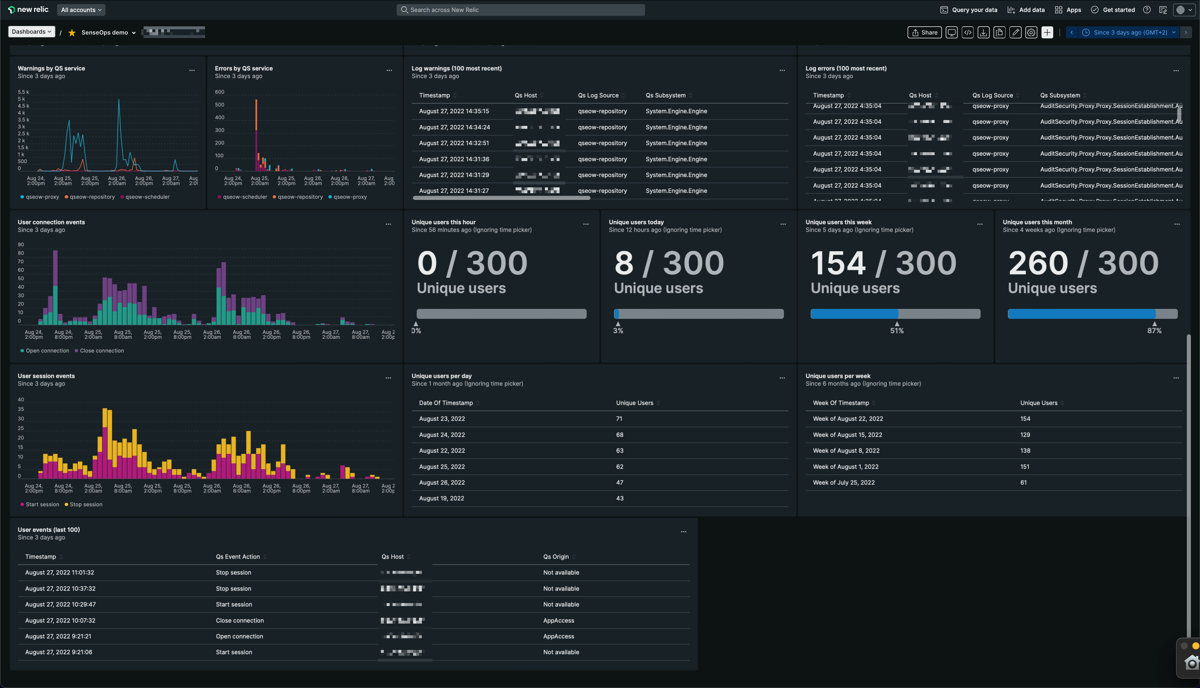
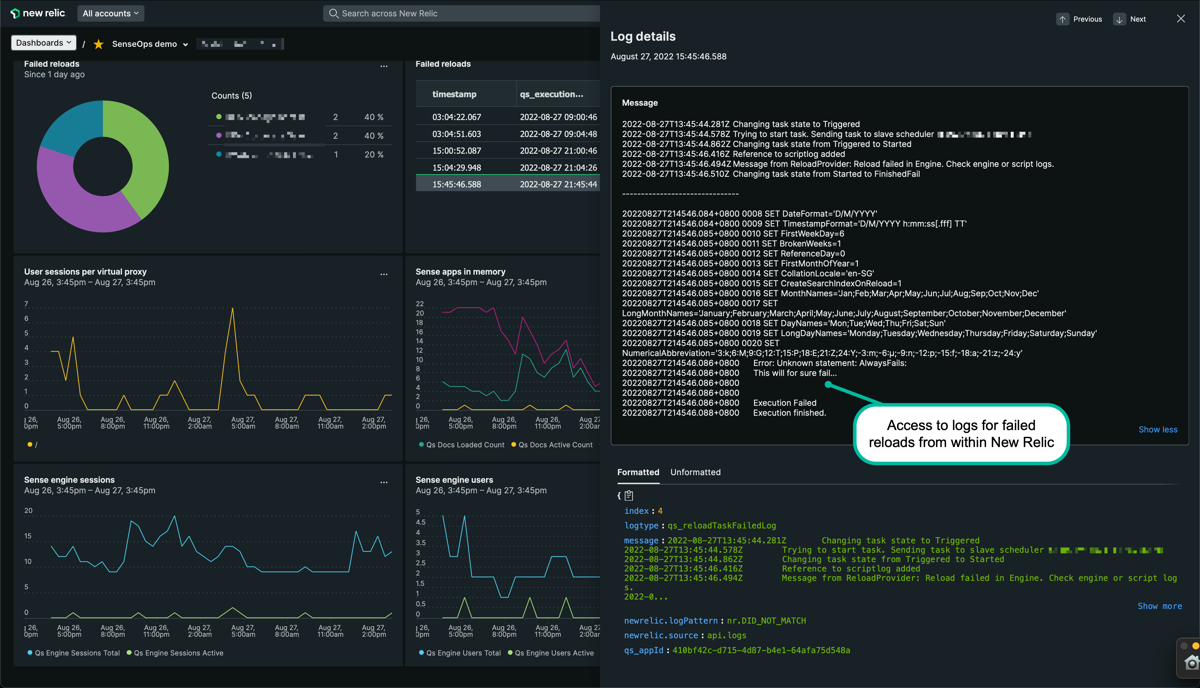
 Top level metrics
 Apps loaded into memory
 Users and sessions per server
 User events
 Error and warning charts
 Error and warning tables
 Detailed view into errors and warnings
 Butler SOS memory usage
 Top level metrics
 Apps loaded into memory
 Users and sessions per server
 Error and warning charts
 Error and warning tables
 Butler SOS memory usage
 Alerts
 RAM usage for each server
 General/high level user sessions info for both whole system and each server
 Detailed user sessions info per server and virtual proxy
 Detailed user sessions info per server and virtual proxy