
Log Events
Butler SOS receives log events in real-time from Qlik Sense Enterprise on Windows (QSEoW) via UDP messages. These events capture warnings, errors, and fatals from various QSEoW services as they happen.
Event Types
Butler SOS supports 5 types of log events from QSEoW services:
| Event Type | Source Prefix | Description |
|---|---|---|
| Engine Events | /qseow-engine/ | Warnings, errors, and fatals from the Qlik Sense engine service |
| Proxy Events | /qseow-proxy/ | Warnings, errors, and fatals from the Qlik Sense proxy service |
| Repository Events | /qseow-repository/ | Warnings, errors, and fatals from the Qlik Sense repository service |
| Scheduler Events | /qseow-scheduler/ | Warnings, errors, and fatals from the Qlik Sense scheduler service |
| QIX Performance Events | /qseow-qix-perf/ | Detailed engine performance data (method execution times, memory usage) |
Each event type has a different payload structure. See the UDP Payload Format Reference for the full field specifications.
How It Works
Log events are created by deploying log appender XML files on Qlik Sense servers. These files instruct Qlik Sense's Log4Net logging framework to forward specific log entries to Butler SOS via UDP.
- Log appender XML files are deployed on QSEoW servers (engine, proxy, repository, scheduler)
- The XML files tell Log4Net which log events to forward and where to send them
- Butler SOS receives the UDP messages and processes them
- Events are stored in InfluxDB and/or forwarded to other destinations (MQTT, New Relic)
Prerequisites
- Log appender XML files must be deployed on each QSEoW server where you want to capture log events
- Each log source (
engine,proxy,repository,scheduler,qixPerf) must be explicitly enabled in the Butler SOS config file (Butler-SOS.logEvents.source.<type>.enable) - Firewalls must allow UDP traffic from QSEoW servers to Butler SOS on the configured port (default: 9996)
Data Captured
Each log event includes contextual information depending on the source service:
- Common fields: Timestamp, log level, hostname, subsystem, Windows service account, message text
- Engine events: Proxy session ID, user directory/ID, process ID, engine version, session ID, app ID
- Proxy/Repository events: User directory/ID, command, result code, origin, context, exception details
- Scheduler events: Task name, app name, task ID, app ID, execution ID
- QIX performance events: Proxy session ID, user directory/ID, method name, processing times, memory usage, object ID/type
Configuration
Log events are configured in the Butler SOS config file under Butler-SOS.logEvents. Here is the start of that section:
Butler-SOS:
  logEvents:
    udpServerConfig:
      serverHost: <IP or FQDN> # Host/IP where log event server will listen for events from Sense
      portLogEvents: 9996 # Port on which log event server will listen for events from Sense
      # Message queue settings for handling incoming UDP messages
      messageQueue:
        maxConcurrent: 10 # Max number of messages being processed simultaneously (default: 10)
        maxSize: 200 # Max queue size before messages are dropped (default: 200)
        backpressureThreshold: 80 # Warn when queue utilization reaches this % (default: 80)
      # Rate limiting to prevent message flooding
      rateLimit:
        enable: false # Enable rate limiting (default: false)
        maxMessagesPerMinute: 600 # Max messages per minute, ~10/sec (default: 600)
      maxMessageSize: 65507 # Max UDP message size in bytes (default: 65507, UDP max)
      # Queue metrics storage in InfluxDB
      queueMetrics:
        influxdb:
          enable: false # Store queue metrics in InfluxDB (default: false)
          writeFrequency: 20000 # How often to write metrics, milliseconds (default: 20000)
          measurementName: log_events_queue # InfluxDB measurement name (default: log_events_queue)
          tags: # Optional tags added to queue metrics
            - name: qs_env
              value: dev
    tags:
      - name: qs_env
        value: dev
    source:
      engine:
        enable: false # Should log events from the engine service be handled?
      proxy:
        enable: false # Should log events from the proxy service be handled?
      repository:
        enable: false # Should log events from the repository service be handled?
      scheduler:
        enable: false # Should log events from the scheduler service be handled?
      qixPerf:
        enable: true # Should log events relating to QIX performance be handled?
See the setup guide for detailed configuration instructions, including how to deploy the log appender XML files on QSEoW servers.
Performance Events
Butler SOS can capture very detailed information about individual charts in apps - or just the high-level information about the apps themselves.
Three levels of log event data
Depending on the needs of the Sense admin, Butler SOS can provide three levels of log event data, ranging from high-level counters to detailed performance data for individual charts in apps.
The most high-level data are the "log event counters", which can be enabled/disabled independently of the more detailed engine performance events.
The engine performance events are then divided into "rejected" and "accepted" events, with the latter being the most detailed.
It's usually a good idea to start with the high-level metrics and then enable more detailed metrics if needed.
INFO
The counters for top-level metrics and rejected performance log events are reset to zero every time Butler SOS is restarted, as well as every time counter data is sent to InfluxDB.
I.e. the counters are not cumulative over time, but rather show the number of events since the last restart/save.
This makes it easy to create Grafana dashboards that show the number of events during the selected time interval. Just sum the counter fields in the Grafana chart, and you're done.
High level: Event counters
Event counters can be enabled independently of engine performance events.
The counters are configured in the Butler-SOS.qlikSenseEvents.eventCount section in the Butler SOS config file.
When enabled, Butler SOS will count the number of log and user events that are received from Qlik Sense via UDP messages.
The counters are split across several dimensions, described in the reference section.
These counters can be used to get a general idea of which servers generate the most log events, which Windows services generate the most events, and so on.
A Grafana dashboard can look like this:

Butler SOS event counter charts in Grafana.
Medium: Rejected performance log events
If an event with source=qseow-qix-perf does not meet the include filter criteria in the config file, it is considered a "rejected" event.
For rejected events a set of counters are kept, broken down by dimensions described in the reference section.
As both app id/name and the engine method (for example Global::OpenApp) are included as a dimension in the InfluxDB data, it's possible to create Grafana dashboards that show how long time each app takes to open.
A Grafana dashboard can look like this:
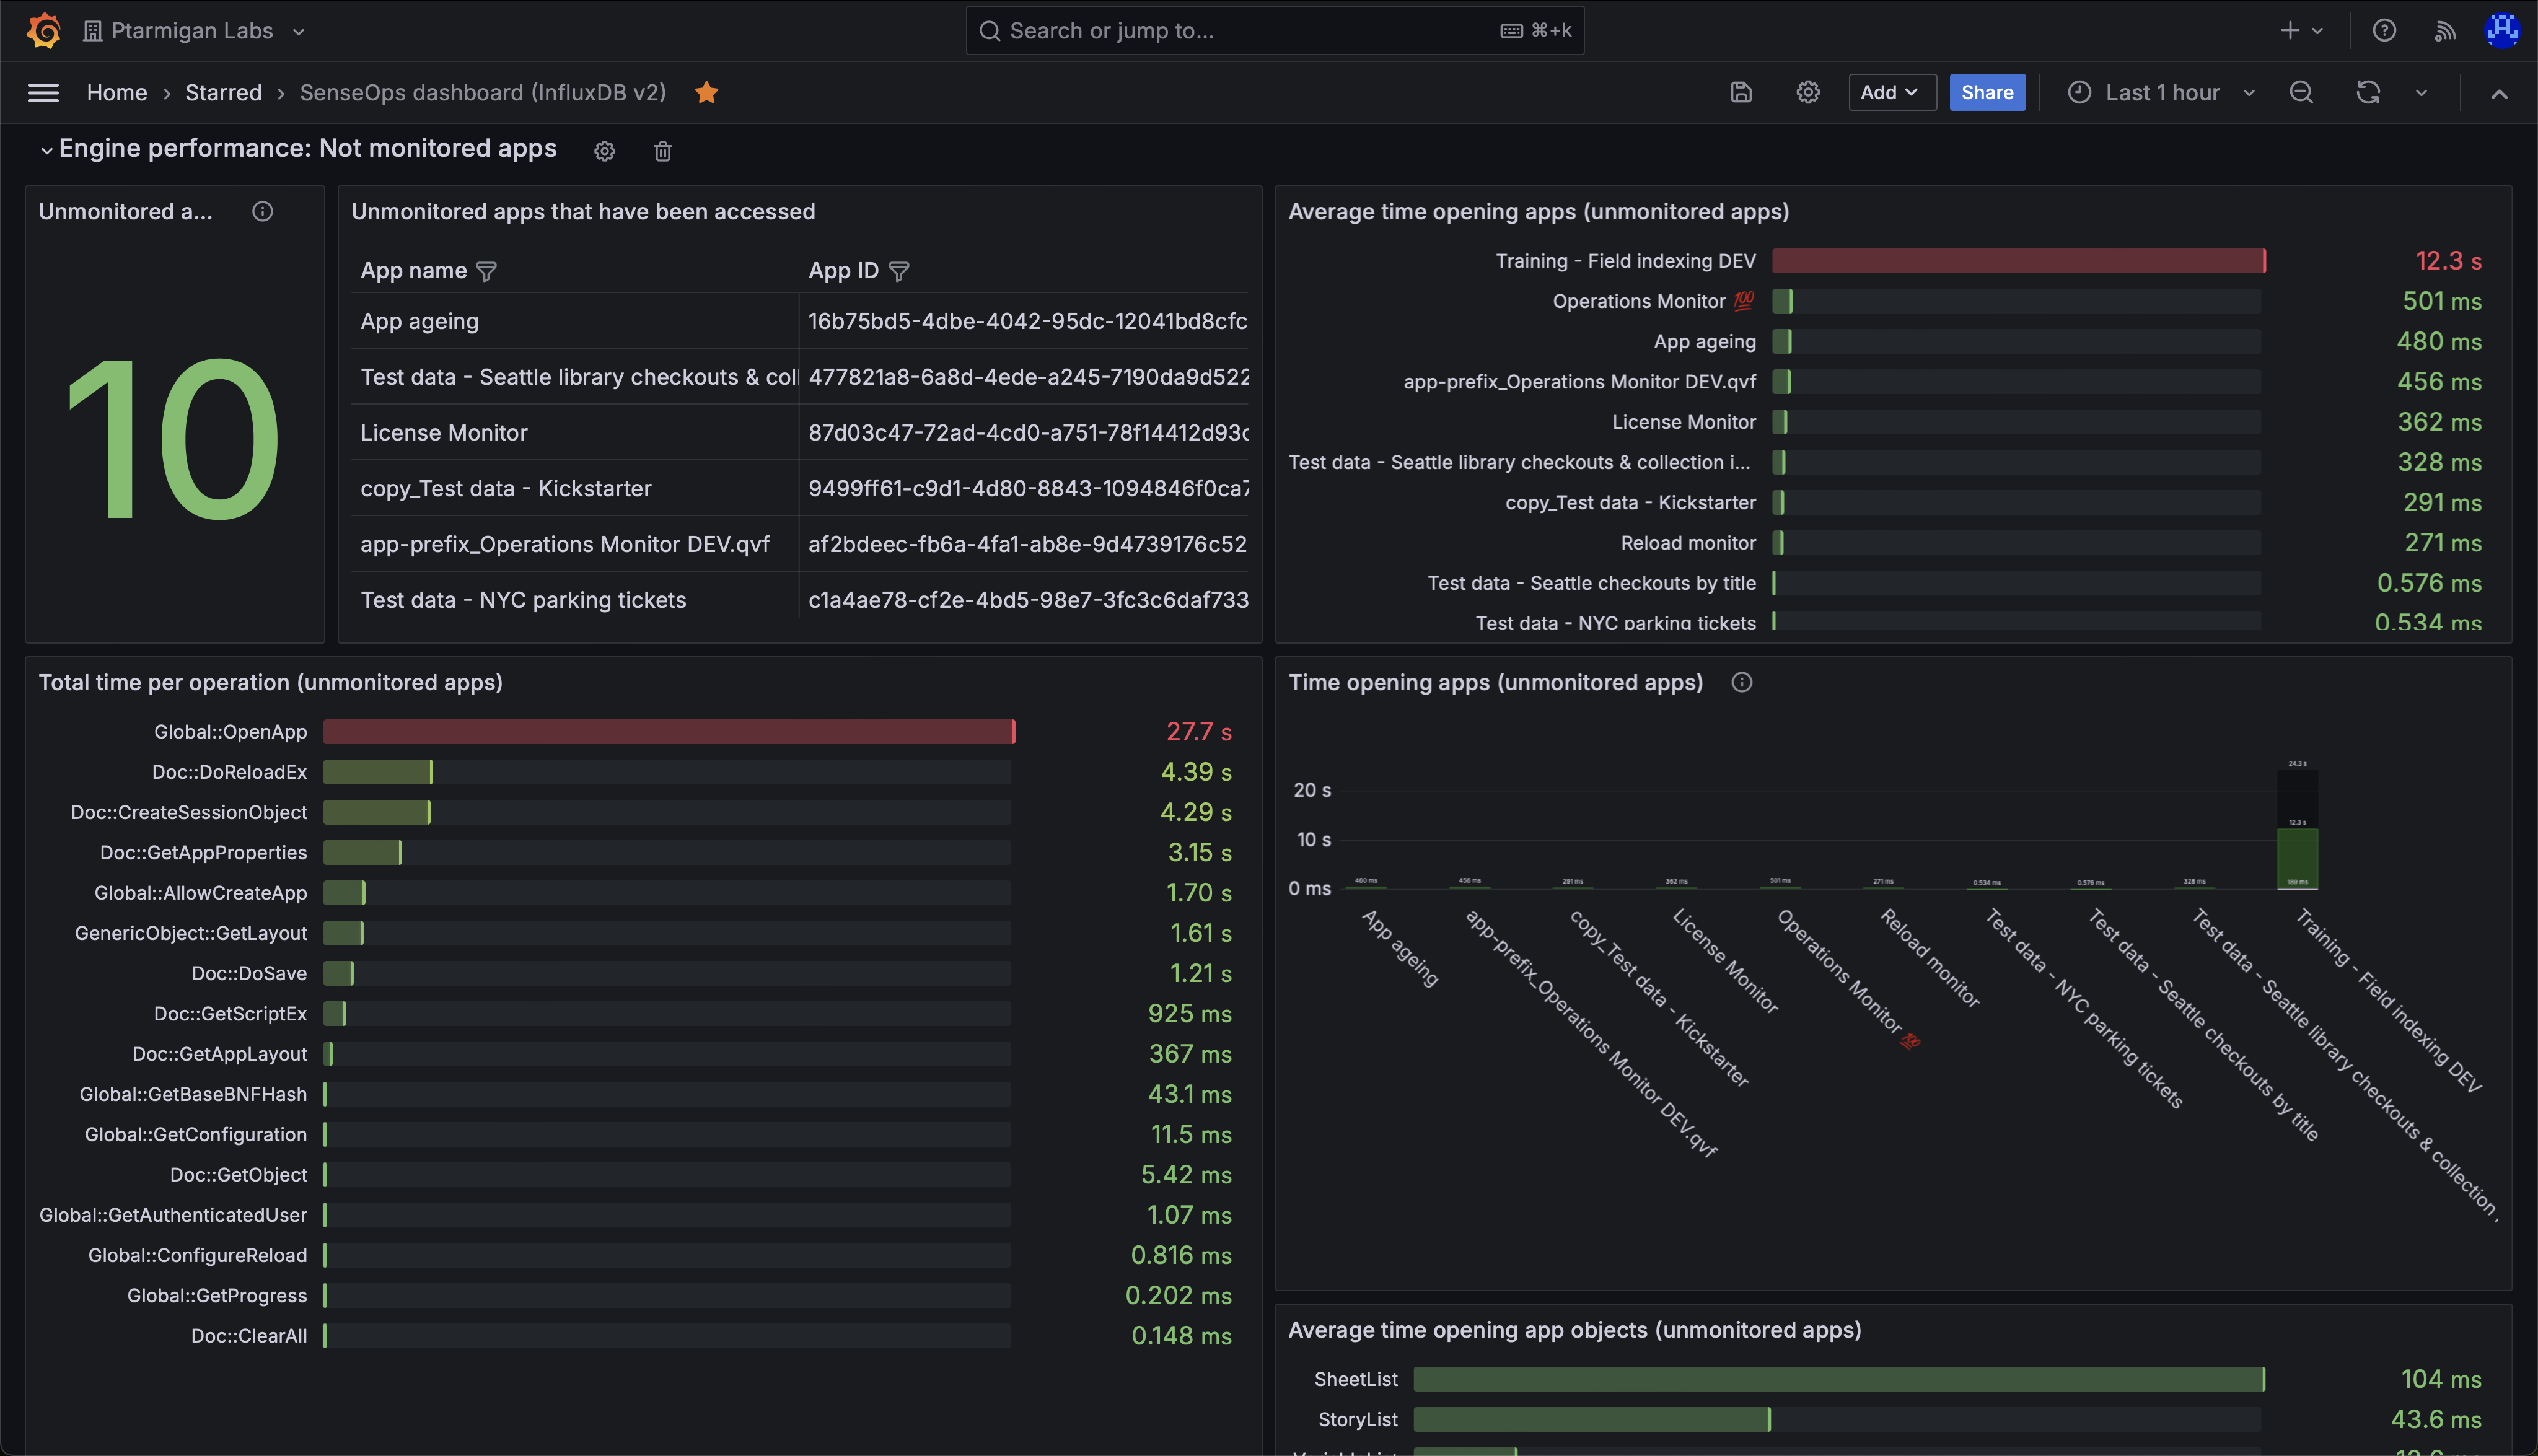
Butler SOS rejected performance log events dashboard in Grafana.
In the upper right chart above we can see that all apps except one open quickly.
Might be a good idea to investigate why the app "Training - Field indexing DEV" takes so long to open.
More Grafana examples in the app object performance monitoring section.
Detailed: Accepted performance log events
If an event with source=qseow-qix-perf does meet the include filter criteria in the config file, it is considered an "accepted" event.
All accepted events will result in a set of detailed performance metrics being stored in InfluxDB.
The metrics are described in the reference section.
An example Grafana dashboard can look like this:
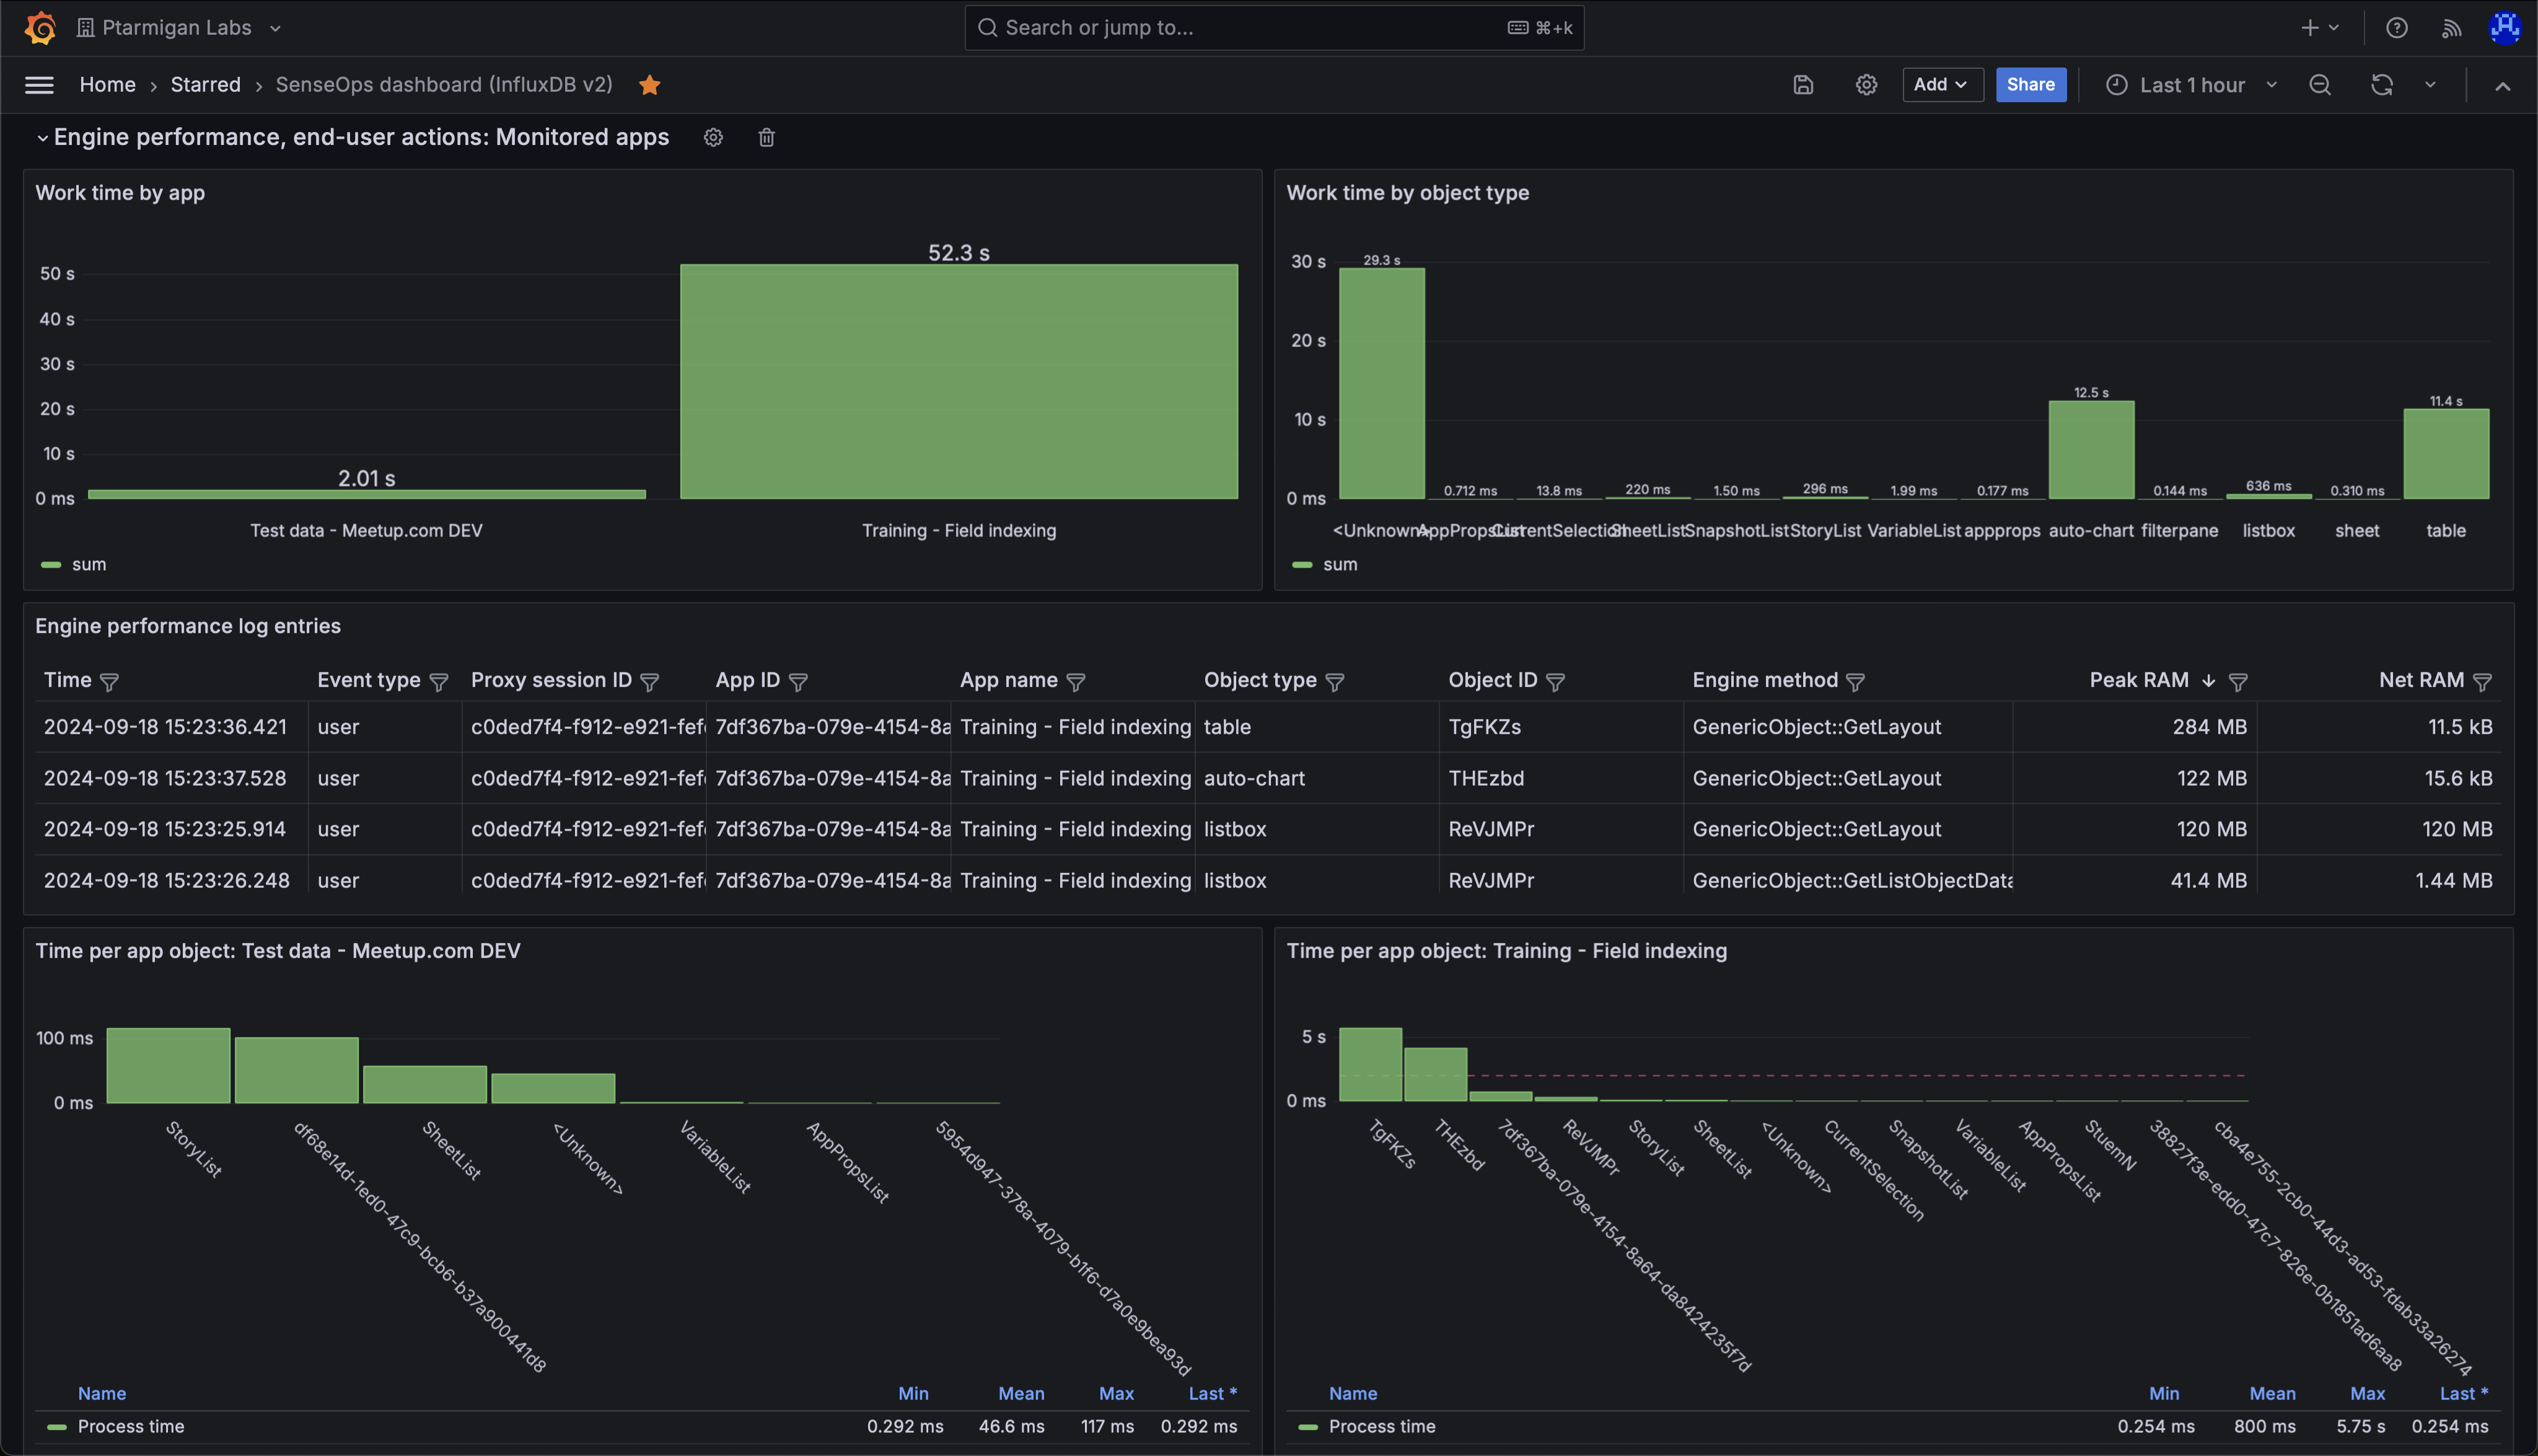
Butler SOS accepted performance log events dashboard in Grafana.
The upper left chart shows total "work time" per app, during the selected time interval.
Work time is the time it takes for the engine to do the actual work, like calculating the chart data after a selection is made by the user.
The chart shows that the app "Training - Field indexing" has a high work time.
This does not have to be a problem, but it's worth investigating why the number is so high.
The bottom two charts show the work time per chart object, per app.
The chart tells us that two app objects take on the order of 5 seconds each to calculate.
Which objects are these?
Open the app in Chrome and use the "Add Sense for Chrome" extension to find out.
Turns out it's the two tables (objects 10 and 11) that take a long time to update - that's expected (but not ideal!) as they contain a lot of complex data that takes time to index.
If the update times get even longer, it might be a good idea to look into the data model and see if it can be optimized.
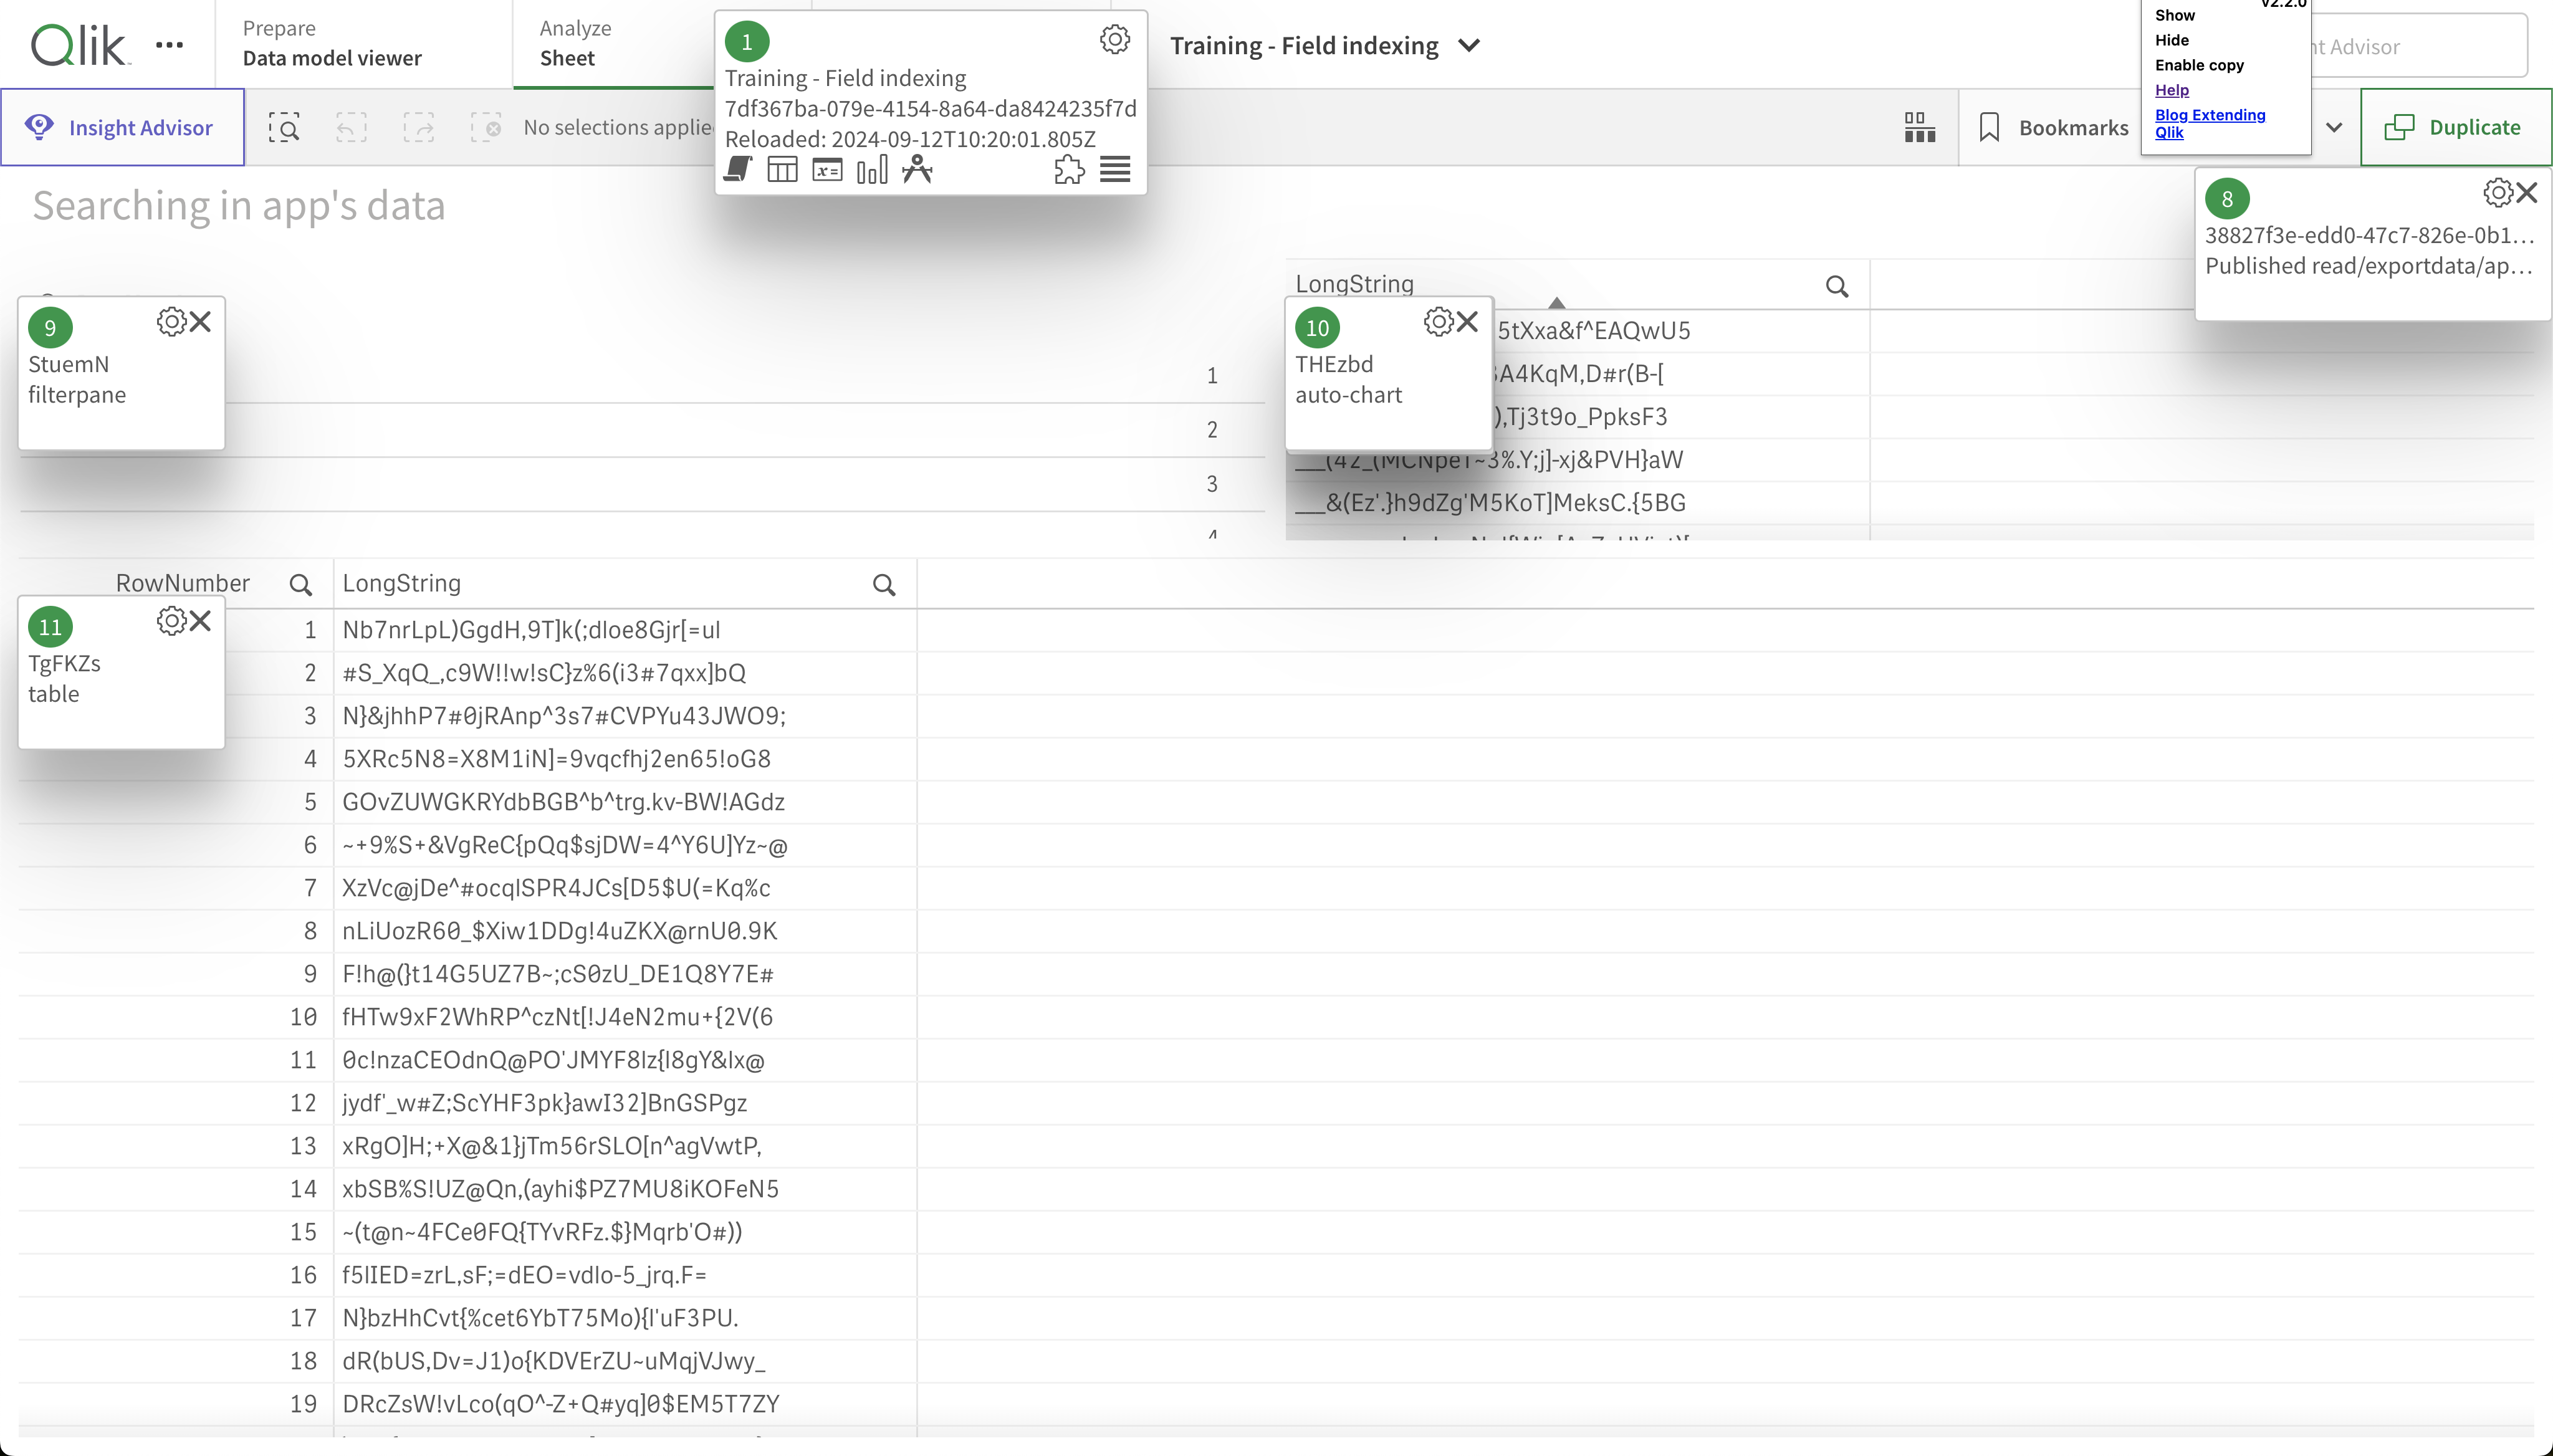
The Add Sense for Chrome extension showing the object ID for objects on a sheet.
Data Destinations
Log events can be sent to:
- InfluxDB — for Grafana visualization and alerting
- New Relic — for cloud-based monitoring
- MQTT — for integration with other systems
Categorization
Log events can be categorized by their content using rules defined in the Butler SOS config file. This makes it easier to identify patterns such as access denied errors, AD issues, service failures, or reload failures. See the categorizing log events page for more information.