Butler SOS can act as a receiver of Qlik Sense events, sent as UDP messages from Qlik Sense Enterprise.
This section of the config file contains general settings for how Butler SOS should handle these events.
More specific settings for each event type (user, log, …) can be found in the respective sections of the config file.
Butler SOS can receive events from Qlik Sense Enterprise, sent as UDP messages.
Two kinds of events are supported: User events and log events.
User events are events that are generated when a user interacts with Qlik Sense, for example logging into Sense or opening an app.
Log events originate from the Sense logging framework itself, which is also responsible for logging things to Qlik Sense’s own log files.
Some aspects of these events are general in nature, i.e. shared between the different event types, and are configured in this section of the config file.
Counters for user and log events
If log and/or user events are enabled there is a risk that the number of events generated by a QSEoW cluster can be overwhelming.
To make it easier to understand the volume of events generated, Butler SOS can be configured to count the number of events generated by the Sense cluster.
The counters are stored in InfluxDB and can be used to create dashboards in Grafana.
Each InfluxDB datapoint has tags and fields as described in the reference section.
Rejected events
Butler SOS can be configured to reject certain events even though the event is correctly formatted and contains valid data.
The need to do this can arise if the Sense cluster generates a large number of events, and not all of them are relevant for the current monitoring use case.
For example, performance log events (event name qseow-qix-perf) will be emitted by Sense every 2 seconds during scheduled reloads.
There is rarely a need to store all these events in InfluxDB, so they can be filtered out (=rejected) by Butler SOS.
But they can also be seen as valid and stored in InfluxDB, depending on the use case.
Rejected events are counted and the counters stored in InfluxDB.
They can be used to understand how many events are rejected by Butler SOS, versus how many are received in total (see the section above).
The InfluxDB measurement name is defined in the config file, Butler-SOS.qlikSenseEvents.rejectedEventCount.influxdb.measurementName.
Each event type and name may have its own rejection settings, defined in the respective sections of the config file.
They may also store different tags and fields in InfluxDB.
The currently defined rejection settings are:
Performance log events
These events come from the Qlik associative engine (the “QIX engine”) an contain very detailed performance data about apps, app objects, charts, user selections in apps etc.
Counters for rejected performance log events are enabled via the Butler-SOS.logEvents.enginePerformanceMonitor.trackRejectedEvents.enable setting in the config file.
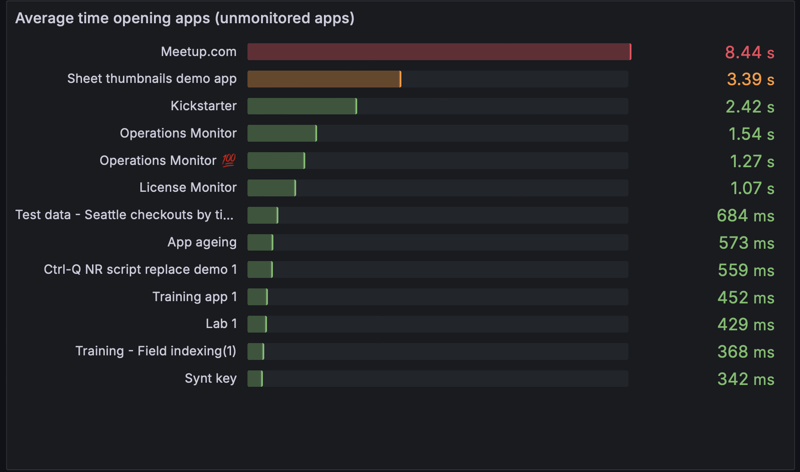
Once this data is in InfluxDB it can be used in Grafana dashboards, for example showing how long each app takes to open:
Average time to open Sense apps
The data stored in InfluxDB for performance log events is described here.
Settings in main config file
---Butler-SOS:......# Shared settings for user and log events (see below)qlikSenseEvents:# Shared settings for user and log events (see below)influxdb:enable:false# Should summary (counter) of user/log events, and rejected events be stored in InfluxDB?writeFrequency:20000# How often (milliseconds) should rejected event count be written to InfluxDB?eventCount:# Track how many events are received from Sense.# Some events are valid, some are not. Of the valid events, some are rejected by Butler SOS# based on the configuration in this file.enable:false# Should event count be stored in InfluxDB?influxdb:measurementName:event_count# Name of the InfluxDB measurement where event count is storedtags:# Tags are added to the data before it's stored in InfluxDB- name:envvalue:DEV- name:foovalue:barrejectedEventCount:# Rejected events are events that are received from Sense, that are correctly formatted,# but that are rejected by Butler SOS based on the configuration in this file.# An example of a rejected event is a performance log event that is filtered out by Butler SOS.enable:false# Should rejected events be counted and stored in InfluxDB?influxdb:measurementName:rejected_event_count# Name of the InfluxDB measurement where rejected event count is stored......
Log appender XML files
Sample log appender files are available in the ZIP file available from the download page, in subfolders engine/proxy/repository/scheduler of config/log_appender_xml/ folder.
Note that the log appender files contain slightly different information for each Sense service (engine/proxy/repository/scheduler)!
Also keep in mind that the log appender files must be called LocalLogConfig.xml and placed in these directories on the all Sense servers (assuming the default installation path of Qlik Sense):
C:\ProgramData\Qlik\Sense\Engine
C:\ProgramData\Qlik\Sense\Proxy
C:\ProgramData\Qlik\Sense\Repository
C:\ProgramData\Qlik\Sense\Scheduler
Tip
If you have more than one Sense server you strictly speaking don’t have to deploy log appenders to all servers.
If you are only interested in receiving log events from some servers and/or services (engine, proxy, repository, scheduler) - deploy the log appender files there.
1 - Configuring user events
Optional
These settings are optional.
If you don’t do anything user activity events are turned off by default.
What’s this?
User events are among the most detailed bits of information retrieved from Sense by Butler SOS.
They capture session start/stop events (=users logging in/out) and connection open/close events (apps opened/closed in browser tabs).
These events rely on two things to be correctly configured:
Settings in Butler SOS’ config file.
Log appender XML file(s) being deployed on the Sense server(s) where user activity events should be captured.
Both are described below.
Tech deep-dive
The user events are created by hooking into Sense’s logging framework, which is called Log4Net.
By placing a carefully crafted XML file in the Qlik Sense proxy service’s configuration directory, we can instruct Log4Net to forward certain Sense log events that we are interested in to Butler SOS.
In this case we are interested in session start/stop and connection open/close events.
The XML file is also known as a “log appender file”.
It contains instructions that tell Log4Net to do various things when the specified filter matches the actual log data created by Sense. Examples include sending emails, writing log entries to disk (i.e. regular file logging!), sending the log row as a UDP message and more.
Here we’re interested in the UDP message feature.
So, by means of a log appender file we tell Log4Net to send certain log rows to Butler SOS as UDP messages.
We also have to specify in the log appender file what host/IP address and port Butler SOS listens to, i.e. where the UDP messages should be sent.
Finally we have to make sure firewalls are open and allow UDP traffic from the Sense server(s) to Butler SOS.
If everything is set up correctly UDP messages will arrive at Butler SOS within seconds after the actual event taking place in Qlik Sense, i.e. close to real-time.
Tagging of data
InfluxDB
The tags added to InfluxDB are described in the reference documentation for log events.
New Relic
The following attributes (which is New Relic lingo for tags) are added:
A core set of attributes are added to all user events
qs_host: Host name of the Sense server the event originated at.
qs_event_action: What kind of user event that took place. Examples are “Start session”, “Stop session, “Open connection”, “Close connection”.
qs_userFull: Full directory/user ID of the user the event is about. Will be scrambled if scrambling enabled in config file.
qs_userDirectory: User directory of the user the event is about. Will be scrambled if scrambling enabled in config file.
qs_userId: User ID of the user the event is about. Will be scrambled if scrambling enabled in config file.
qs_origin: What kind of activity caused the event, for example “AppAccess”. May be empty for some user events.
qs_appId: App ID of the app the event is about. May be empty for some user events.
qs_appName: App name of the app the event is about. May be empty for some user events.
qs_uaBrowserName: Browser name of the user agent that caused the event.
qs_uaBrowserMajorVersion: Browser major version of the user agent that caused the event.
qs_uaOsName: OS name of the user agent that caused the event.
qs_uaOsVersion: OS version of the user agent that caused the event.
Custom attributes defined in the Butler SOS config file’s Butler-SOS.userEvents.tags section of the config file.
Note: Attributes defined further down in the list above will overwrite already defined attributes if their names match.
To avoid problems you should make sure not to use already defined attributes.
Settings in config file
---Butler-SOS:......# Track individual users opening/closing apps and starting/stopping sessions. # Requires log appender XML file(s) to be added to Sense server(s).userEvents:enable:falseexcludeUser:# Optional blacklist of users that should be disregarded when it comes to user events- directory:LABuserId:testuser1- directory:LABuserId:testuser2udpServerConfig:serverHost:<IP or FQDN> # Host/IP where user event server will listen for events from SenseportUserActivityEvents:9997# Port on which user event server will listen for events from Sensetags:# Tags are added to the data before it's stored in InfluxDB- tag:envvalue:DEV- tag:foovalue:barsendToMQTT:enable:false# Set to true if user events should be forwarded as MQTT messagespostTo:# Control when and to which MQTT topics messages are sent everythingTopic:# Topic to which all user events are sentenable:truetopic:qliksense/usereventsessionStartTopic:# Topic to which "session start" events are sentenable:truetopic:qliksense/userevent/session/startsessionStopTopic:# Topic to which "session stop" events are sentenable:truetopic:qliksense/userevent/session/stopconnectionOpenTopic:# Topic to which "connection open" events are sentenable:truetopic:qliksense/userevent/connection/openconnectionCloseTopic:# Topic to which "connection close" events are sentenable:truetopic:qliksense/userevent/connection/closesendToInfluxdb:enable:true# Set to true if user events should be stored in InfluxDBsendToNewRelic:enable:false# Should log events be sent to New Relic?destinationAccount:- First NR account- Second NR accountscramble:true# Should user info (user directory and user ID) be scrambled before sent to NR?......
Log appender XML files
A sample log appender file LocalLogConfig.xml is available in the ZIP file available from the download page, in the config/log_appender_xml/proxy/LocalLogConfig.xml folder.
That file includes log appenders for both user and log events.
Looks like this:
<?xml version="1.0" encoding="UTF-8"?><configuration><!-- Log appender finding user session events --><appendername="EventSession"type="log4net.Appender.UdpAppender"><filtertype="log4net.Filter.StringMatchFilter"><paramname="stringToMatch"value="Start session for user"/></filter><filtertype="log4net.Filter.StringMatchFilter"><paramname="stringToMatch"value="Stop session for user"/></filter><filtertype="log4net.Filter.DenyAllFilter"/><paramname="remoteAddress"value="FQDN or IP of server where Butler SOS is running"/><paramname="remotePort"value="9997"/><paramname="encoding"value="utf-8"/><layouttype="log4net.Layout.PatternLayout"><converter><paramname="name"value="hostname"/><paramname="type"value="Qlik.Sense.Logging.log4net.Layout.Pattern.HostNamePatternConverter"/></converter><paramname="conversionpattern"value="/qseow-proxy-session/;%hostname;%property{Command};%property{UserDirectory};%property{UserId};%property{Origin};%property{Context};%message"/></layout></appender><!-- Log appender finding user connection events --><appendername="EventConnection"type="log4net.Appender.UdpAppender"><filtertype="log4net.Filter.StringMatchFilter"><paramname="stringToMatch"value="connection Opened for session"/></filter><filtertype="log4net.Filter.StringMatchFilter"><paramname="stringToMatch"value="connection Closed for session"/></filter><filtertype="log4net.Filter.DenyAllFilter"/><paramname="remoteAddress"value="FQDN or IP of server where Butler SOS is running"/><paramname="remotePort"value="9997"/><paramname="encoding"value="utf-8"/><layouttype="log4net.Layout.PatternLayout"><converter><paramname="name"value="hostname"/><paramname="type"value="Qlik.Sense.Logging.log4net.Layout.Pattern.HostNamePatternConverter"/></converter><paramname="conversionpattern"value="/qseow-proxy-connection/;%hostname;%property{Command};%property{UserDirectory};%property{UserId};%property{Origin};%property{Context};%message"/></layout></appender><!-- Generic appender for detecting warnings and errors --><appendername="LogEvent"type="log4net.Appender.UdpAppender"><paramname="threshold"value="warn"/><paramname="remoteAddress"value="FQDN or IP of server where Butler SOS is running"/><paramname="remotePort"value="9996"/><paramname="encoding"value="utf-8"/><layouttype="log4net.Layout.PatternLayout"><converter><paramname="name"value="rownum"/><paramname="type"value="Qlik.Sense.Logging.log4net.Layout.Pattern.CounterPatternConverter"/></converter><converter><paramname="name"value="hostname"/><paramname="type"value="Qlik.Sense.Logging.log4net.Layout.Pattern.HostNamePatternConverter"/></converter><converter><paramname="name"value="longIso8601date"/><paramname="type"value="Qlik.Sense.Logging.log4net.Layout.Pattern.Iso8601TimeOffsetPatternConverter"/></converter><converter><paramname="name"value="user"/><paramname="type"value="Qlik.Sense.Logging.log4net.Layout.Pattern.ServiceUserNameCachedPatternConverter"/></converter><converter><paramname="name"value="encodedmessage"/><paramname="type"value="Qlik.Sense.Logging.log4net.Layout.Pattern.EncodedMessagePatternConverter"/></converter><converter><paramname="name"value="encodedexception"/><paramname="type"value="Qlik.Sense.Logging.log4net.Layout.Pattern.EncodedExceptionPatternConverter"/></converter><paramname="conversionpattern"value="/qseow-proxy/;%rownum{9999};%longIso8601date;%date;%level;%hostname;%logger;%user;%encodedmessage;%encodedexception;%property{UserDirectory};%property{UserId};%property{Command};%property{Result};%property{Origin};%property{Context}"/></layout></appender><!-- Send UDP message to Butler SOS on user activity --><loggername="AuditActivity.Proxy"><appender-refref="EventSession"/><appender-refref="EventConnection"/></logger><!-- Send UDP message to Butler SOS on warnings and errors --><loggername="Audit.Proxy"><appender-refref="LogEvent"/></logger><loggername="AuditSecurity"><appender-refref="LogEvent"/></logger><loggername="Security.Proxy"><appender-refref="LogEvent"/></logger><loggername="System.Proxy"><appender-refref="LogEvent"/></logger></configuration>
Tip
If you have several servers in your Sense cluster you probably need several log appender files too.
More specifically, you should put a log appender file on each server where the Qlik Sense proxy service is running, i.e. on all servers via which end users access the Sense cluster.
Note the places where you need to fill in the IP/host where Butler SOS is running, as well as the port number to use (set to 9997 but can be changed if needed).
Make necessary changes so the file matches your environment, then deploy to C:\ProgramData\Qlik\Sense\Proxy\LocalLogConfig.xml (adapt path if you have a different installation path).
Note that the file must be called LocalLogConfig.xml!
Sense will usually detect and use the file without any restarts needed, but it can take a while. You can always restart the Sense proxy service to make sure the XML file is applied and used.
Once in place you should see events in the Butler SOS console/file logs if you set logging level to verbose, debug or silly.
2 - Configuring log events
Optional
These settings are optional.
If you don’t do anything log events are turned off by default.
What’s this?
Butler SOS log events are designed to be a replacement for the most important/useful aspects of Qlik Sense’ log database, which was removed from Qlik Sense Enterprise on Windows in mid 2021.
The log events capture warnings, errors and fatals from the various QSEoW subsystems.
These events used to be sent to the PostgreSQL logging database, most (but not all) are also sent to QSEoW’s log files.
Using Butler SOS’ log events is arguably even better than getting the same information from log db:
Log db had to be polled to detect new log events and this polling could realistically only be done every few minutes. It also put additional load on an often already struggling part of many QSEoW clusters.
With Butler SOS’ log events concept the notifications are almost instantaneous.
Errors and warnings show up in the Grafana or New Relic dashboards within seconds after taking place in QSEoW.
Log events rely on two things to work:
Settings in the Butler SOS config file.
Log appender XML files being deployed on the Sense servers where log events should be captured.
Both are described below.
Info
As of Butler SOS version 9.2, log events are captured in these QSEoW services:
Engine
Proxy
Repository
Scheduler
Support for additional modules is reasonably easy to add, please create a ticket if you believe some service should be added to the list above.
Tech deep-dive
The underlying mechanism is the same as described on the user events page.
Tagging of data
Categorizing log events
Log events can optionally be categorized by Butler SOS.
The reason for categorizing log events is to make it easier to make Sense of the potentially large number of log events that can be generated by a QSEoW cluster.
For example, if a QSEoW cluster creates 1000 warnings and errors per hour, it’s difficult to know which warnings are important and which are not.
By categorizing the messages, for example by the subsystem that generated them and/or what they refer to, it’s easier to understand what’s going on.
Possible ways of categorizing log events could be “access denied” issues, “user directory” issues, “app reload failed” issues, “general engine issues” etc.
Log events can be categorized in any number of ways, but the template config file contains a few examples.
Specifically:
Access denied issues
Captures log events of severity WARN and ERROR.
Match log events against two filters.
Log message starts with “Access was denied for User:”.
Log message contains “was denied for User
categorizes them by setting category tag qs_log_category to access-denied.
AD issues
Captures log events of severity WARN and ERROR.
Match log events against one filter.
Log message starts with “Duplicate entity with userId”.
categorizes them by setting category tag qs_log_category to user-directory.
Qlik Sense service down
Captures log events of severity WARN.
Match log events against two filters.
Log message starts with “Failed to request service alive response from”.
Log message contains “Unable to connect to the remote server”.
categorizes them by setting category tag qs_log_category to qs-service.
Reload task failed
Captures log events of severity WARN and ERROR.
Match log events against four filters.
Log message starts with “Task finished with state FinishedFail”.
Log message starts with “Task finished with state Error”.
Log message ends with “Reload failed in Engine. Check engine or script logs.”.
Log message starts with “Reload sequence was not successful (Result=False, Finished=True, Aborted=False) for engine connection with handle”.
categorizes them by setting category tag qs_log_category to reload-failed.
If no rules match the log event, it will be categorized as unknown.
The default rule can be enabled/disabled in the config file via the ruleDefault.enable parameter.
Note 1: It is possible to assign one or more categories to a log event.
This provides flexibility in how you later create dashboards in for example Grafana or New Relic.
Note 2: The sample/template config file may be updated with more examples in the future.
Tip
It is also possible to drop log events that match a certain pattern, for example if you are never interested in seeing them in Grafana or New Relic.
This is done by setting the action parameter to drop in the config file, for that particular rule.
InfluxDB
The tags added to InfluxDB are described in the reference documentation for log events.
Log categories are added as tags to InfluxDB datapoints.
New Relic
The following attributes (which is New Relic lingo for tags) are added:
A core set of attributes are added to all user events. Note that some attributes will be empty for some/many log events.
qs_ts_iso: Event timestamp in ISO format.
qs_ts_local: Event timestamp in local (server) time zone.
qs_log_source: Which Sense service the event originated in, for example “qseow-proxy”, “qseow-repository”.
qs_log_level: Log level of the event. “WARN”, “ERROR”, or “FATAL”.
qs_host: Host name of the Sense server the event originated at.
qs_subsystem: Which part of each Sense service the event originated in, for example “System.Proxy.Proxy.Core.RequestListener”, “System.Engine.Engine”.
qs_windows_user: Name of the Windows user that’s used to run the Window service where the event originated.
qs_message: Event message.
qs_exception_message: Additional information about the event.
qs_user_full: Full directory/user ID of the user the event is about. Will be scrambled if scrambling enabled in config file.
qs_user_directory: User directory of the user the event is about. Will be scrambled if scrambling enabled in config file.
qs_user_id: User ID of the user the event is about. Will be scrambled if scrambling enabled in config file.
qs_command: What command (if any) caused the event. Example: “Doc::DoSave”, “Doc::CreateObject”.
qs_result_code: Result code as reported by Sense. Usually empty.
qs_origin: What kind of activity caused the event, for example “AppAccess”.
qs_context: Additional information about the event.
qs_task_name: Task name (if any) causing the event.
qs_app_name: App name (if any) causing the event.
qs_task_id: Task ID (if any) causing the event.
qs_app_id: App ID (if any) causing the event.
qs_execution_id: Execution ID as reported by Sense.
qs_proxy_session_id: Proxy session ID as reported by Sense.
qs_engine_ts: Engine timestamp (if any) associated with the event.
qs_process_id: Process ID of engine service.
qs_engine_exe_version: Version of engine service’s EXE file.
qs_server_started: Timestamp when Sense engine service was started.
qs_entry_type: Entry type as reported by Sense. Usually empty.
qs_session_id: Session ID as reported by Sense.
Custom attributes defined in the Butler SOS config file’s Butler-SOS.logEvents.tags section.
Custom attributes defined in the Butler SOS config file’s Butler-SOS.newRelic.event.attribute.static section.
Dynamic attributes
butlerSosVersion: Butler SOS version. Enabled by setting Butler-SOS.newRelic.event.attribute.dynamic.butlerSosVersion.enable to true in config file.
Note: Attributes defined further down in the list above will overwrite already defined attributes if their names match.
To avoid problems you should make sure not to use already defined attributes.
Log categories are currently NOT included in the data sent to New Relic.
Being a template, it contains examples on how configuration may be done - not necessarily how it should be done.
For example, the env/DEV and foo/bar tags are optional and can be changed to something else, or removed all together if not used.
Butler-SOS:......# Log events are used to capture Sense warnings, errors and fatals in real timelogEvents:udpServerConfig:serverHost:<IP or FQDN> # Host/IP where log event server will listen for events from SenseportLogEvents:9996# Port on which log event server will listen for events from Sensetags:# - name: env# value: DEV# - name: foo# value: barsource:engine:enable:false# Should log events from the engine service be handled?proxy:enable:false# Should log events from the proxy service be handled?repository:enable:false# Should log events from the repository service be handled?scheduler:enable:false# Should log events from the scheduler service be handled?categorise:# Take actions on log events based on their contentenable:falserules:# Rules are used to match log events to filters# - description: Find access denied errors# logLevel: # Log events of this Log level will be matched. WARN, ERROR, FATAL. Case insensitive.# - WARN# - ERROR# action: categorise # Action to take on matched log events. Possible values are categorise, drop# category: # Category to assign to matched log events. Name/value pairs.# # Will be added to InfluxDB datapoints as tags.# - name: qs_log_category# value: access-denied# filter: # Filter used to match log events. Case sensitive.# - type: sw # Type of filter. sw = starts with, ew = ends with, so = substring of# value: "Access was denied for User:"# - type: so# value: was denied for User# - description: Find AD issues# logLevel: # Log events of this Log level will be matched. WARN, ERROR, FATAL. Case insensitive.# - ERROR# - WARN# action: categorise # Action to take on matched log events. Possible values are categorise, drop# category: # Category to assign to matched log events. Name/value pairs.# # Will be added to InfluxDB datapoints as tags.# - name: qs_log_category# value: user-directory# filter: # Filter used to match log events. Case sensitive.# - type: sw # Type of filter. sw = starts with, ew = ends with, so = substring of# value: Duplicate entity with userId# - description: Qlik Sense service down# logLevel: # Log events of this Log level will be matched. WARN, ERROR, FATAL. Case insensitive.# - WARN# action: categorise # Action to take on matched log events. Possible values are categorise, drop# category: # Category to assign to matched log events. Name/value pairs.# # Will be added to InfluxDB datapoints as tags.# - name: qs_log_category# value: qs-service# filter: # Filter used to match log events. Case sensitive.# - type: sw # Type of filter. sw = starts with, ew = ends with, so = substring of# value: Failed to request service alive response from# - type: so # Type of filter. sw = starts with, ew = ends with, so = substring of# value: Unable to connect to the remote server# - description: Reload task failed# logLevel: # Log events of this Log level will be matched. WARN, ERROR, FATAL. Case insensitive.# - WARN# - ERROR# action: categorise # Action to take on matched log events. Possible values are categorise, drop# category: # Category to assign to matched log events. Name/value pairs.# # Will be added to InfluxDB datapoints as tags.# - name: qs_log_category# value: reload-failed# filter: # Filter used to match log events. Case sensitive.# - type: sw # Type of filter. sw = starts with, ew = ends with, so = substring of# value: Task finished with state FinishedFail# - type: sw # Type of filter. sw = starts with, ew = ends with, so = substring of# value: Task finished with state Error# - type: ew # Type of filter. sw = starts with, ew = ends with, so = substring of# value: Reload failed in Engine. Check engine or script logs.# - type: sw # Type of filter. sw = starts with, ew = ends with, so = substring of# value: Reload sequence was not successful (Result=False, Finished=True, Aborted=False) for engine connection with handleruleDefault:# Default rule to use if no other rules match the log eventenable:truecategory:- name:qs_log_categoryvalue:unknownenginePerformanceMonitor:# Detailed app performance data extraction from log eventsenable:false# Should app performance data be extracted from log events?appNameLookup:# Should app names be looked up based on app IDs?enable:falsetrackRejectedEvents:enable:false# Should events that are rejected by the app performance monitor be tracked?tags:# Tags are added to the data before it's stored in InfluxDB# - name: env# value: DEV# - name: foo# value: barmonitorFilter:# What objects should be monitored? Entire apps or just specific object(s) within some specific app(s)?# Two kinds of monitoring can be done:# 1) Monitor all apps, except those listed for exclusion. This is defined in the allApps section.# 2) Monitor only specific apps. This is defined in the appSpecific section.# An event will be accepted if it matches any of the rules in the allApps section OR any of the rules in the appSpecific section.allApps:enable:false# Should all apps be monitored?appExclude:# What apps should be excluded from monitoring?# If both appId and appName are specified, both must match the event's data for it to be considered a match.# - appId: 5b817efe-472d-43ce-8a31-6cce34af7de9# - appName: Sales forecast# - appId: f42d6b16-8faf-45ca-a783-59f9da47db6e# appName: Inventory analysisobjectType:allObjectTypes:true# Should all object types be monitored?allObjectTypesExclude:# If allObjectTypes is set to true, the object types in this array are excluded from monitoring.# someObjectTypesInclude (below) is ignored in that case.# - LoadModelList# - <Unknown># - linechart# - mapsomeObjectTypesInclude:# What object types should be included in monitoring?# Only applicable if allObjectTypes is set to false.# - LoadModelList# - sheet# - barchartmethod:allMethods:true# Should all methods be monitored?allMethodsExclude:# If allMethods is set to true, the methods in this array are excluded from monitoring.# someMethodsInclude (below) is ignored in that case.# - Global::OpenApp# - Doc::GetAppLayout# - Doc::CreateSessionObjectsomeMethodsInclude:# What methods should be included in monitoring?# Only applicable if allMethods is set to false.# - GenericObject::GetLayout# - GenericObject::GetHyperCubeContinuousDataappSpecific:enable:false# Should app specific monitoring be done?app:- include:# What apps should be monitored?# If both appId and appName are specified, both must match the event's data for it to be considered a match.# - appId: d7cf16f9-6a95-462a-9ff1-a6d413326de4# - appName: Budget 2025# - appId: 6931136d-c234-4358-a40c-e37153aba7c9# appName: Sales basket analysisobjectType:allObjectTypes:true# Should all object types be monitored?allObjectTypesExclude:# If allObjectTypes is set to true, the object types in this array are excluded from monitoring.# someObjectTypesInclude (below) is ignored in that case.# - table# - mapsomeObjectTypesInclude:# What object types should be included in monitoring?# Only applicable if allObjectTypes is set to false.# - sheet# - barchart# - linechart# - mapappObject:allAppObjects:true# Should all app objects be monitored?allAppObjectsExclude:# If allAppObjects is set to true, the app objects in this array are excluded from monitoring.# someAppObjectsInclude (below) is ignored in that case.# - objectId: AaBbCc# - objectId: DdEeFfsomeAppObjectsInclude:# What app objects should be included in monitoring?# Only applicable if allAppObjects is set to false.# - objectId: YJEpPTmethod:allMethods:true# Should all methods be monitored?allMethodsExclude:# If allMethods is set to true, the methods in this array are excluded from monitoring.# someMethodsInclude (below) is ignored in that case.# - Global::OpenApp# - Doc::GetAppLayout# - Doc::CreateSessionObjectsomeMethodsInclude:# What methods should be included in monitoring?# Only applicable if allMethods is set to false.# - GenericObject::GetLayout# - GenericObject::GetHyperCubeContinuousDatasendToMQTT:enable:false# Should log events be sent as MQTT messages?baseTopic:qliksense/logevent # What topic should log events be forwarded to?postTo:baseTopic:truesubsystemTopics:true# Should log events be sent to subtopics corresponding to the QSEoW subsystems where the events originated?sendToInfluxdb:enable:false# Should log events be stored in InfluxDB?sendToNewRelic:enable:false# Should log events be sent to New Relic?destinationAccount:# - First NR account# - Second NR accountsource:engine:enable:true# Should log events from the engine service be handled?logLevel:error:true# Should error level log events be handled by Butler SOS?warn:true# Should warning level log events be handled by Butler SOS?proxy:enable:true# Should log events from the proxy service be handled?logLevel:error:true# Should error level log events be handled by Butler SOS?warn:true# Should warning level log events be handled by Butler SOS?repository:enable:true# Should log events from the repository service be handled?logLevel:error:true# Should error level log events be handled by Butler SOS?warn:true# Should warning level log events be handled by Butler SOS?scheduler:enable:true# Should log events from the scheduler service be handled?logLevel:error:true# Should error level log events be handled by Butler SOS?warn:true# Should warning level log events be handled by Butler SOS?......
2.1 - Engine performance log events
Butler SOS can capture detailed performance data from the Qlik Sense engine service, based on log events generated by that service.
Due to the risk of generating a large number of log events, this feature comes with a comprehensive set of settings to control what data is captured and stored in InfluxDB, and what is rejected.
Warning
Due to the risk of overwhelming the InfluxDB database with a large number of performance log events, this feature is disabled by default in the sample config file.
If you want to use this feature, you must enable it first.
It’s also recommended to start small and gradually increase the number of performance log events captured, to make sure the InfluxDB database can handle the load.
For example, start by capturing only a few specific types of objects types, methods etc for a limited set of apps, and then gradually increase/customize from there if needed.
What’s this?
“Performance log events” are a regular log events generated by the Qlik Sense engine service.
They get a special name in Butler SOS because they contain detailed performance data about the engine’s operations, something that can be very useful when monitoring the performance of the Qlik Sense engine.
These events make it possible to monitor how the engine is performing in close to real time.
Butler SOS can capture all or some of these events and store them in InfluxDB, where they can be used to create dashboards in Grafana - just like any other events or metrics captured by Butler SOS.
How it works
Once a log event has been identified as a performance log event (by looking at the event name, which is qseow-qix-perf in this case), Butler SOS will extract the data of interest from the event.
The data is then checked against a set of rules/filters to determine if the event should be stored in full detail in InfluxDB (=accepted) or not (=rejected).
For rejected events, a counter is incremented to keep track of how many events have been rejected.
The counters are written to InfluxDB at regular intervals, controlled by the Butler-SOS.qlikSenseEvents.influxdb.writeFrequency setting in the config file.
Once the data has been accepted, it is immediately stored in InfluxDB with a set of tags and fields, as described below.
Filtering of log events
There are two kinds of filters that can be defined in the config file:
Filters that apply to all apps
App specific filters that apply to specific apps
An event will be accepted if it matches either or both of the above filter types.
If an event does not match either of the two filter types, it will be rejected.
Filters applying to all apps
Global filters are defined in the Butler-SOS.logEvents.enginePerformanceMonitor.monitorFilter.allApps section of the config file.
All references to config file settings below are relative to this section.
The all-app filter consists of several parts/subfilters:
Apps for which events should be excluded, based on app ID and/or app name
Object types to include/exclude
Methods to include/exclude
An event must match all of the subfilters to be accepted by the all-app filter.
Enabling/disabling
It is possible to enabled/disable monitoring of all apps via the enable setting.
If disabled no events will be accepted via the global all-apps filter type.
Excluding apps
The appExclude[] array can be used to exclude specific apps from monitoring.
The effect is that events from all apps, except the apps listed in appExclude[], will be accepted (unless the event is rejected by some of the other all-app filters).
appExclude[] can contain zero or more objects, each with either an appId or an appName properties, or both.
If both properties are present, both must match the event’s data for it to be considered a match.
Filtering by object type
The objectType section can be used to filter events based on the object type of the event.
“Object types” are things like barchart, sheet, map, but also internal Sense objects like AppPropsList and appprops.
If objectType.allObjectTypes is set to true, all object types are monitored, except those listed in allObjectTypesExclude[].
someObjectTypesInclude[] is not used in this case.
If objectType.allObjectTypes is set to false, only the object types listed in someObjectTypesInclude[] will result in events being accepted.
allObjectTypesExclude[] is not used in this case.
Put differently: You can either start by including all object types and then specify which ones to exclude, or start with an empty list and add the object types you want to include.
Filtering by method
“Methods” refer to the various operations that the Sense engine performs.
Examples include Global::OpenApp, Global::GetProgress, Doc::GetAppLayout, Doc::CreateSessionObject.
The concepts for filtering by method are the same as for filtering by object type (see above).
Filter applying to specific apps
If the all-app filters are not useful (they may generate too much data, for example), it is possible to define app-specific filters in the Butler-SOS.logEvents.enginePerformanceMonitor.monitorFilter.appSpecific section of the config file.
All references to config file settings below are relative to this section.
App-specific filters are defined in the array app[].
It includes zero or more objects, each of which contains the following subfilters:
Apps to include, based on app ID and/or app name.
Object types to include/exclude
App objects to include/exclude
Methods to include/exclude
The concepts for including all (and then excluding some) or starting with an empty list and adding what you want to include are the same as for the all-app filters.
Enabling/disabling
It is possible to enabled/disable app specific monitoring via the enable setting.
If disabled no events will be accepted via the app specific filter type.
Including apps
The app[].include[] contains the app IDs and/or app names of the apps to include in the filter.
Example:
appSpecific:enable:true# Should app specific monitoring be done?app:- include:# What apps should be monitored?# If both appId and appName are specified, both must match the event's data for it to be considered a match.- appId:d7cf16f9-6a95-462a-9ff1-a6d413326de4- appName:Budget 2025- appId:6931136d-c234-4358-a40c-e37153aba7c9appName:Sales basket analysis
Filtering by object type
The objectType section can be used to filter events based on the object type of the event.
The concepts for filtering by object type are the same as for the all-app filters.
Filtering by app object
The appObject section can be used to filter events based on the object ID of the app object that the event is related to.
This is useful if you want to monitor only specific objects within an app, for example certain chart or table.
Getting the ID of an app object is a bit tricky, but for charts, tables and other UI elements it can be done in a few reasonably easy ways.
The below works for Qlik Sense 2024-May - your mileage may vary for other versions.
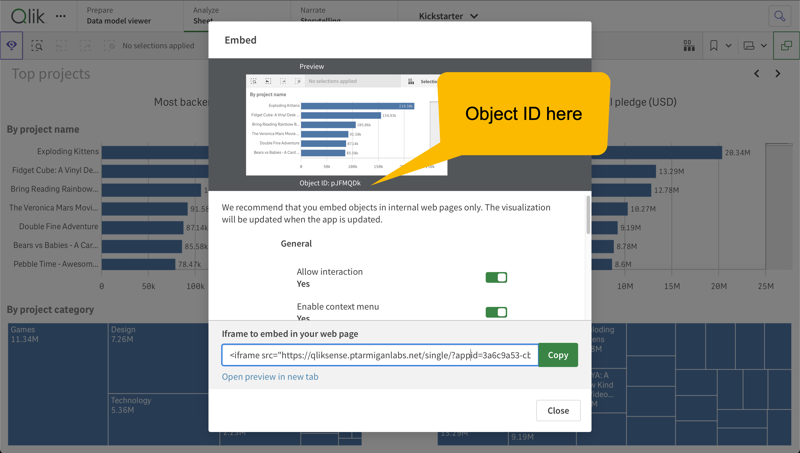
Share object from within app
Open the app, then move to the sheet the chart is on.
Right click the chart and select “Share”. Click “Embed”.
The object ID is shown under the preview image of the chart. It is also available in the Iframe URL as the obj parameter.
Get the object ID from the "Share" dialog within the Sense app itself.
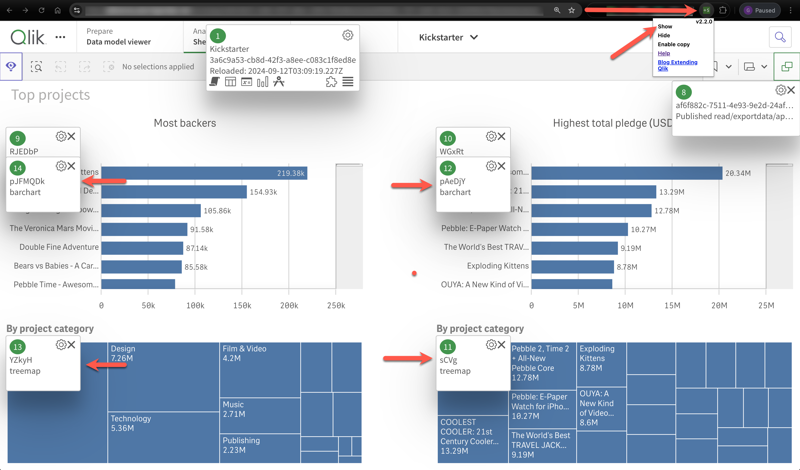
Use a Chrome extension
This works if you are using Chrome and have the Add Sense extension installed.
Open the app, then move to the sheet the chart is on.
Click the Add Sense icon in the Chrome toolbar, then “Show” in the menu that appears.
Popup windows will appear with information - including the object ID - about all UI objects on the sheet.
Get the object ID from the Add Sense extension in Chrome.
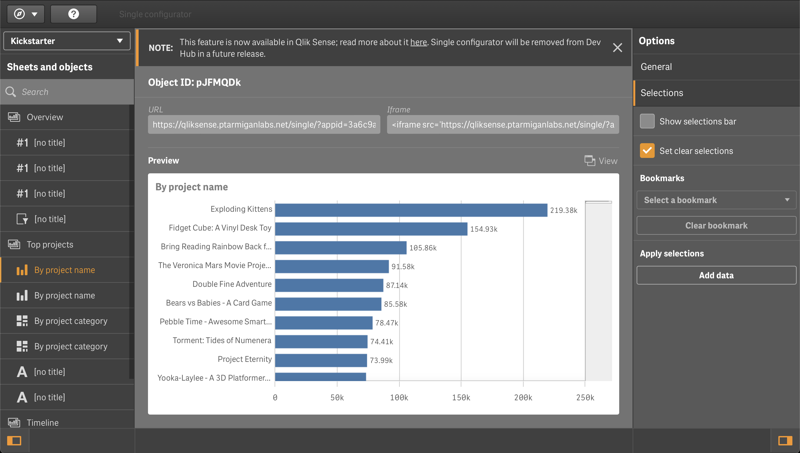
Use the “Single configurator” in the Qlik Sense Dev Hub
While it is possible to get the object ID from the Dev Hub, it is not recommended as the Dev Hub will be removed in a future version of Qlik Sense.
Still, if you are using a version of Sense that has the Dev Hub, you can get the object ID like this:
Being a template, it contains examples on how configuration may be done - not necessarily how it should be done.
For example, the env/DEV and foo/bar tags are optional and can be changed to something else, or removed all together if not used.
Butler-SOS:......# Log events are used to capture Sense warnings, errors and fatals in real timelogEvents:......enginePerformanceMonitor:# Detailed app performance data extraction from log eventsenable:false# Should app performance data be extracted from log events?appNameLookup:# Should app names be looked up based on app IDs?enable:falsetrackRejectedEvents:enable:false# Should events that are rejected by the app performance monitor be tracked?tags:# Tags are added to the data before it's stored in InfluxDB# - name: env# value: DEV# - name: foo# value: barmonitorFilter:# What objects should be monitored? Entire apps or just specific object(s) within some specific app(s)?# Two kinds of monitoring can be done:# 1) Monitor all apps, except those listed for exclusion. This is defined in the allApps section.# 2) Monitor only specific apps. This is defined in the appSpecific section.# An event will be accepted if it matches any of the rules in the allApps section OR any of the rules in the appSpecific section.allApps:enable:false# Should all apps be monitored?appExclude:# What apps should be excluded from monitoring?# If both appId and appName are specified, both must match the event's data for it to be considered a match.# - appId: 5b817efe-472d-43ce-8a31-6cce34af7de9# - appName: Sales forecast# - appId: f42d6b16-8faf-45ca-a783-59f9da47db6e# appName: Inventory analysisobjectType:allObjectTypes:true# Should all object types be monitored?allObjectTypesExclude:# If allObjectTypes is set to true, the object types in this array are excluded from monitoring.# someObjectTypesInclude (below) is ignored in that case.# - LoadModelList# - <Unknown># - linechart# - mapsomeObjectTypesInclude:# What object types should be included in monitoring?# Only applicable if allObjectTypes is set to false.# - LoadModelList# - sheet# - barchartmethod:allMethods:true# Should all methods be monitored?allMethodsExclude:# If allMethods is set to true, the methods in this array are excluded from monitoring.# someMethodsInclude (below) is ignored in that case.# - Global::OpenApp# - Doc::GetAppLayout# - Doc::CreateSessionObjectsomeMethodsInclude:# What methods should be included in monitoring?# Only applicable if allMethods is set to false.# - GenericObject::GetLayout# - GenericObject::GetHyperCubeContinuousDataappSpecific:enable:false# Should app specific monitoring be done?app:- include:# What apps should be monitored?# If both appId and appName are specified, both must match the event's data for it to be considered a match.# - appId: d7cf16f9-6a95-462a-9ff1-a6d413326de4# - appName: Budget 2025# - appId: 6931136d-c234-4358-a40c-e37153aba7c9# appName: Sales basket analysisobjectType:allObjectTypes:true# Should all object types be monitored?allObjectTypesExclude:# If allObjectTypes is set to true, the object types in this array are excluded from monitoring.# someObjectTypesInclude (below) is ignored in that case.# - table# - mapsomeObjectTypesInclude:# What object types should be included in monitoring?# Only applicable if allObjectTypes is set to false.# - sheet# - barchart# - linechart# - mapappObject:allAppObjects:true# Should all app objects be monitored?allAppObjectsExclude:# If allAppObjects is set to true, the app objects in this array are excluded from monitoring.# someAppObjectsInclude (below) is ignored in that case.# - objectId: AaBbCc# - objectId: DdEeFfsomeAppObjectsInclude:# What app objects should be included in monitoring?# Only applicable if allAppObjects is set to false.# - objectId: YJEpPTmethod:allMethods:true# Should all methods be monitored?allMethodsExclude:# If allMethods is set to true, the methods in this array are excluded from monitoring.# someMethodsInclude (below) is ignored in that case.# - Global::OpenApp# - Doc::GetAppLayout# - Doc::CreateSessionObjectsomeMethodsInclude:# What methods should be included in monitoring?# Only applicable if allMethods is set to false.# - GenericObject::GetLayout# - GenericObject::GetHyperCubeContinuousData......
Log appender XML files
Sample log appender files are available in the ZIP file available from the download page, in subfolders engine/proxy/repository/scheduler of config/log_appender_xml/ folder.
Note that the log appender files contain slightly different information for each Sense service (engine/proxy/repository/scheduler)!
Also keep in mind that the log appender files must be called LocalLogConfig.xml and placed in these directories on the all Sense servers:
C:\ProgramData\Qlik\Sense\Engine
C:\ProgramData\Qlik\Sense\Proxy
C:\ProgramData\Qlik\Sense\Repository
C:\ProgramData\Qlik\Sense\Scheduler
Tip
If you have more than one Sense server you strictly speaking don’t have to deploy log appenders to all servers.
If you are only interested in receiving log events from some servers and/or services (engine, proxy, repository, scheduler) - deploy the log appender files there.