This is the multi-page printable view of this section. Click here to print.
Monitor Qlik Sense engine performance in Grafana
The combination of Butler SOS and Grafana provides a powerful combo for monitoring the performance of your Qlik Sense engines.
Here are some recipes for how to set up Butler SOS to implement various specific monitoring scenarios.
1 - Track how long it takes to open Sense apps
Overview
Goal
The goal is to show how to use Butler SOS to track how long it takes to open apps on a Qlik Sense server.
This is useful for several reasons:
- It provides baseline for how long it takes to usually open apps on your server, and allows you to track changes over time.
- It can help identify apps that are slow to open, and then investigate why.
- Add Grafana based alerts to get notified when the time to open some app(s) exceeds a certain threshold.
- If end users complain about slow app opening times, the concept in this tutorial can be used to verify if there actually is a problem, and if so, where and how severe it is.
A Grafana chart showing this data could look something like this:
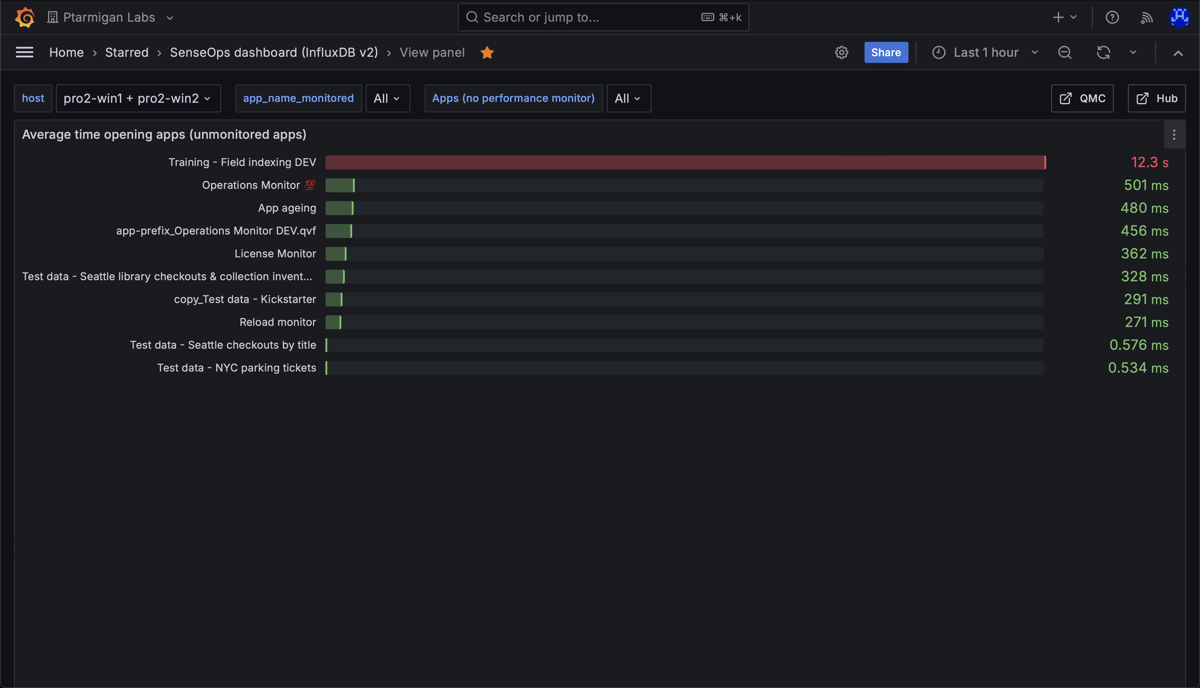
Chart showing mean time needed to open apps on a Qlik Sense server.
Prerequisites
- Butler SOS 11.0 or later. Downloads are available here.
- Store the data collected by Butler SOS in an InfluxDB v1 or v2 database. Setup instructions here
- XML appender files deployed on the Sense servers you want to monitor. The appender files tell Sense to send log events to Butler SOS via UDP messages. Setup instructions here.
- A reasonably recent version of Grafana. At the time of writing, Grafana 11.2 is the latest version.
- Data connections set up in Grafana to the InfluxDB database where Butler SOS stores its data.
Configure Butler SOS
- Enable engine performance monitoring.
- Enable tracking of rejected performance log events.
Butler SOS will track two things related to rejected events: Number of events (=counter), and the processing time for these events. - If detailed engine performance log events are enabled, Butler SOS will not create counters for these events. Instead, it will store the detailed data in InfluxDB.
This data can then be aggregated to create the same kind of counters as for rejected engine performance log events.
Note: “Rejected events” are engine performance log events that do not meet the criteria set up in Butler SOS for detailed engine performance monitoring.
Bottom line is that you can disable all detailed engine monitoring in Butler SOS, and only enable the tracking of rejected events.
This will give you a counter for the number of rejected events, and the processing time for these events, across a set of dimensions - of which engine “method” is one.
Or you can enable detailed engine performance monitoring for some apps, and only track rejected events for others.
Either way it will be possible to create Grafana charts that show the average time it takes to open apps on your Sense server(s).
Info
InfluxDB is the only supported database for this feature.
It is configured elsewhere in the YAML config file, more info here.
  # Shared settings for user and log events (see below)
  qlikSenseEvents:                  # Shared settings for user and log events (see below)
    influxdb:
      enable: true                  # Should summary (counter) of user/log events, and rejected events be stored in InfluxDB?
      writeFrequency: 20000         # How often (milliseconds) should event counts be written to InfluxDB?
    ...
    ...
    rejectedEventCount:             # Rejected events are events that are received from Sense, that are correctly formatted,
                                    # but that are rejected by Butler SOS based on the configuration in this file.
                                    # An example of a rejected event is a performance log event that is filtered out by Butler SOS.
      enable: true                  # Should rejected events be counted and stored in InfluxDB?
      influxdb:
        measurementName: rejected_event_count # Name of the InfluxDB measurement where rejected event count is stored
  ...
  ...
  # Log events are used to capture Sense warnings, errors and fatals in real time
  logEvents:
    udpServerConfig:
      serverHost: 0.0.0.0           # Host/IP where log event server will listen for events from Sense
      portLogEvents: 9996           # Port on which log event server will listen for events from Sense
    tags:
      - name: qs_tag1
        value: somevalue1
      - name: qs_tag2
        value: somevalue2
    ...
    ...
    enginePerformanceMonitor:           # Detailed app performance data extraction from log events
      enable: true                      # Should app performance data be extracted from log events?
      appNameLookup:                    # Should app names be looked up based on app IDs?
        enable: true
      trackRejectedEvents:
        enable: true                    # Should events that are rejected by the app performance monitor be tracked?
        tags:                           # Tags are added to the data before it's stored in InfluxDB
          - name: qs_tag1
            value: somevalue1
          - name: qs_tag2
            value: somevalue2
Configure Grafana
Create a Grafana chart (in an existing dashboard or a new one) that shows the average time it takes to open apps on your Sense server(s).
You do this by only show data in the chart for the engine method Global::OpenApp.
The definition of such a chart in Grafana could look something like this (slightly different set of apps selected, compared to screenshot above):
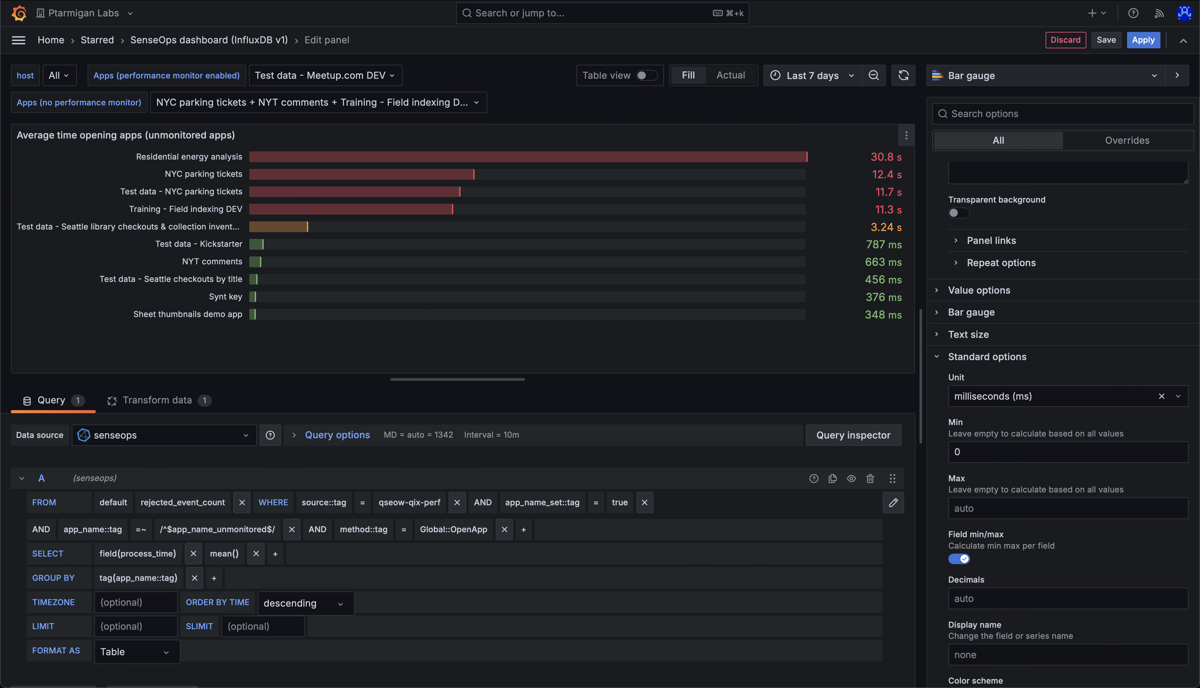
Definition of a Grafana chart showing the average time it takes to open apps on a Qlik Sense server.
Note how the tag method is set to Global::OpenApp. This is the engine method that is called when an app is opened in Qlik Sense, it covers the entire time it takes to open an app.
For apps currently not in memory, this will include the time it takes to load the app from disk (which can be significant for large apps). For apps already in memory, the time for this method will be much shorter.
Also note how the app_name tag is used to filter out only the apps you are interested in, by matching it to the app_name_unmonitored variable.
See below for detailed on how to set up this variable.
Grafana variables
By using Grafana variables, you can easily change which apps you want to show data for in the chart.
Here is how you can set up a variable in Grafana that allows you to select which apps to show data for (see above too, for how to use this variable in a chart):
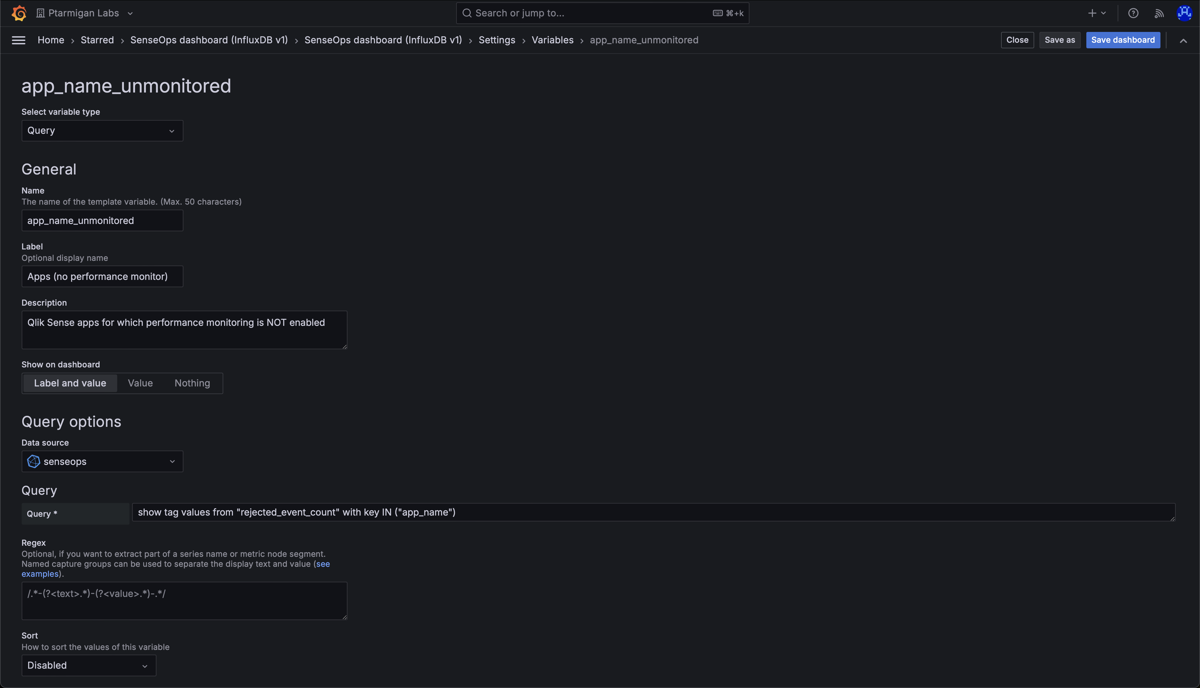
Create a Grafana variable that allows you to select which apps to show data for in a chart. The entire definition is not shown here, make sure to check the "Multi-value" and "Include All option" checkboxes too (further down that page).
Next steps
Using the concept in this tutorial, but with a slightly different chart definition in Grafana, it is possible to visualise the mean time for each method that Butler SOS tracks.
Combine with a app-selection filter variable in Grafana, and you can easily switch between different apps to see how long the various engine operations take in each of them:
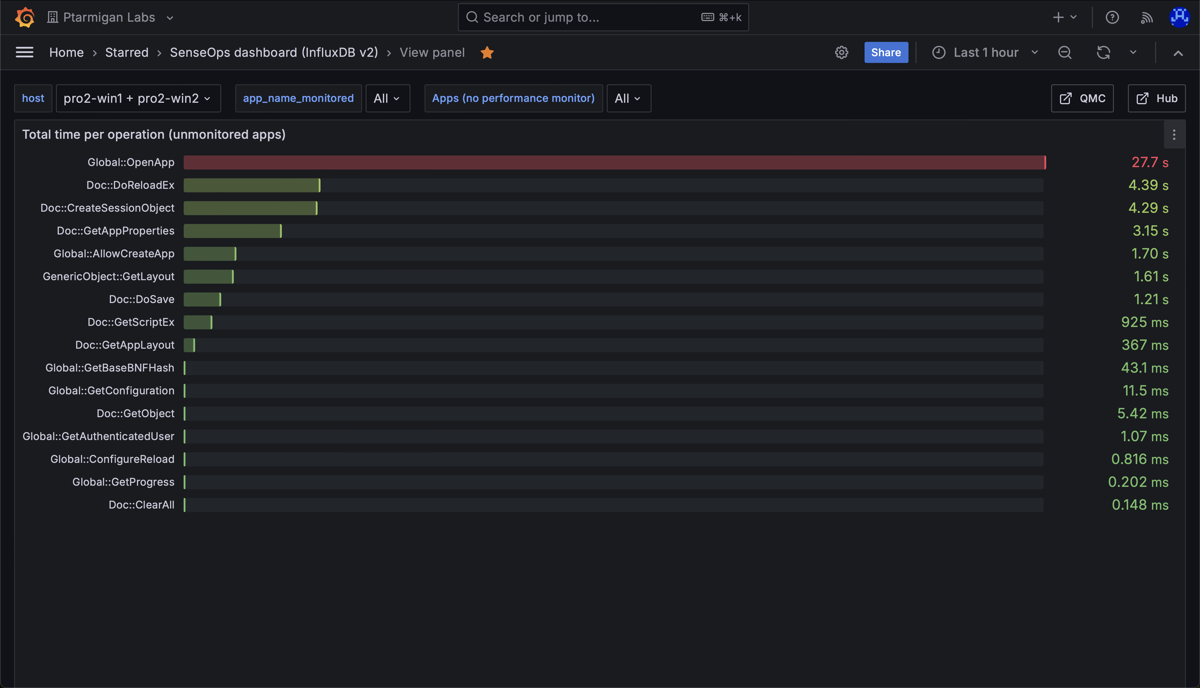
Chart showing mean time for all engine methods that were used during the selected time interval, for the selected apps(s).
2 - Find charts that are slow to update
Overview
Goal
The goal is to monitor how long each app object in a Sense app takes to open, and also identify which objects are slow to update.
This is useful for several reasons:
- Identify misbehaving charts, tables etc in important apps. This can be especially important for apps that are used by many users, or that are in some way business critical.
- To get a baseline for how long it takes for each app object (chart, table, …) to open and update. This can then be used to set thresholds for alerts, or to identify when performance degrades over time.
- An end user may experience slow performance when interacting with an app. By monitoring the time it takes for each object to both open and update when selections are done, you can identify which objects are slow to update.
A Grafana chart showing this data for the app “Training - Field indexing” could look something like this:
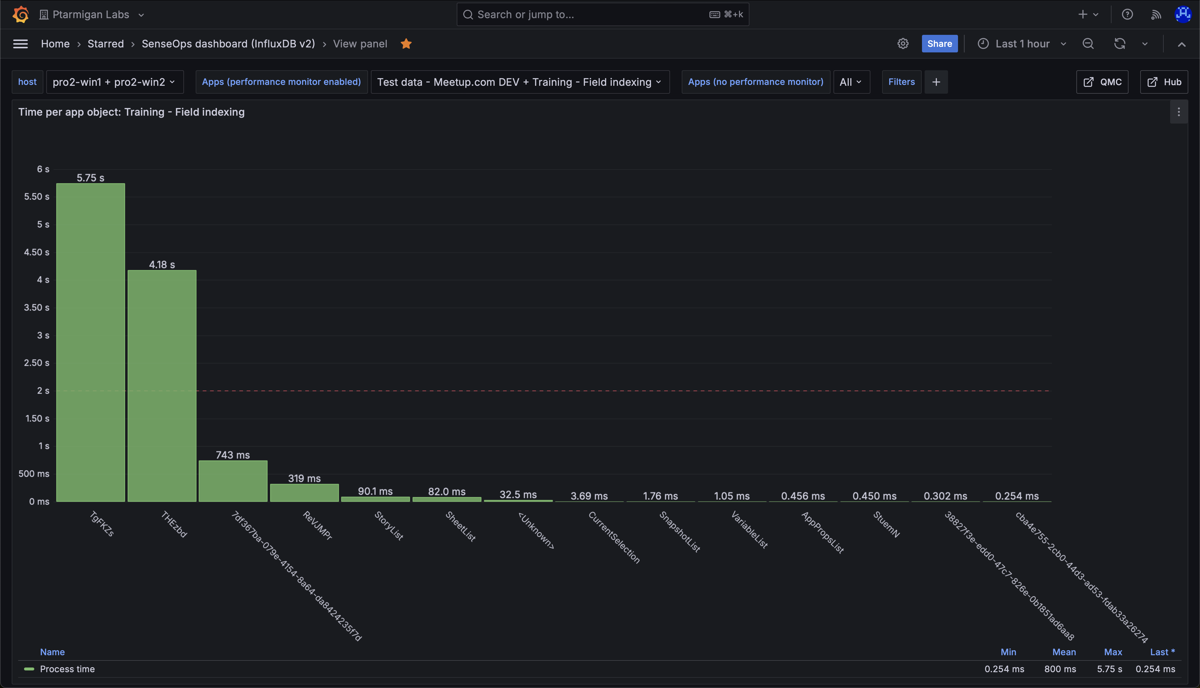
In order to understand the chart you must also know the ID of each app object. More on this further down this page.
Prerequisites
- Butler SOS 11.0 or later. Downloads are available here.
- Store the data collected by Butler SOS in an InfluxDB v1 or v2 database. Setup instructions here
- XML appender files deployed on the Sense servers you want to monitor. The appender files tell Sense to send log events to Butler SOS via UDP messages. Setup instructions here.
- A reasonably recent version of Grafana. At the time of writing, Grafana 11.2 is the latest version.
- Data connections set up in Grafana to the InfluxDB database where Butler SOS stores its data.
- A way to get the ID of each app object in the Sense apps you want to monitor. This can be done in several ways.
The app being monitored
The “Training - Field indexing” app is used as an example in this tutorial.
It’s a basic app that is used to explain to Sense developers how in-app data indexing works in Qlik Sense.
The consists of a single table with two fields, with 10 million rows of random data:
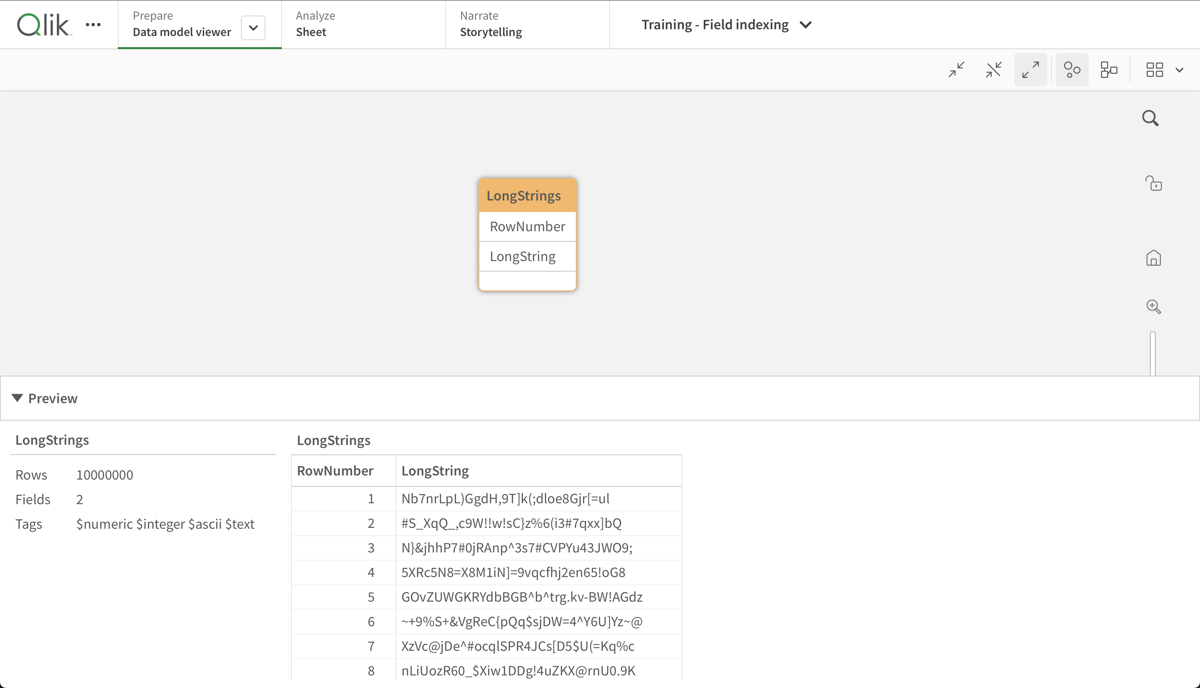
Data model in the "Training - Field indexing" app.
The “LongStrings” field contains random strings of 32 characters each.
The idea of the app is to stress the Sense engine by having it index random data - something that can be done, but also something that will be slower and slower as the number of rows or the length of the “LongStrings” field increases.
There are two things that may require a lot of time to update in this app:
- Opening the app when it is not already in memory. This will trigger an indexing of the data, which takes time given the randomness of the data and the number of rows.
- Making a selection in the app once it is open. This will trigger a re-indexing of the selected data, which can also take some time (depending on what/how much data is selected).
A word of caution
Enabling detailed performance monitoring can generate a lot of data, especially if it is enabled for many apps.
This can lead to a large amount of data being stored in InfluxDB, which in turn can lead to performance issues in InfluxDB and Grafana.
It is therefore recommended to only enable detailed performance monitoring for a limited number of apps, and possibly only for a limited time period.
For example, it can be useful to start off by monitoring all app objects in an app to begin with, and then limit the monitoring to only a few objects that are of special interest.
It’s also possible to limit the monitoring to only certain app object types, such as charts and tables, and not other object types.
Configure Butler SOS
Info
InfluxDB is the only supported database for this feature.
It is configured elsewhere in the YAML config file, more info here.
  # Shared settings for user and log events (see below)
  qlikSenseEvents:                  # Shared settings for user and log events (see below)
    influxdb:
      enable: true                  # Should summary (counter) of user/log events, and rejected events be stored in InfluxDB?
      writeFrequency: 20000         # How often (milliseconds) should event counts be written to InfluxDB?
  ...
  ...
  # Log events are used to capture Sense warnings, errors and fatals in real time
  logEvents:
    udpServerConfig:
      serverHost: 0.0.0.0           # Host/IP where log event server will listen for events from Sense
      portLogEvents: 9996           # Port on which log event server will listen for events from Sense
    tags:
      - name: env
        value: DEV
      - name: foo
        value: bar
    ...
    ...
    enginePerformanceMonitor:           # Detailed app performance data extraction from log events
      enable: true                      # Should app performance data be extracted from log events?
      appNameLookup:                    # Should app names be looked up based on app IDs?
        enable: true
      ...
      ...
      monitorFilter:                    # What objects should be monitored? Entire apps or just specific object(s) within some specific app(s)?
                                        # Two kinds of monitoring can be done:
                                        # 1) Monitor all apps, except those listed for exclusion. This is defined in the allApps section.
                                        # 2) Monitor only specific apps. This is defined in the appSpecific section.
                                        # An event will be accepted if it matches any of the rules in the allApps section OR any of the rules in the appSpecific section.
        allApps:
          enable: false                 # Should all apps be monitored?
          appExclude:                   # What apps should be excluded from monitoring?
                                        # If both appId and appName are specified, both must match the event's data for it to be considered a match.
t          objectType:
            allObjectTypes: false       # Should all object types be monitored?
            allObjectTypesExclude:      # If allObjectTypes is set to true, the object types in this array are excluded from monitoring.
                                        # someObjectTypesInclude (below) is ignored in that case.
            someObjectTypesInclude:     # What object types should be included in monitoring?
                                        # Only applicable if allObjectTypes is set to false.
          method:
            allMethods: false           # Should all methods be monitored?
            allMethodsExclude:          # If allMethods is set to true, the methods in this array are excluded from monitoring.
                                        # someMethodsInclude (below) is ignored in that case.
            someMethodsInclude:         # What methods should be included in monitoring?
                                        # Only applicable if allMethods is set to false.
        appSpecific:
          enable: true                  # Should app specific monitoring be done?
          app:
            - include:                  # What apps should be monitored?
                                        # If both appId and appName are specified, both must match the event's data for it to be considered a match.
                - appName: Training - Field indexing
              objectType:
                allObjectTypes: true   # Should all object types be monitored?
                allObjectTypesExclude:  # If allObjectTypes is set to true, the object types in this array are excluded from monitoring.
                                        # someObjectTypesInclude (below) is ignored in that case.
                someObjectTypesInclude: # What object types should be included in monitoring?
                                        # Only applicable if allObjectTypes is set to false.
              appObject:
                allAppObjects: true     # Should all app objects be monitored?
                allAppObjectsExclude:   # If allAppObjects is set to true, the app objects in this array are excluded from monitoring.
                                        # someAppObjectsInclude (below) is ignored in that case.
                someAppObjectsInclude:  # What app objects should be included in monitoring?
                                        # Only applicable if allAppObjects is set to false.
              method:
                allMethods: true        # Should all methods be monitored?
                allMethodsExclude:      # If allMethods is set to true, the methods in this array are excluded from monitoring.
                                        # someMethodsInclude (below) is ignored in that case.
                someMethodsInclude:     # What methods should be included in monitoring?
                                        # Only applicable if allMethods is set to false.
Configure Grafana
With the above Butler SOS configuration in place (remember to restart Butler SOS after making changes to its configuration file), you can now set up Grafana to visualize the data.
Here is a chart that shows the average time it takes for each app object in the “Training - Field indexing” app to open and update (the chart shown at the top of this page):
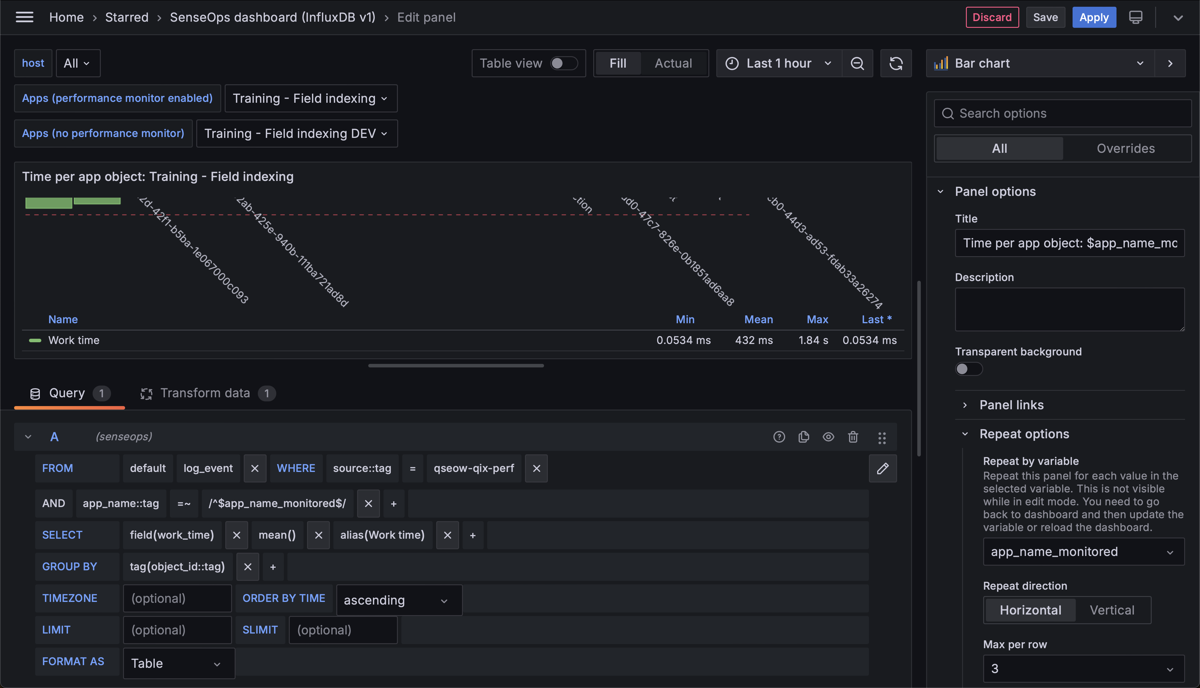
Definition of a Grafana chart showing the average time it takes to open and update each app object in the "Training - Field indexing" app.
Grafana variables
The chart repeats itself over the “app_name_monitored” Grafana variable, which means one chart is shown for each selected app in that variable filter (at the top of the Grafana dashboard).
The variable is set up like this:
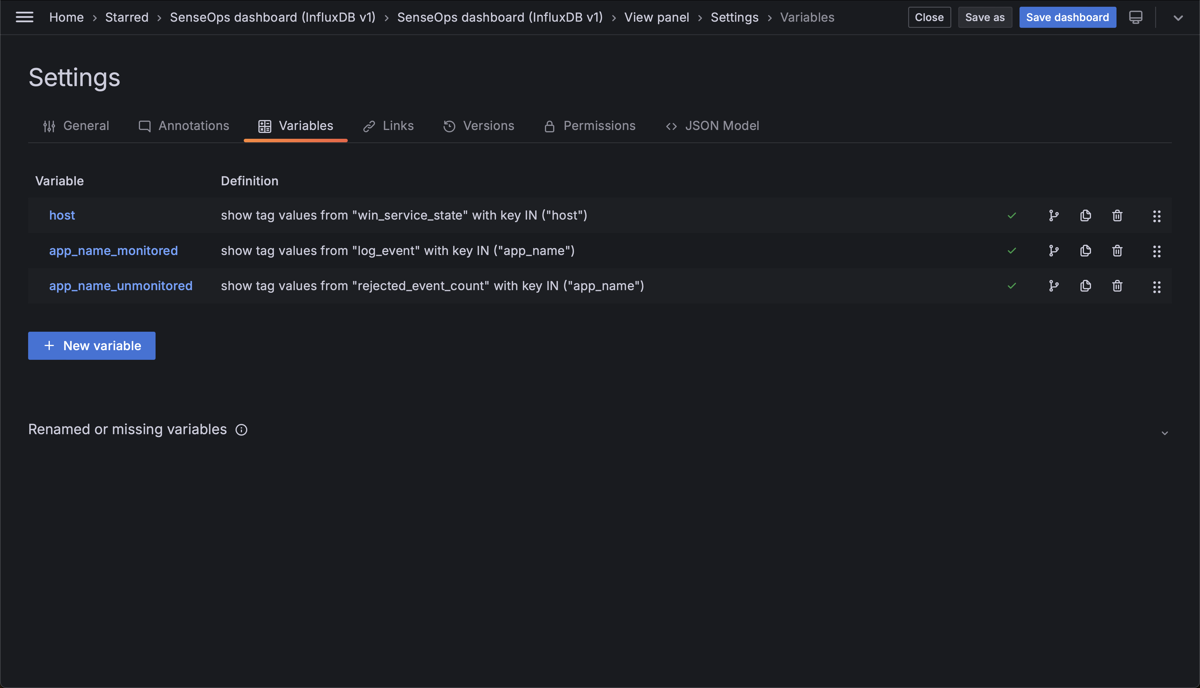
List of variables in a SenseOps dashboard in Grafana.
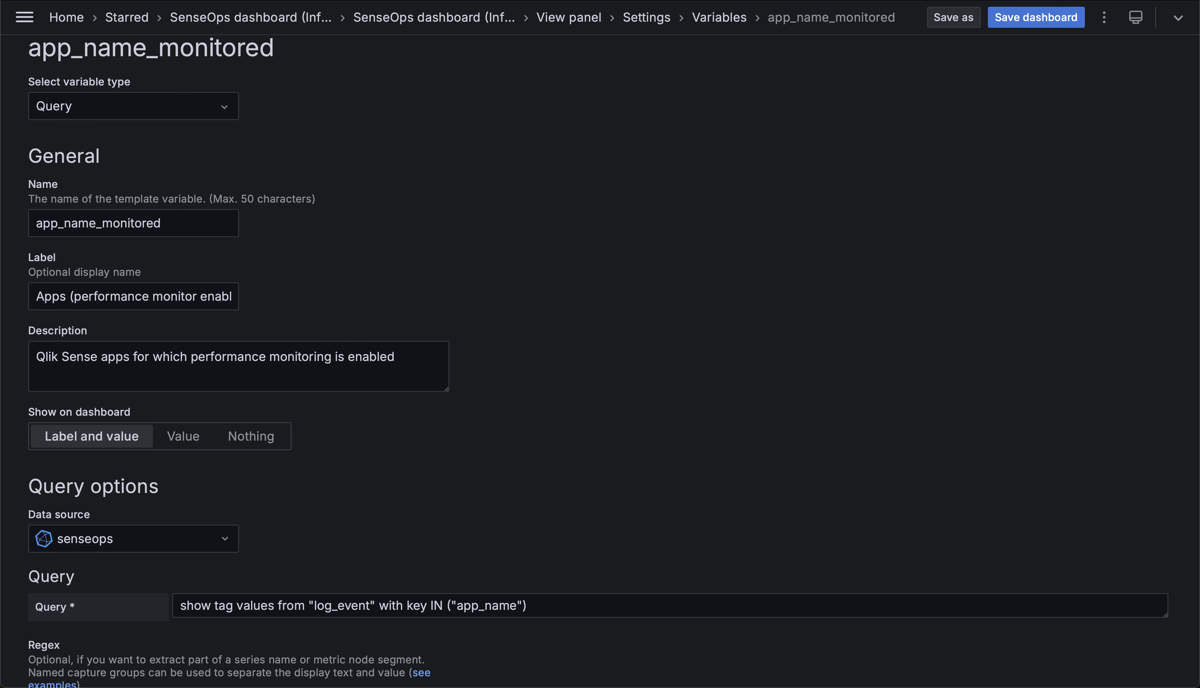
Definition of the "app_name_monitored" Grafana variable.
Next steps
Given the detailed information captured about all app objects in the “Training - Field indexing” app, it is possible to slice and dice the data in many ways.
For example, it could be interesting to see what kinds of app objects use most time, and which ones are faster.
Something like this:
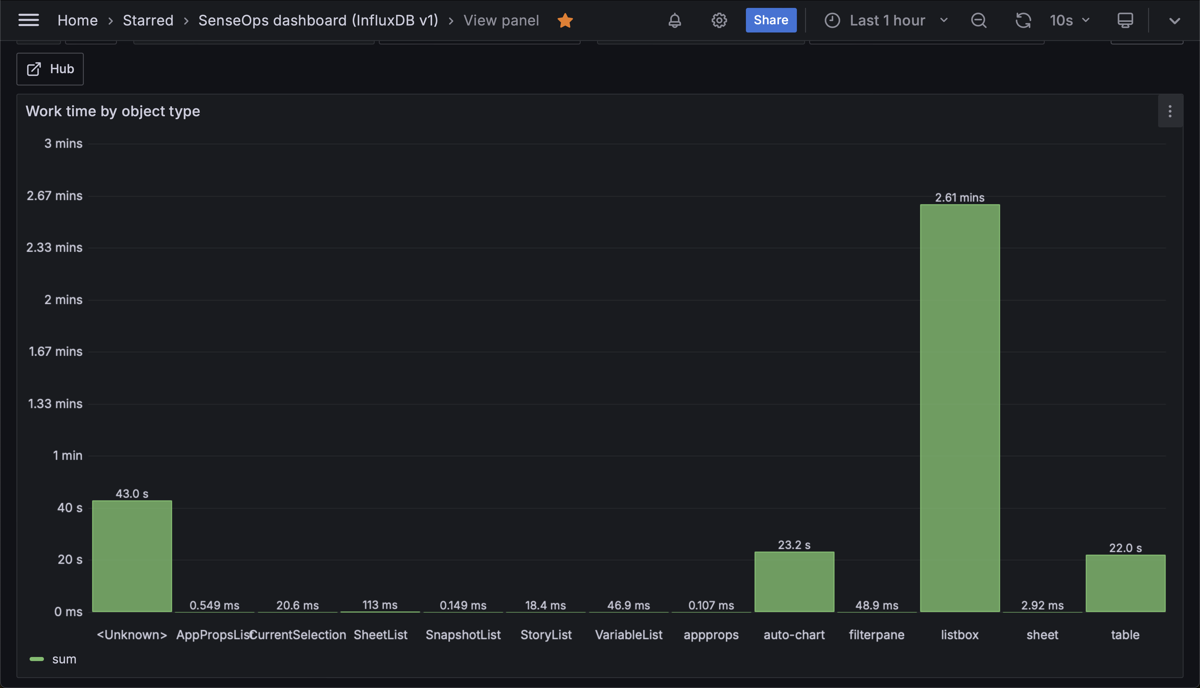
Chart showing the _total_ time spent updating the "Training - Field indexing" app, grouped by object type, during last hour.