This is the multi-page printable view of this section. Click here to print.
Concepts
- 1: App metrics
- 2: Sessions & Connections
- 3: Log events
- 3.1: Log events overview
- 3.2: Errors & Warnings
- 3.3: Getting rid of Sense log noise
- 3.4: App performance monitoring
- 4: Visualise Butler SOS config file
1 - App metrics
It’s where data and logic is kept in the Qlik Sense system.
Tip
The use cases page contains related information that may be of interest.
App metrics
When it comes to apps we basically want to track which apps are loaded into the monitored Sense server(s).
In-memory vs loaded vs active apps
Given the caching nature of Qlik Sense, some apps will be actively used by users and some will just be sitting there without any current connections.
Sense group apps into three categories, which are all available in Butler SOS:
- Active apps. An app is active when a user is currently performing some action on it.
- Loaded apps. An app that is currently loaded into memory and that have open sessions or connections.
- In-memory apps. Loaded into memory, but without any open sessions or connections.
Butler SOS keeps track of both app IDs and names of the apps in each of the three categories.
More info on Qlik help pages.
App names are tricky
Qlik Sense provides app health info based on app IDs.
I.e. we get a list of what app IDs are active, loaded and in-memory.
That’s all good, except those IDs don’t tell us humans a lot.
We need app names.
We can get those app names by simply asking Sense for a list of app app IDs and names, but there are a couple of challenges here:
- This query to Sense may not be complex or expensive if done once, but if we do it several times per minute it will create an unwanted load on the Sense server(s).
- There is the risk of an app being deleted between we get health data for it and the following appID-name query. Most apps are reasonably long-lived, but the risk is still there.
Right or wrong, Butler SOS takes this approach to the above:
- App name queries are done on a separate schedule. In the main config file you can configure both if app names should even be looked up, and how often that lookup should happen. This puts you in control of how up-to-date app names you need in your Grafana dashboards.
- The risk of a temporary mismatch between app IDs and app names in Butler SOS remains, and will even get worse if you query app names infrequently. Still, this is typically a very small problem (if even a problem at all).
2 - Sessions & Connections
Who are using the Sense environment right now?
This is a very basic question a sysadmin will ask over and over again.
This question is answered in great detail by the excellent Operations Monitor app that comes with Qlik Sense out of the box.
But that app gives a retrospective view of the data - it does not provide real-time insights.
Butler SOS focus on the opposite: Give as close to real-time insights as possible into what’s happening in the Sense environment.
User behavior is then an important metric to track, more on this below.
Proxy sessions
A session, or more precisely a proxy session starts when a user logs into Sense and ends when the user logs out or the session inactivity timeout is reached.
There may be some additional corner-case variants, but the above is the basic, high-level definition of a proxy session.
Tip
Some useful lingo: The events that can happen for sessions are that they can start and stop.
They can also timeout if the user is inactive long enough (the exact time depends on settings in the QMC).
As long as a user uses the same web browser and doesn’t use incognito mode or similar, the user will reuse the same session for all access to Sense.
On the other hand: If a user uses different browsers, incognito mode etc, multiple sessions will be registered for the user in question. There is a limit to how many sessions a user can have at any given time.
Mashups and similar scenarios where Sense objects are embedded into web apps may result in multiple sessions being created. Whether or not this happens largely depends on how the mashup was created.
A good overview of what constitutes a session is found here.
Proxy session vs engine sessions
The proxy service is responsible for handling users connecting to Qlik Sense.
When a user connects a proxy session is created - assuming the user has permissions to access Sense.
When interacting with individual charts in a Sense app, engine sessions are used to interact with the engine service.
A user typically thus have one (or a few) proxy session and then a larger number of transient engine sessions.
More info here.
Connections
A user may open more than one connection within a session.
A connection is opened when the user opens an app in a browser tab, or when a user opens a mashup which in turn triggers a connection to a Sense app to be set up.
Closing the browser tab will close the connection.
Tip
Some useful lingo: The events that can happen for connections are that they can be opened and closed.
User events
Butler SOS offers a way to monitor individual session and connection events, as they happen.
This is done by Butler SOS hooking into the logging framework of Qlik Sense, which will notify Butler SOS when users start/stop sessions or connections are being open/closed.
The concept is identical to how Butler SOS gets metrics and log events from Sense.
A blacklist in the main config file provides a way to exclude some users (e.g. system accounts) from the user event monitoring.
Configuration of user events monitoring is done in the main config file’s Butler-SOS.userEvents section.
A step-by-step instruction for setting up user event monitoring is available in the Getting started section.
More info about the config file is available here.
On an aggregated level this information is useful to understand how often users log in/out, when peak ours are etc.
On a detailed level this information is extremely useful when trying to understand which users had active sessions when some error occurred.
Think investigations such as “who caused that 250 GB drop in RAM we were just alerted about?”.

3 - Log events
3.1 - Log events overview
Butler SOS can capture very detailed information about individual charts in apps - or just the high-level information about the apps themselves.
This page explains the different levels of engine performance data that Butler SOS can provide.
Three levels of log event data
Depending on the needs of the Sense admin, Butler SOS can provide three levels of log event data, ranging from high-level counters to detailed performance data for individual charts in apps.
The most high-level data is the “log event counters”, which can be enabled/disabled independently of the more detailed engine performance events.
The engine performance events are then divided into “rejected” and “accepted” events, with the latter being the most detailed.
It’s usually a good idea to start with the high-level metrics and then enable more detailed metrics if needed.
Info
The counters for top-level metrics and rejected performance log events are reset to zero every time Butler SOS is restarted, as well as every time counter data is sent to InfluxDB.
I.e. the counters are not cumulative over time, but rather show the number of events since the last restart/save.
This makes it easy to create Grafana dashboards that show the number of events during the selected time interval, for example.
Just sum the counter fields in the Grafana chart, and you’re done.
High level: Event counters
Event counters can be enabled independently of engine performance events.
The counters are configured in the Butler-SOS.qlikSenseEvents.eventCount section in the Butler SOS config file.
When enabled, Butler SOS will count the number of log and user events that are received from Qlik Sense via UDP messages.
The counters are split across several dimensions, described in the reference section.
These counters can be used to get a general idea of which servers generate the most log events, which Windows services generate the most events, and so on.
A Grafana dashboard can look like this:
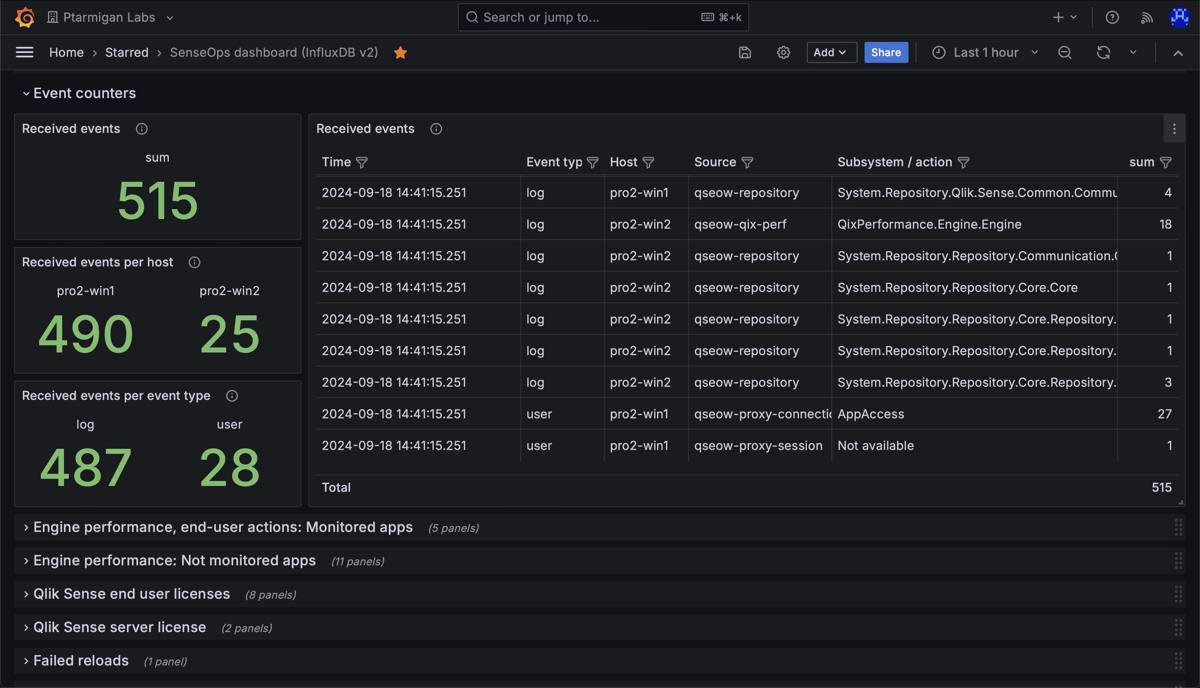
Butler SOS event counter charts in Grafana.
Medium: Rejected performance log events
If an event with source=qseow-qix-perf does not meet the include filter criteria in the config file, it is considered a “rejected” event.
For rejected events a set of counters are kept, broken down by dimensions described in the reference section.
As both app id/name and the engine method (for example Global::OpenApp) are included as a dimension in the InfluxDB data, it’s possible to create Grafana dashboards that show how long time each app takes to open.
A Grafana dashboard can look like this:

Butler SOS rejected performance log events dashboard in Grafana.
In the upper right chart above we can see that all apps except one open quickly.
Might be a good idea to investigate why the app “Training - Field indexing DEV” takes so long to open.
More Grafana examples here.
Detailed: Accepted performance log events
If an event with source=qseow-qix-perf does meet the include filter criteria in the config file, it is considered an “accepted” event.
All accepted events will result in a set of detailed performance metrics being stored in InfluxDB.
The metrics are described in the reference section.
An example Grafana dashboard can look like this:
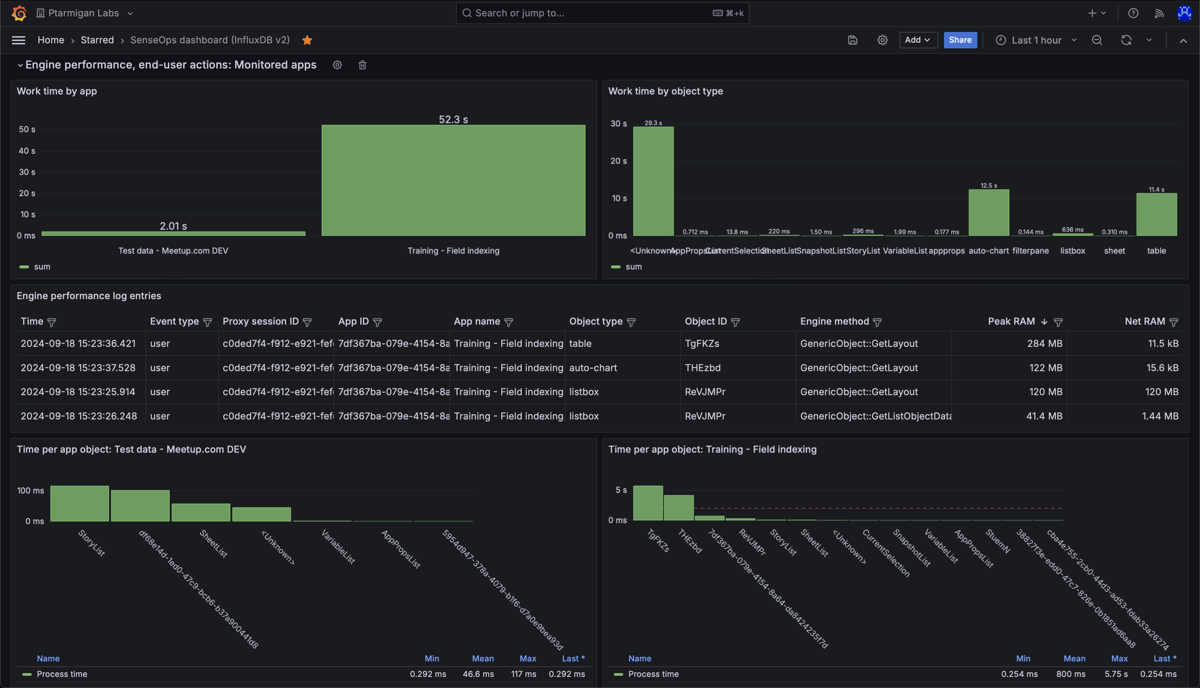
Butler SOS accepted performance log events dashboard in Grafana.
The upper left chart shows total “work time” per app, during the selected time interval.
Work time is the time it takes for the engine to do the actual work, like calculating the chart data after a selection is made by the user.
The chart shows that the app “Training - Field indexing” has a high work time.
This does not have to be a problem, but it’s worth investigating why the number is so high.
The bottom two charts show the work time per chart object, per app.
The chart tells us that two app objects take on the order of 5 seconds each to calculate.
Which objects are these?
Open the app in Chrome and use the “Add Sense for Chrome” extension to find out.
Turns out it’s the two tables (object 10 and 11) that take a long time to update - that’s expected (but not ideal!) as they contain a lot of complex data that takes time to index.
If the update times get even longer, it might be a good idea to look into the data model and see if it can be optimized.

The "Add Sense for Chrome" extension showing the object ID for objects on a sheet.
3.2 - Errors & Warnings
Warnings lead to errors.
Errors lead to unhappy users.
Unhappy users call you.
Wouldn’t you rather get the warnings yourself, before anyone else?
Sense log events
Sense creates a large number of log files for the various parts of the larger Qlik Sense Enterprise environment.
Those logs track more or less everything - from extensions being installed, users logging in, to incorrect structure of Active Directory user directories.
Butler SOS monitors select parts of these logs and provides a way to get an aggregated, close to real-time view into warnings and errors.
The log events page has more info on this.
Grafana dashboards
Butler SOS stores the log events in InfluxDB together with all other metrics.
It is therefore possible to create Grafana dashboards that combine both operational metrics (apps, sessions, server RAM/CPU etc) with warning and error related charts and tables.
Showing warnings and errors visually is often an effective way to quickly identify developing or recurring issues.
Example 1: Circular Active Directory references
Here is an example where bursts of warnings tell us visually that something is not quite right.
50-60 warnings arriving in bursts every few minutes - something is not right.
There is also a single error during this time period - what’s going on there?
We can then look at the actual warnings (=log events) to see what’s going on.
In this case it turns out to be circular references in the Active Directory data used in Qlik Sense. Not a problem with Sense per se, but still something worth looking into:


Looking at that single error then, it turns out it’s caused by a task already running when it was scheduled to start:

Example 2: Session bursts causing proxy overload
This example is would have been hard or impossible to investigate without Butler SOS.
The problem was that the Sense environment from time to time became very slow or even unresponsive. A restart solved the problem.
Grafana was set up to send alerts when session count increase very rapidly. Thanks to this actions could be taken within minutes from the incident occurring.
Looking in the Grafana dashboard could then show something like below.
New sessions started every few seconds, all coming from a single client. The effect for this Sense user was that Sense was unresponsive.
The log events section of the Grafana dashboard showed that this user had been given 5 proxy sessions, after which further access to Sense internal resources (engine etc) was denied.

In this case the problem was caused by a mashup using iframes that when recovering from session timeouts caused race conditions, trying to re-establish a session to Sense over and over again.
Alerts
Both New Relic and Grafana includes a set of built-in alert features that can be used to set up alerts as well as forward them to destinations such as Slack, MS Teams, email, Discord, Kafka, Webhooks, PagerDuty and others.
More info about Grafana alerts here.
New Relic alerts described here.
3.3 - Getting rid of Sense log noise
Let’s say Butler SOS is configured to receive log events from Qlik Sense Enterprise, specifically warnings and errors.
In the best of worlds there will be few such events, but in reality there are usually more than expected. It’s not uncommon for a Sense cluster to generate hundreds or even thousands of error and warning events per hour.
By categorizing these events, Butler SOS can help you focus on the most important ones, and ignore the rest.
What kind of log events are there?
Log events originate from the Qlik Sense logging framework, which is called Log4Net.
The framework is responsible for logging things to Qlik Sense’s own log files, but can also be extended in various ways - for example by sending log events as UDP messages to Butler SOS.
This is done by deploying XML files in well defined folders on the Sense servers, these files are called “log appender files”.
Log4Net assigns a log level to all log events, these are on of the following: DEBUG, INFO, WARN, ERROR and FATAL.
The log appender files that ship with Butler SOS are configured to send WARN and ERROR events to Butler SOS, from the repository, proxy, engine, and scheduler services in Qlik Sense.
So, what Butler SOS receives is a stream of log events, with a log level of either WARN or ERROR, from the repository, proxy, engine, and scheduler services in Qlik Sense.
That’s all fine, but it’s not uncommon for a Sense cluster to generate way more warnings and errors than expected by the Sense admin person.
The challenge then becomes to focus on the most important events, and ignore the rest.
How to categorize log events
Let’s say there are 1000 log events per hour.
When looking at the log events, it turns out that 95% of them are either about
- people getting https certificate warnings when accessing the Qlik Sense Hub…
- …people getting access denied errors when trying to open an app…
- …or that Sense has detected something unusual (like a circular reference) in an Active Directory user directory.
Those events are not good, but they are not critical either.
They are things that can be fixed in a controlled way, and they won’t bring the Sense cluster to its knees.
But there may also be a few log events that are related to the Sense central node not being able to connect to one of the rim nodes. Maybe the events occur at irregular intervals and therefore more difficult to detect.
These events are critical, and should be investigated immediately.
If Butler SOS is configured to categorize the certificate warnings as “user-certificate, the Active Directory warnings as “active-directory” and the access-denied warnings as “access-denied”, that information is then added as tags to the event data that is stored in InfluxDB.
This means that when creating Grafana dashboards, it’s possible to create a table that show the number of “user-certificate” events and the number of “active-directory” events - and the number of “other” events.
Another Grafana panel can show detailed event info for the “other” events, making it easy to investigate what they are about.
By categorizing log events it is possible to get rid of the log noise that hides the important events.
Sample Grafana dashboard
A few charts and tables give a good overview of the log events.
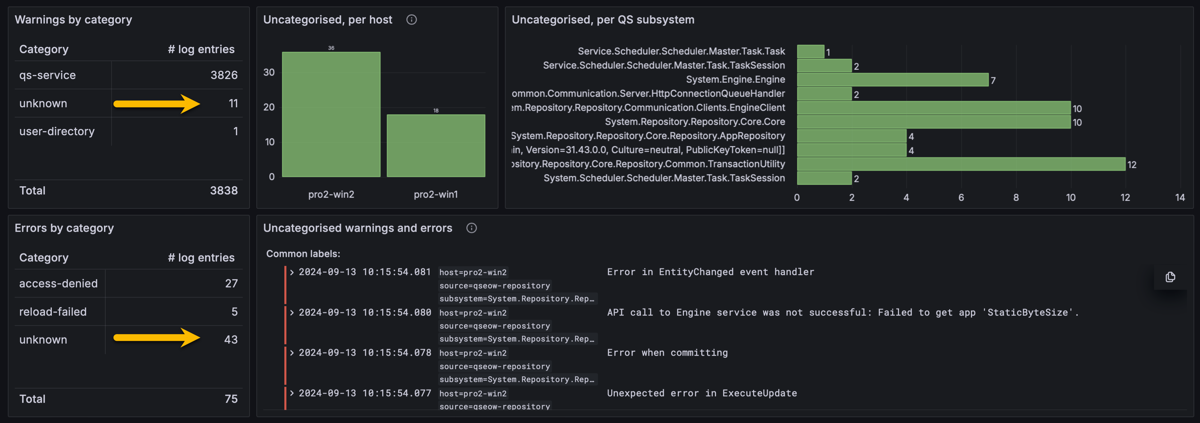
Butler SOS log events dashboard in Grafana. Uncategorized events by the yellow arrows, and in table/charts to the right.
Butler SOS Configuration
The following settings in the Butler SOS config file were used to categorize the log events that were used in the Grafana dashboard above.
Butler-SOS:
  ...
  ...
  # Log events are used to capture Sense warnings, errors and fatals in real time
  logEvents:
    udpServerConfig:
      serverHost: 0.0.0.0           # Host/IP where log event server will listen for events from Sense
      portLogEvents: 9996           # Port on which log event server will listen for events from Sense
    tags:
      - name: env
        value: DEV
      - name: foo
        value: bar
    source:
      engine:
        enable: true                   # Should log events from the engine service be handled?
      proxy:
        enable: true                   # Should log events from the proxy service be handled?
      repository:
        enable: true                   # Should log events from the repository service be handled?
      scheduler:
        enable: true                   # Should log events from the scheduler service be handled?
      qixPerf:
        enable: true                   # Should log events relating to QIX performance be handled?
    categorise:                        # Take actions on log events based on their content
      enable: true
      rules:                           # Rules are used to match log events to filters
        - description: Find access denied errors
          logLevel:                    # Log events of this Log level will be matched. WARN, ERROR, FATAL. Case insensitive.
            - WARN
            - ERROR
          action: categorise           # Action to take on matched log events. Possible values are categorise, drop
          category:                    # Category to assign to matched log events. Name/value pairs.
                                       # Will be added to InfluxDB datapoints as tags.
            - name: qs_log_category
              value: access-denied
          filter:                      # Filter used to match log events. Case sensitive.
            - type: sw                 # Type of filter. sw = starts with, ew = ends with, so = substring of
              value: "Access was denied for User:"
            - type: so
              value: was denied for User
        - description: Find AD issues
          logLevel:                    # Log events of this Log level will be matched. WARN, ERROR, FATAL. Case insensitive.
            - ERROR
            - WARN
          action: categorise           # Action to take on matched log events. Possible values are categorise, drop
          category:                    # Category to assign to matched log events. Name/value pairs.
                                       # Will be added to InfluxDB datapoints as tags.
            - name: qs_log_category
              value: user-directory
          filter:                      # Filter used to match log events. Case sensitive.
            - type: sw                 # Type of filter. sw = starts with, ew = ends with, so = substring of
              value: Duplicate entity with userId
        - description: Qlik Sense service down
          logLevel:                    # Log events of this Log level will be matched. WARN, ERROR, FATAL. Case insensitive.
            - WARN
          action: categorise           # Action to take on matched log events. Possible values are categorise, drop
          category:                    # Category to assign to matched log events. Name/value pairs.
                                       # Will be added to InfluxDB datapoints as tags.
            - name: qs_log_category
              value: qs-service
          filter:                      # Filter used to match log events. Case sensitive.
            - type: sw                 # Type of filter. sw = starts with, ew = ends with, so = substring of
              value: Failed to request service alive response from
            - type: so                 # Type of filter. sw = starts with, ew = ends with, so = substring of
              value: Unable to connect to the remote server
        - description: Reload task failed
          logLevel:                    # Log events of this Log level will be matched. WARN, ERROR, FATAL. Case insensitive.
            - WARN
            - ERROR
          action: categorise           # Action to take on matched log events. Possible values are categorise, drop
          category:                    # Category to assign to matched log events. Name/value pairs.
                                        # Will be added to InfluxDB datapoints as tags.
            - name: qs_log_category
              value: reload-failed
          filter:                      # Filter used to match log events. Case sensitive.
            - type: sw                 # Type of filter. sw = starts with, ew = ends with, so = substring of
              value: Task finished with state FinishedFail
            - type: sw                 # Type of filter. sw = starts with, ew = ends with, so = substring of
              value: Task finished with state Error
            - type: ew                 # Type of filter. sw = starts with, ew = ends with, so = substring of
              value: Reload failed in Engine. Check engine or script logs.
            - type: sw                 # Type of filter. sw = starts with, ew = ends with, so = substring of
              value: Reload sequence was not successful (Result=False, Finished=True, Aborted=False) for engine connection with handle
      ruleDefault:                     # Default rule to use if no other rules match the log event
        enable: true
        category:
          - name: qs_log_category
            value: unknown
3.4 - App performance monitoring
Users complain about an app being slow to open.
Or that a certain chart is slow to update.
Butler SOS can help you understand what’s going on by providing very detailed, real-time performance metrics for all apps or just a few.
For all charts or just some.
Knowing is better than guessing
Monitoring a Qlik Sense environment - or any system - comes down to knowing what’s going on.
If you don’t know what’s going on, you’re guessing.
And if you’re guessing, you’re not in control.
If you’re not in control, well - that’s a bad place to be..
Qlik’s performance analysis apps
Qlik has a couple of apps that can be used to analyze performance data from Qlik Sense Enterprise on Windows.
First, the Operations Monitor app ships with every instance of Qlik Sense Enterprise on Windows.
This app is the go-to tool for retrospective analysis of what’s going on in a Sense environment.
The app puts all the great features of Qlik Sense to good use on top of the Sense logs it has access to.
What apps were reloaded when, which reload tasks failed most, which users are most active, etc.
Then there’s the Telemetry Dashboard app.
It uses the same data as Butler SOS, but as it’s a Sense app it must be reloaded in order to get updated data.
Butler SOS on the other hand uses real-time delivery of the events from Sense’s Log4Net logging framework.
If you want to do retrospective analysis of detailed performance data, the Telemetry Dashboard app is an excellent choice.
This page provides additional info about the telemetry logging available in Qlik Sense.
Info
Qlik’s Telemetry Dashboard app requires you to enable performance logging for the Engine service in the QMC.
The effect is that you get a new set of Sense log files that are likely to quickly become BIG.
By using Butler SOS you can get the same metrics and insights, but without the need to enable performance logging in the QMC.
I.e. saving disk space and getting real-time data instead of data that’s hours or days old.
Which is better? That depends on your use case and what you want to achieve.
Lots of use cases
Categorization of events can be done in different ways depending on what you want to achieve.
Here are some examples of what can be done using Butler SOS:
- You want high level insights into how long various app actions take for all apps.
- Turn on engine performance monitoring in general, but no need for app details
- Enable tracking of rejected performance log events. This will capture high-level metrics (such as time used and number of events) for all methods/commands used in the engine.
- Create a Grafana dashboard that shows the average time taken for each method/command.
- 🎉 You get immediate, visual insight into how fast (or slow) apps open.
- Users complain about an app being slow to open.
- Turn on performance logging for app open events from that particular app. Store data in InfluxDB.
- Create a Grafana dashboard that shows a histogram of app open times for that app.
- 🎉 You get hard numbers on how long the app usually takes to often, and what the outliers are.
- A certain chart is slow to update.
- Turn on performance logging for that specific app and chart. Store data in InfluxDB.
- Create a Grafana dashboard that shows a histogram of chart update times for that chart. Or add a new chart to an existing dashboard.
- Define alerts in Grafana so you get notified if rendering time for the chart exceeds some threshold.
- Use Butler SOS’ user events features to keep track of what users access the app when the chart is slow.
- 🎉 You know in real-time how many and which users were impacted, and get a notification when it happens.
- You suspect that an app has a poorly designed data model.
- Enable detailed performance monitoring for that specific app
- Create a Grafana dashboard that
- tracks the “traverse_time” metric. This metric shows how long it takes to traverse the data model. A poorly designed data model tend to have longer traverse times. Break it down by app object and proxy session.
- tracks the render time for each chart and table in the app. Slow charts and tables may be caused by a bad data model, but not always. Lots of (complex) data may also be a reason.
- 🎉 You get real-time insight into which objects are slow for what users, due to a bad data model in that specific app.
Performance log events
A “performance log event” is a log event that originates from the Qlik Sense engine, more specifically from the “QixPerformance.Engine.Engine” subsystem.
They are sent to Butler SOS as UDP messages, just like regular log events (using the same port).
The performance log events have INFO log level in the Sense logs but still provide very detailed information about what the engine is doing.
Warning
The XML appender files that ship with Butler SOS don’t do any filtering of log events.
This means that all events from the “QixPerformance.Engine.Engine” subsystem are sent to Butler SOS, regardless of what they are about.
The filtering is then done (if configured) by Butler SOS.
For large Sense environments, there can therefore be a lot of UDP messages sent to Butler SOS.
This is usually not a problem, but at some point Butler SOS may become overwhelmed and start dropping messages.
Use the log message counter feature in Butler SOS to keep track of how many messages are received - this can be a good indicator of how close Butler SOS is to its limits.
Accepted vs rejected performance log events
Due to the potential high volume of performance log events sent by Qlik Sense, Butler SOS has a filtering feature that can be used to only store the events that are of interest.
Events that meet the filtering criteria are called “accepted” events, and events that don’t are “rejected” events.
Accepted events are stored in InfluxDB, including detailed performance metrics for the event.
Details on what is stored for accepted events can be found in the reference section.
Rejected events are not stored in InfluxDB, but are still counted by Butler SOS.
This feature can be enabled/disabled in the Butler SOS config file. More info here.
Data available for accepted and rejected events
The full set of data stored for accepted events is described in the reference section.
Suggested workflows for different use cases
For some use high-level cases, such as identifying apps that are slow to load, the data for rejected events may be sufficient.
Other uses cases, such as monitoring the behavior of specific app objects (charts, tables etc), require the detailed data stored for accepted events.
The recommended, general principle is:
Start with the data captured via rejected events (counter and process_time), and then add detailed monitoring.
The detailed monitoring involves setting up filters to capture specific events for specific apps and/or app objects and/or engine methods.Also: make sure to have a reasonably short retention period (10-14 days are usually enough) for the InfluxDB database, as the performance log events can generate a lot of data that can easily affect the performance of the InfluxDB instance.
Grafana dashboard examples
High-level monitoring of app performance (rejected events)
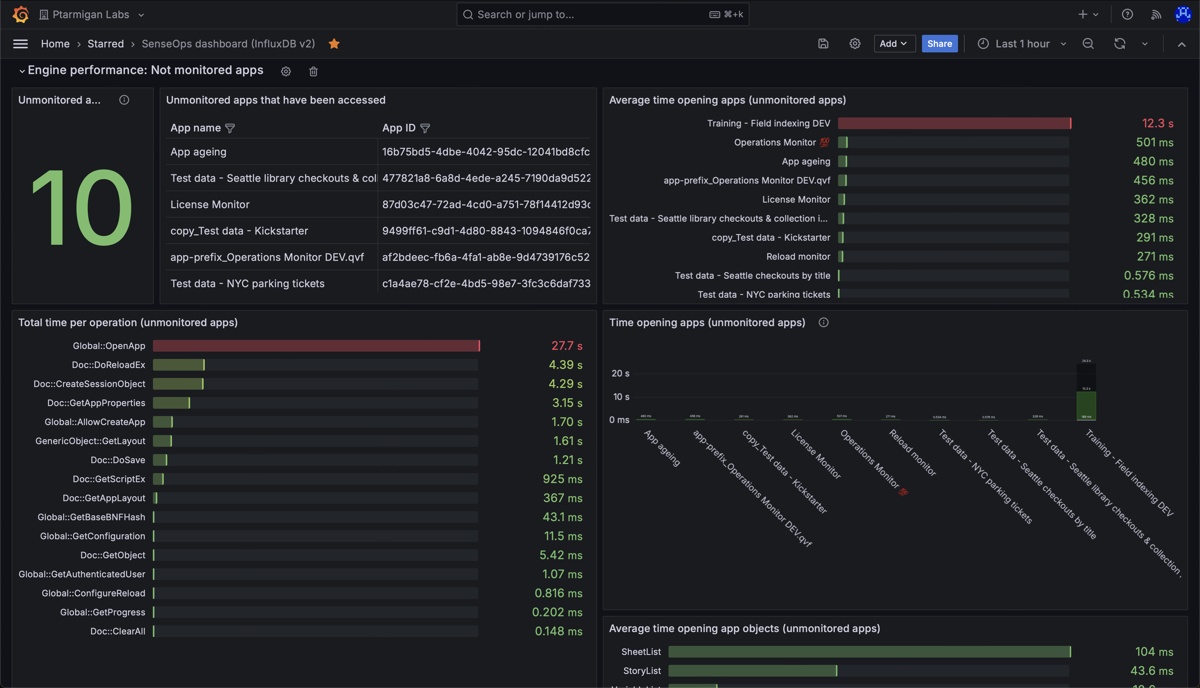
High level metrics (counters and process_time) for apps in a Sense environment.
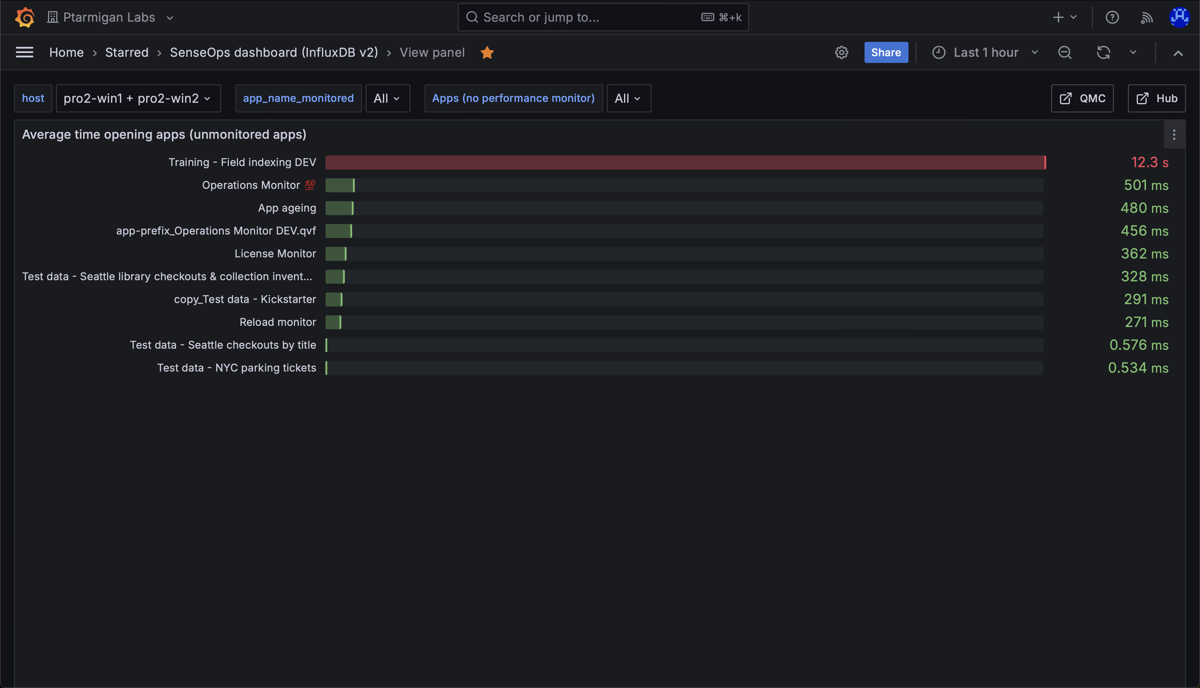
Average time opening apps in a Sense environment. Note the long time for the app "Training - Field indexing DEV".
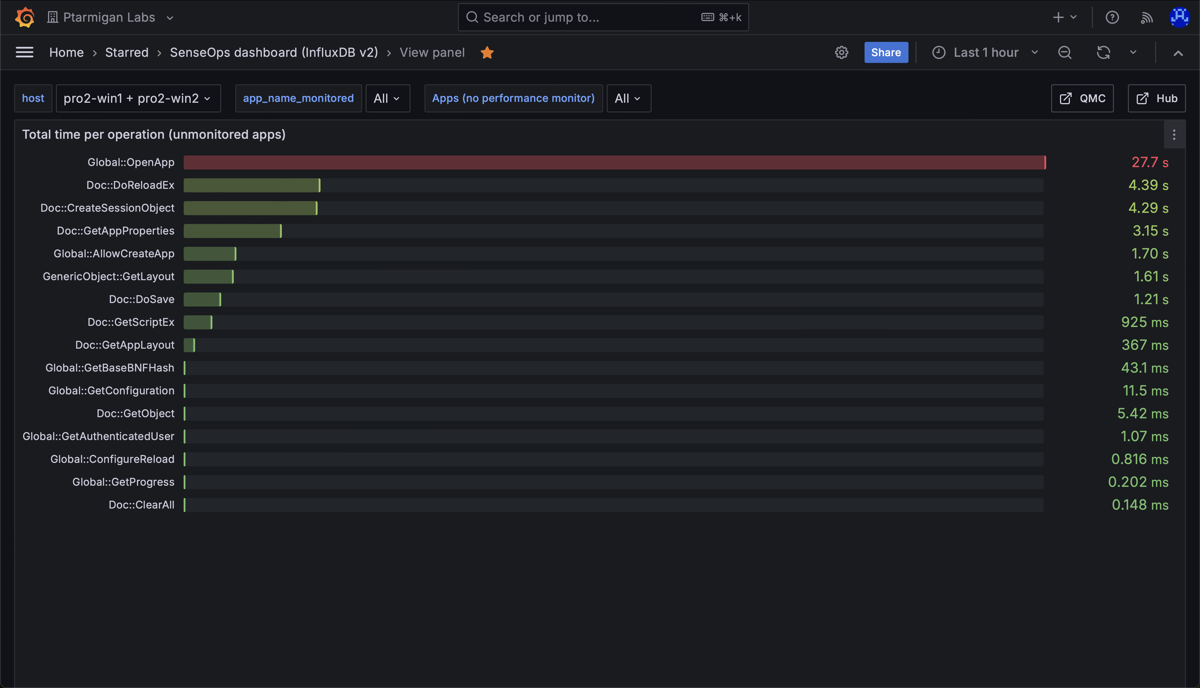
Total time spent on different engine operations, across all apps that were accessed during the selected time interval. Note the long time for the "Global::OpenApp" operation - this comes from one or more apps being slow to open.
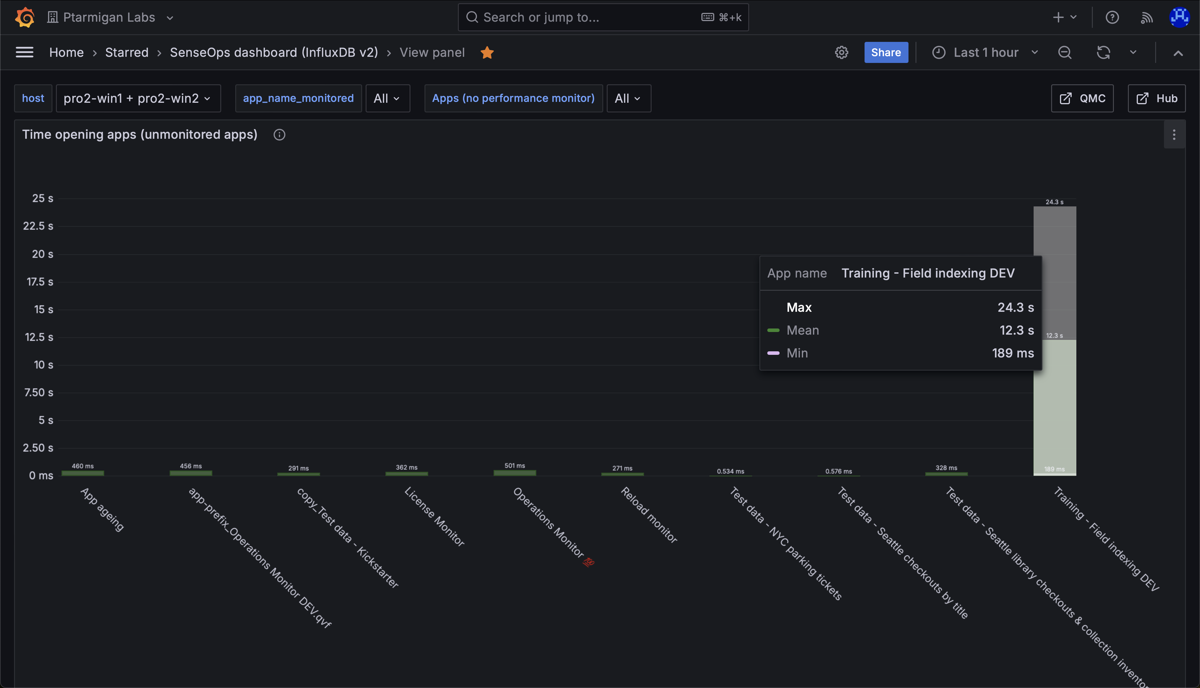
Min, medium and max time spent opening apps in a Sense environment. Here we again see that most apps open quickly, but one app takes a long time to open. We can also see that once that app is in memory, it's fast to open for subsequent users.
Detailed monitoring of app object performance (accepted events)
A large set of metrics are stored for accepted performance log events, the examples below highlight just a few of them.

Detailed performance metrics for app objects in two different Sense apps. "Work time" (upper left) is the time spent by the engine doing the actual work, like calculating chart data after a selection is made by the user.
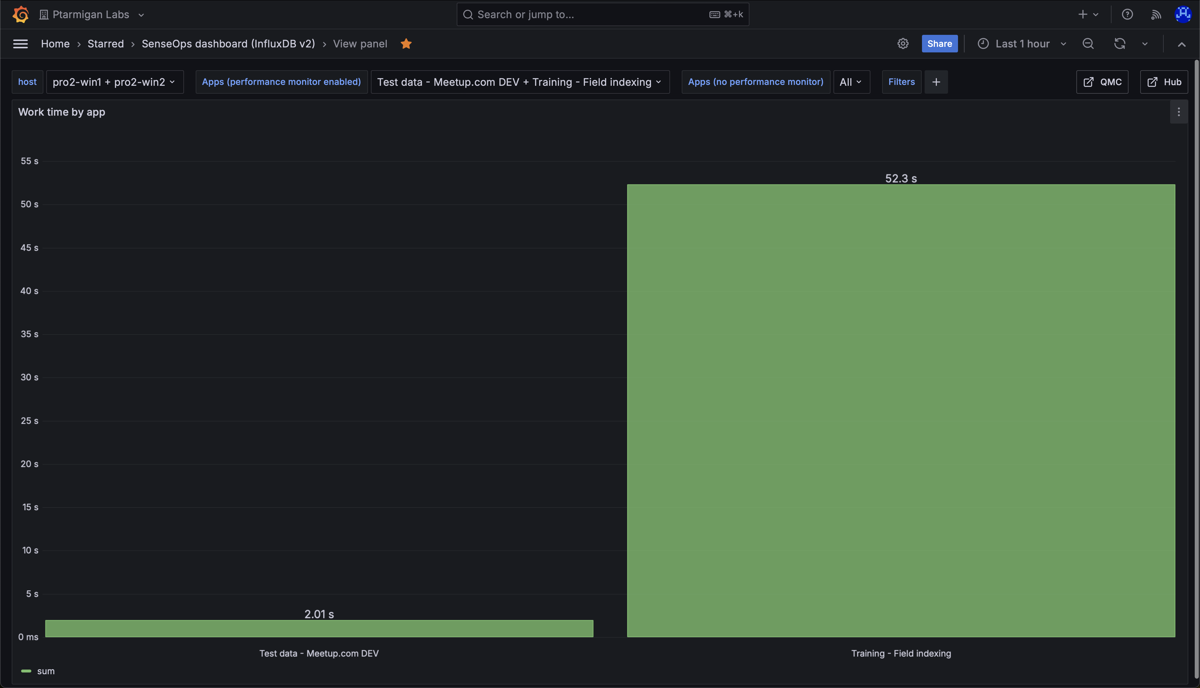
Work time per per app. The chart shows that one app dominates the work time.
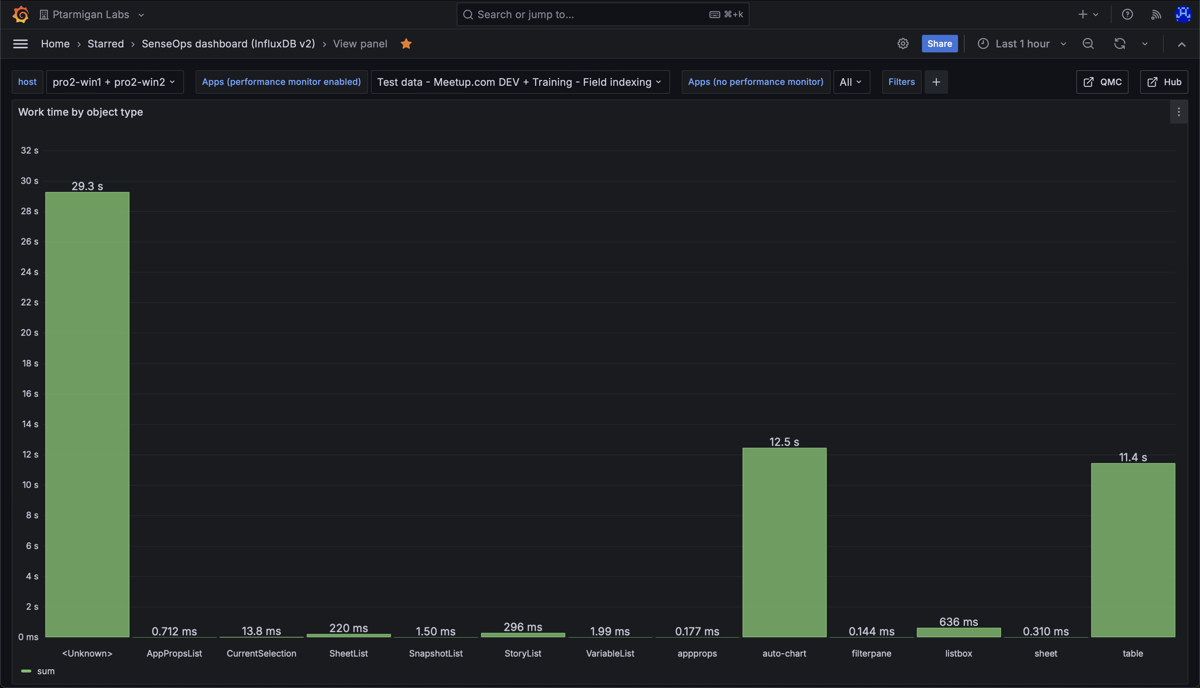
Work time per object type, for all apps accessed during the chosen time interval. The chart shows that "auto-chart" and "table" objects take the most time to calculate. The "
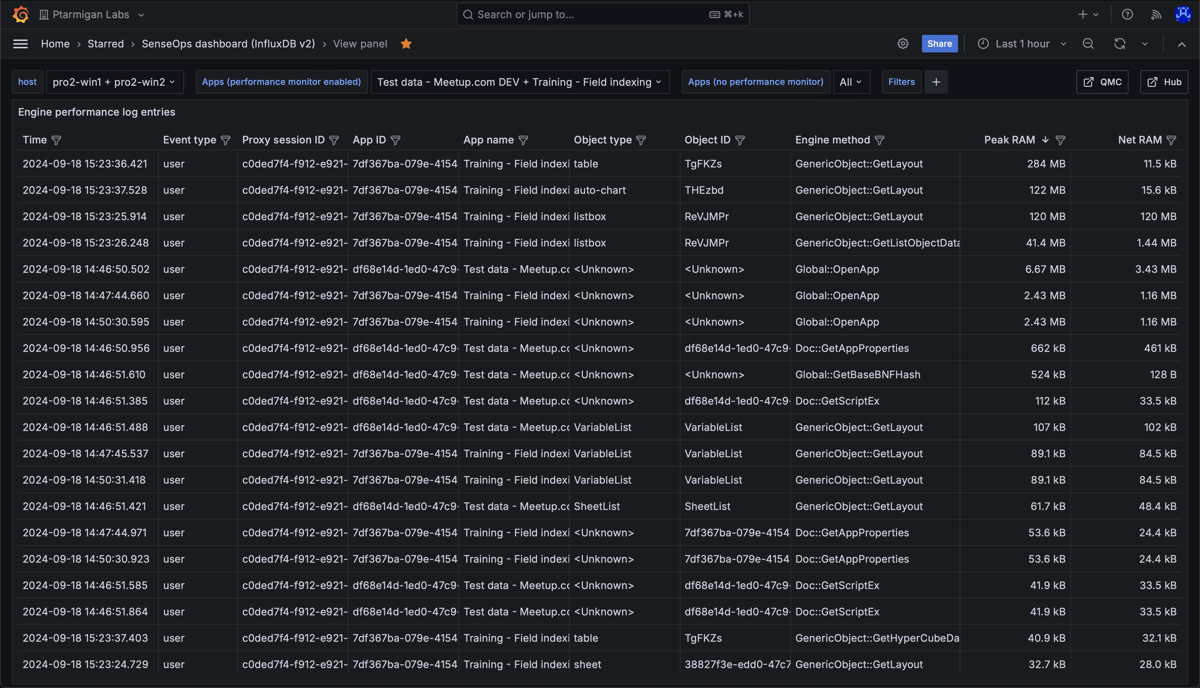
Detailed information about the various engine performance events that have been captured.
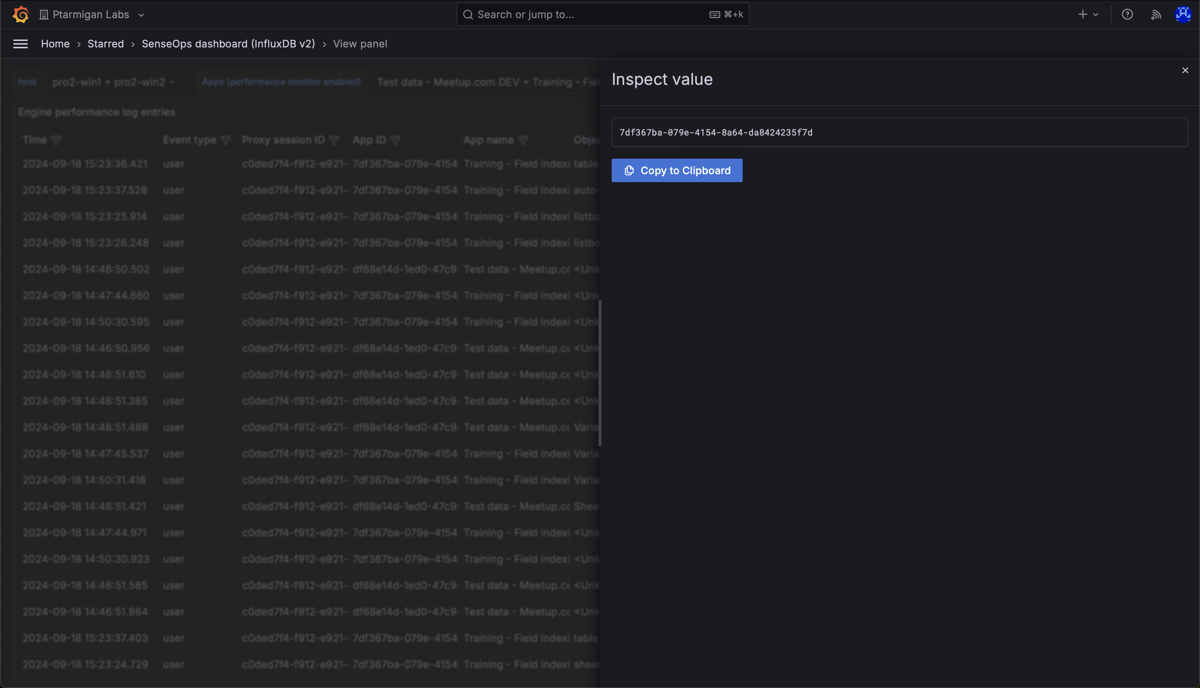
It is possible to inspect any value in the table, and easily copy it to the clipboard.
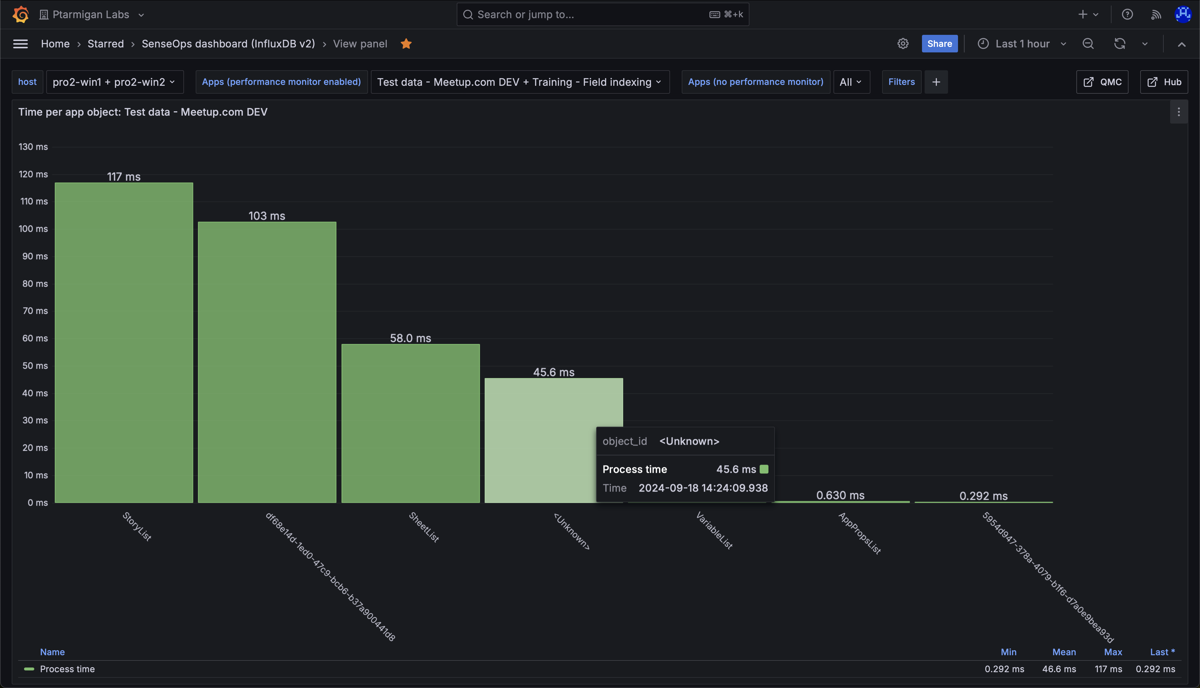
Work time per app object in the "Test data - Meetup.com DEV" app. Nothing stands out as particularly slow.
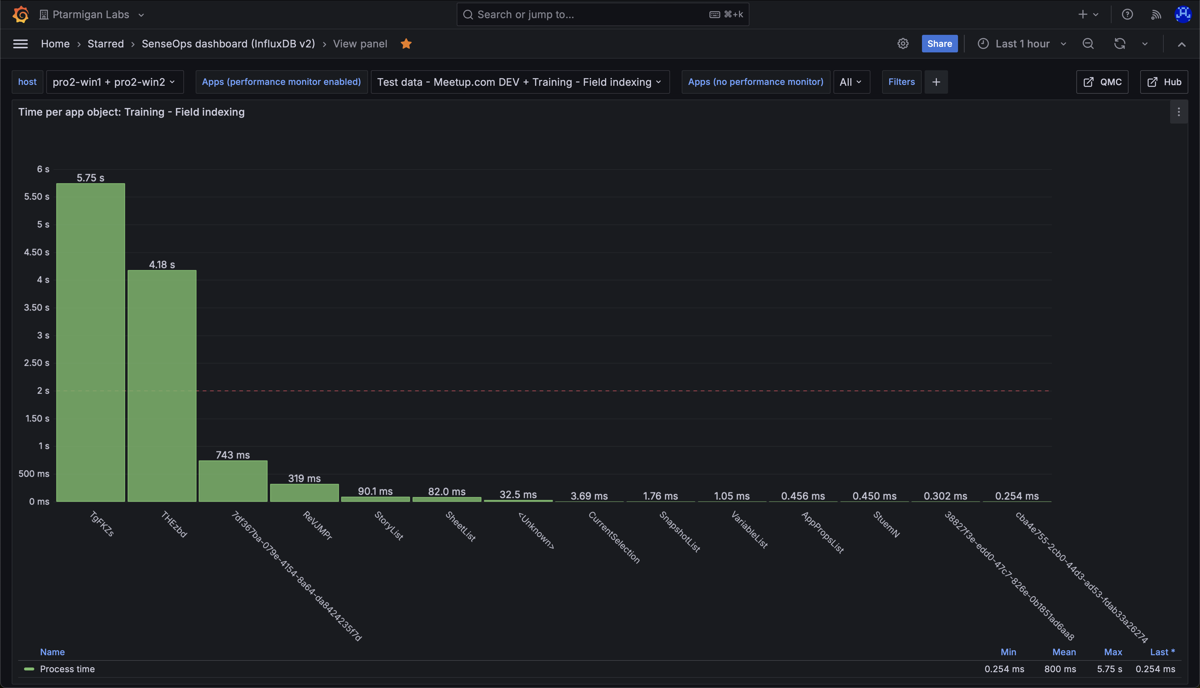
Work time per app object in the "Training - Field indexing" app. The chart shows that two objects take on the order of 5 seconds each to calculate. This is worth investigating.
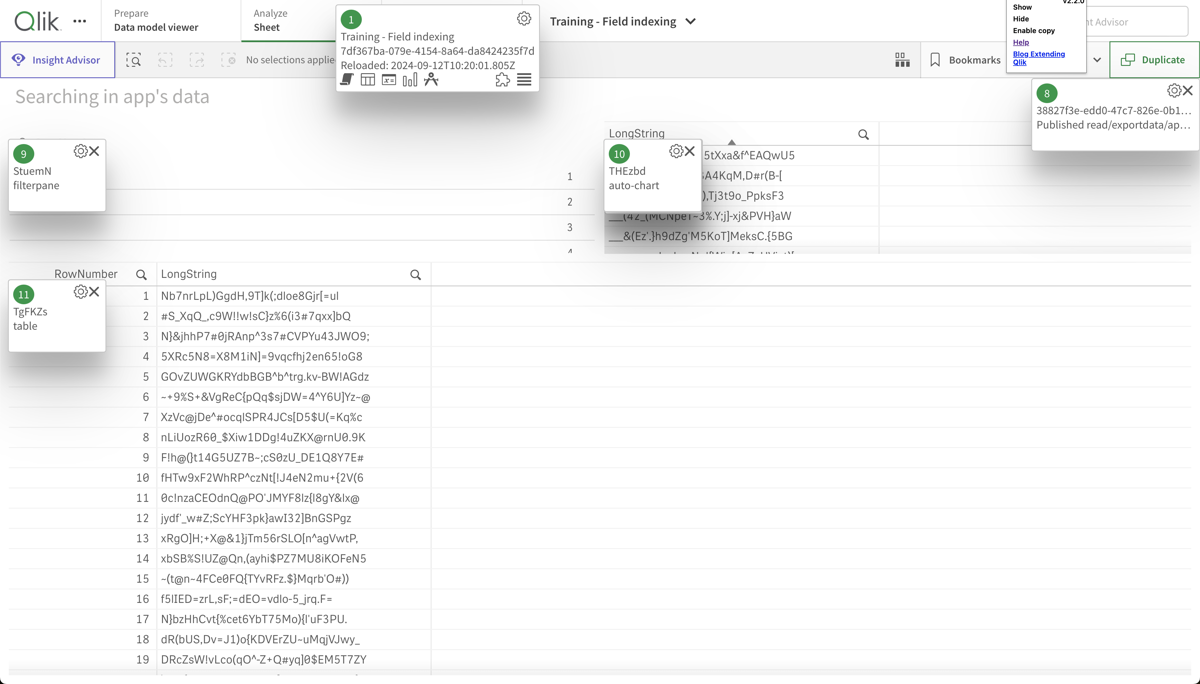
Looking at the app sheet where the two slow objects above are located, we can see that it's two tables, each containing strings with random characters. These are slow to index for the engine after a selection is done by the user (or when first opening the app), causing the high work time.
4 - Visualise Butler SOS config file
Butler SOS has a built-in web server that can be used to visualise the configuration file, either as YAML or JSON.
Sensitive config values can be optionally be obfuscated in the visualization.
What is the current configuration?
When Butler SOS starts up, it reads its configuration from a file.
This file is the source of truth for the Butler SOS configuration, so when in doubt about what Butler SOS is doing, this is the place to look.
The config file can be hard to get to though, especially if Butler SOS is running in a container or on a remote machine.
To make it easier to see what the current configuration is, Butler SOS has a built-in web server that can be used to visualise the configuration file, either as YAML or JSON.
Info
This feature is described in the setup guide, here.