Three levels of log event data
Depending on the needs of the Sense admin, Butler SOS can provide three levels of log event data, ranging from high-level counters to detailed performance data for individual charts in apps.
The most high-level data is the “log event counters”, which can be enabled/disabled independently of the more detailed engine performance events.
The engine performance events are then divided into “rejected” and “accepted” events, with the latter being the most detailed.
It’s usually a good idea to start with the high-level metrics and then enable more detailed metrics if needed.
Info
The counters for top-level metrics and rejected performance log events are reset to zero every time Butler SOS is restarted, as well as every time counter data is sent to InfluxDB.
I.e. the counters are not cumulative over time, but rather show the number of events since the last restart/save.
This makes it easy to create Grafana dashboards that show the number of events during the selected time interval, for example.
Just sum the counter fields in the Grafana chart, and you’re done.
High level: Event counters
Event counters can be enabled independently of engine performance events.
The counters are configured in the Butler-SOS.qlikSenseEvents.eventCount section in the Butler SOS config file.
When enabled, Butler SOS will count the number of log and user events that are received from Qlik Sense via UDP messages.
The counters are split across several dimensions, described in the reference section.
These counters can be used to get a general idea of which servers generate the most log events, which Windows services generate the most events, and so on.
A Grafana dashboard can look like this:
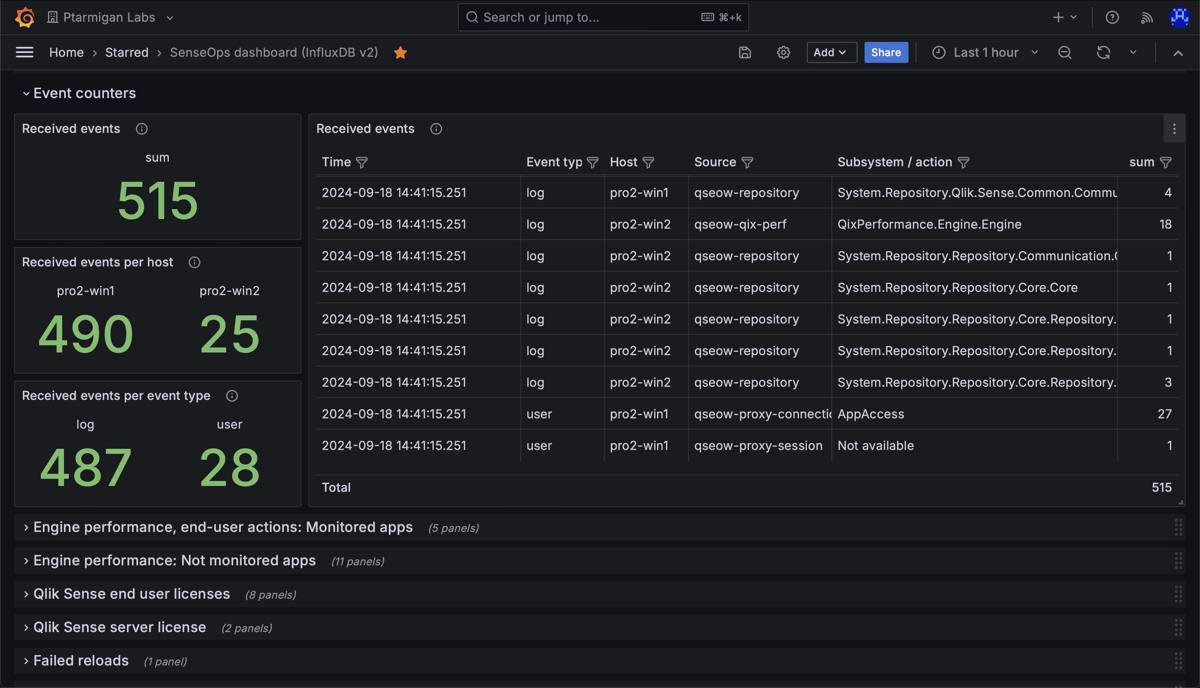
Butler SOS event counter charts in Grafana.
Medium: Rejected performance log events
If an event with source=qseow-qix-perf does not meet the include filter criteria in the config file, it is considered a “rejected” event.
For rejected events a set of counters are kept, broken down by dimensions described in the reference section.
As both app id/name and the engine method (for example Global::OpenApp) are included as a dimension in the InfluxDB data, it’s possible to create Grafana dashboards that show how long time each app takes to open.
A Grafana dashboard can look like this:
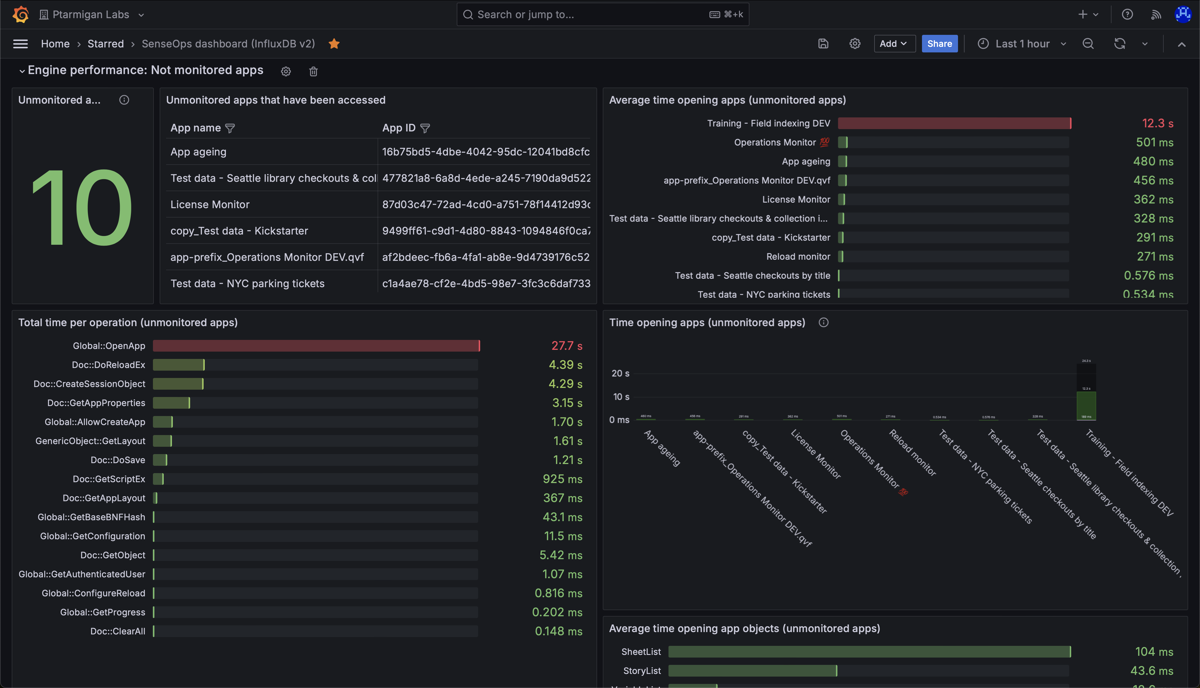
Butler SOS rejected performance log events dashboard in Grafana.
In the upper right chart above we can see that all apps except one open quickly.
Might be a good idea to investigate why the app “Training - Field indexing DEV” takes so long to open.
More Grafana examples here.
Detailed: Accepted performance log events
If an event with source=qseow-qix-perf does meet the include filter criteria in the config file, it is considered an “accepted” event.
All accepted events will result in a set of detailed performance metrics being stored in InfluxDB.
The metrics are described in the reference section.
An example Grafana dashboard can look like this:
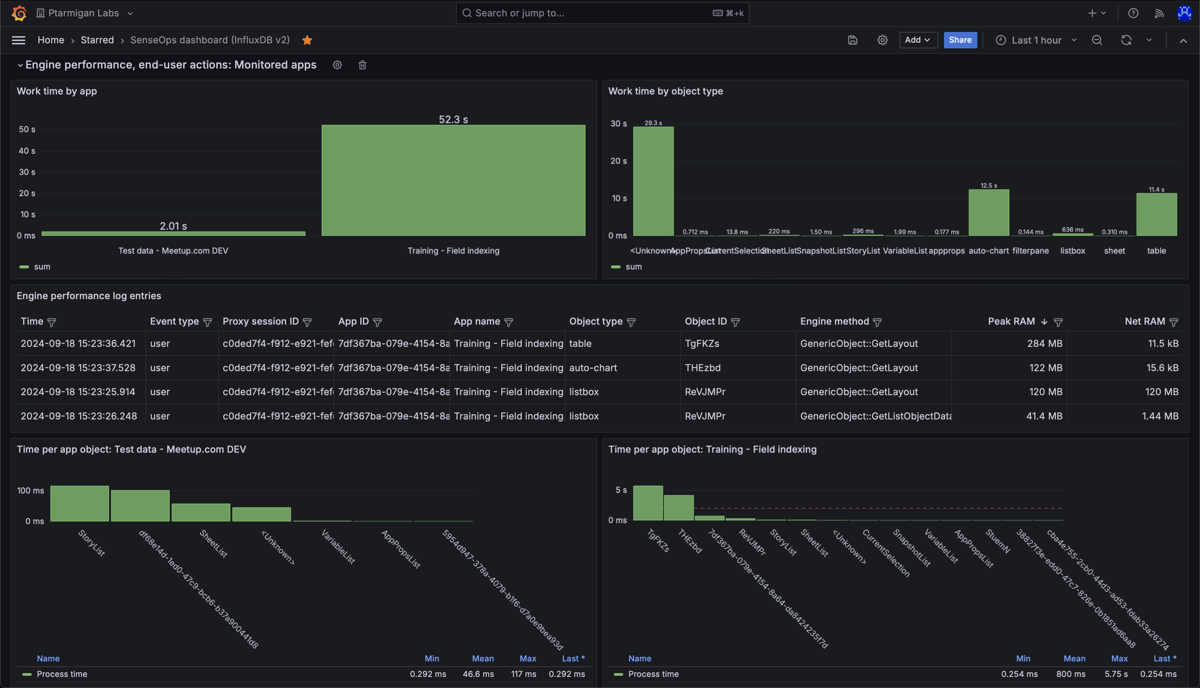
Butler SOS accepted performance log events dashboard in Grafana.
The upper left chart shows total “work time” per app, during the selected time interval.
Work time is the time it takes for the engine to do the actual work, like calculating the chart data after a selection is made by the user.
The chart shows that the app “Training - Field indexing” has a high work time.
This does not have to be a problem, but it’s worth investigating why the number is so high.
The bottom two charts show the work time per chart object, per app.
The chart tells us that two app objects take on the order of 5 seconds each to calculate.
Which objects are these?
Open the app in Chrome and use the “Add Sense for Chrome” extension to find out.
Turns out it’s the two tables (object 10 and 11) that take a long time to update - that’s expected (but not ideal!) as they contain a lot of complex data that takes time to index.
If the update times get even longer, it might be a good idea to look into the data model and see if it can be optimized.
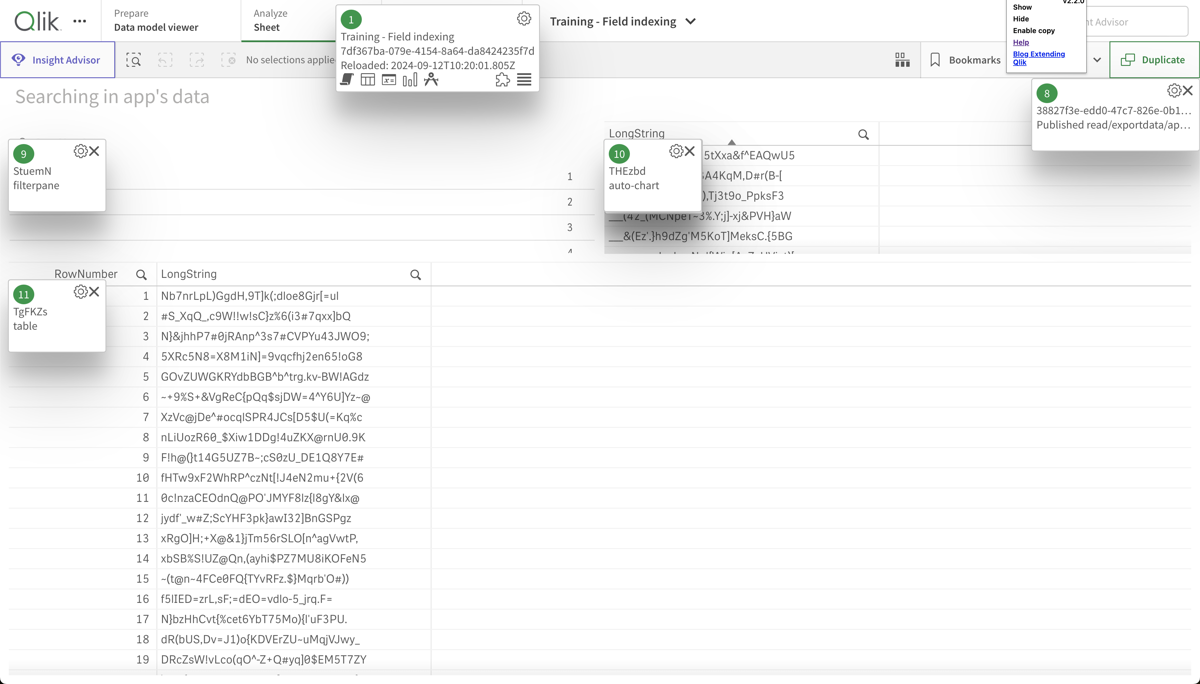
The "Add Sense for Chrome" extension showing the object ID for objects on a sheet.