Knowing is better than guessing
Monitoring a Qlik Sense environment - or any system - comes down to knowing what’s going on.
If you don’t know what’s going on, you’re guessing.
And if you’re guessing, you’re not in control.
If you’re not in control, well - that’s a bad place to be..
Qlik’s performance analysis apps
Qlik has a couple of apps that can be used to analyze performance data from Qlik Sense Enterprise on Windows.
First, the Operations Monitor app ships with every instance of Qlik Sense Enterprise on Windows.
This app is the go-to tool for retrospective analysis of what’s going on in a Sense environment.
The app puts all the great features of Qlik Sense to good use on top of the Sense logs it has access to.
What apps were reloaded when, which reload tasks failed most, which users are most active, etc.
Then there’s the Telemetry Dashboard app.
It uses the same data as Butler SOS, but as it’s a Sense app it must be reloaded in order to get updated data.
Butler SOS on the other hand uses real-time delivery of the events from Sense’s Log4Net logging framework.
If you want to do retrospective analysis of detailed performance data, the Telemetry Dashboard app is an excellent choice.
This page provides additional info about the telemetry logging available in Qlik Sense.
Info
Qlik’s Telemetry Dashboard app requires you to enable performance logging for the Engine service in the QMC.
The effect is that you get a new set of Sense log files that are likely to quickly become BIG.
By using Butler SOS you can get the same metrics and insights, but without the need to enable performance logging in the QMC.
I.e. saving disk space and getting real-time data instead of data that’s hours or days old.
Which is better? That depends on your use case and what you want to achieve.
Lots of use cases
Categorization of events can be done in different ways depending on what you want to achieve.
Here are some examples of what can be done using Butler SOS:
- You want high level insights into how long various app actions take for all apps.
- Turn on engine performance monitoring in general, but no need for app details
- Enable tracking of rejected performance log events. This will capture high-level metrics (such as time used and number of events) for all methods/commands used in the engine.
- Create a Grafana dashboard that shows the average time taken for each method/command.
- 🎉 You get immediate, visual insight into how fast (or slow) apps open.
- Users complain about an app being slow to open.
- Turn on performance logging for app open events from that particular app. Store data in InfluxDB.
- Create a Grafana dashboard that shows a histogram of app open times for that app.
- 🎉 You get hard numbers on how long the app usually takes to often, and what the outliers are.
- A certain chart is slow to update.
- Turn on performance logging for that specific app and chart. Store data in InfluxDB.
- Create a Grafana dashboard that shows a histogram of chart update times for that chart. Or add a new chart to an existing dashboard.
- Define alerts in Grafana so you get notified if rendering time for the chart exceeds some threshold.
- Use Butler SOS’ user events features to keep track of what users access the app when the chart is slow.
- 🎉 You know in real-time how many and which users were impacted, and get a notification when it happens.
- You suspect that an app has a poorly designed data model.
- Enable detailed performance monitoring for that specific app
- Create a Grafana dashboard that
- tracks the “traverse_time” metric. This metric shows how long it takes to traverse the data model. A poorly designed data model tend to have longer traverse times. Break it down by app object and proxy session.
- tracks the render time for each chart and table in the app. Slow charts and tables may be caused by a bad data model, but not always. Lots of (complex) data may also be a reason.
- 🎉 You get real-time insight into which objects are slow for what users, due to a bad data model in that specific app.
Performance log events
A “performance log event” is a log event that originates from the Qlik Sense engine, more specifically from the “QixPerformance.Engine.Engine” subsystem.
They are sent to Butler SOS as UDP messages, just like regular log events (using the same port).
The performance log events have INFO log level in the Sense logs but still provide very detailed information about what the engine is doing.
Warning
The XML appender files that ship with Butler SOS don’t do any filtering of log events.
This means that all events from the “QixPerformance.Engine.Engine” subsystem are sent to Butler SOS, regardless of what they are about.
The filtering is then done (if configured) by Butler SOS.
For large Sense environments, there can therefore be a lot of UDP messages sent to Butler SOS.
This is usually not a problem, but at some point Butler SOS may become overwhelmed and start dropping messages.
Use the log message counter feature in Butler SOS to keep track of how many messages are received - this can be a good indicator of how close Butler SOS is to its limits.
Accepted vs rejected performance log events
Due to the potential high volume of performance log events sent by Qlik Sense, Butler SOS has a filtering feature that can be used to only store the events that are of interest.
Events that meet the filtering criteria are called “accepted” events, and events that don’t are “rejected” events.
Accepted events are stored in InfluxDB, including detailed performance metrics for the event.
Details on what is stored for accepted events can be found in the reference section.
Rejected events are not stored in InfluxDB, but are still counted by Butler SOS.
This feature can be enabled/disabled in the Butler SOS config file. More info here.
Data available for accepted and rejected events
The full set of data stored for accepted events is described in the reference section.
Suggested workflows for different use cases
For some use high-level cases, such as identifying apps that are slow to load, the data for rejected events may be sufficient.
Other uses cases, such as monitoring the behavior of specific app objects (charts, tables etc), require the detailed data stored for accepted events.
The recommended, general principle is:
Start with the data captured via rejected events (counter and process_time), and then add detailed monitoring.
The detailed monitoring involves setting up filters to capture specific events for specific apps and/or app objects and/or engine methods.Also: make sure to have a reasonably short retention period (10-14 days are usually enough) for the InfluxDB database, as the performance log events can generate a lot of data that can easily affect the performance of the InfluxDB instance.
Grafana dashboard examples
High-level monitoring of app performance (rejected events)
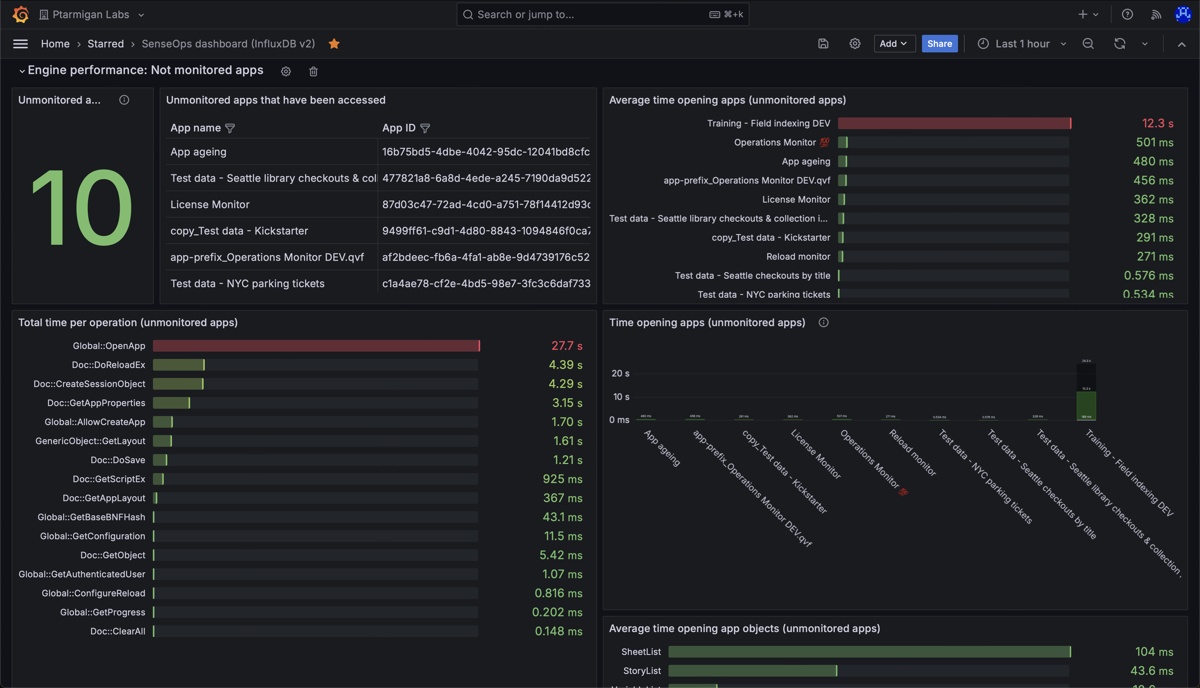
High level metrics (counters and process_time) for apps in a Sense environment.
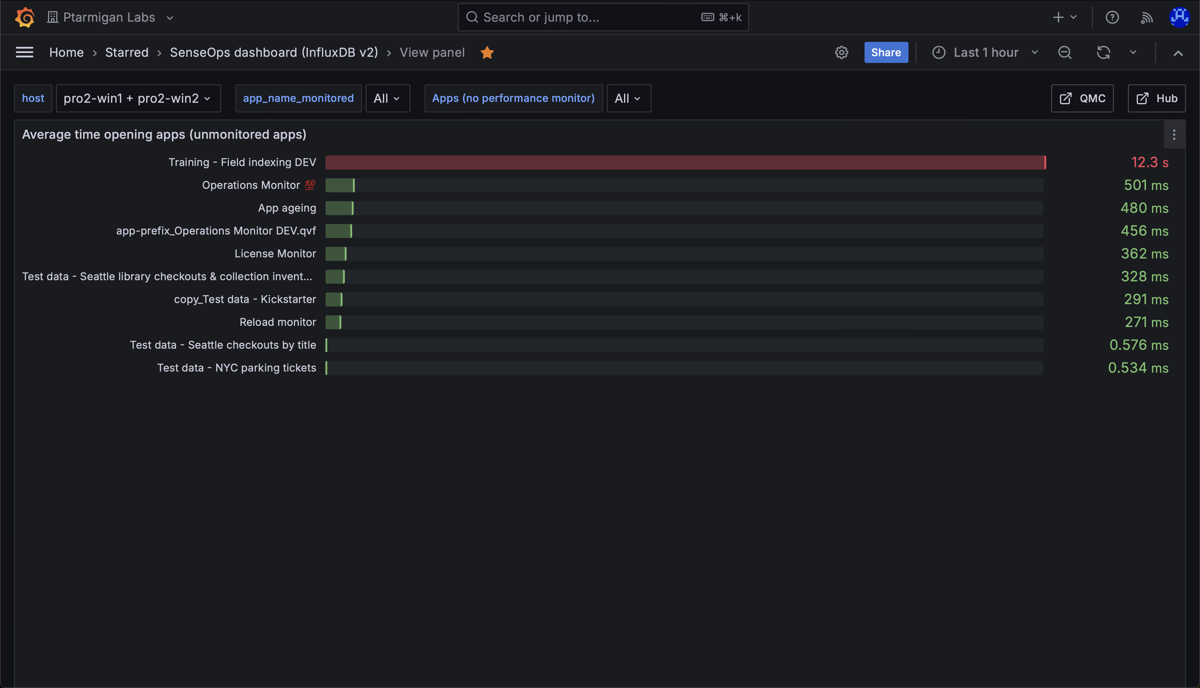
Average time opening apps in a Sense environment. Note the long time for the app "Training - Field indexing DEV".
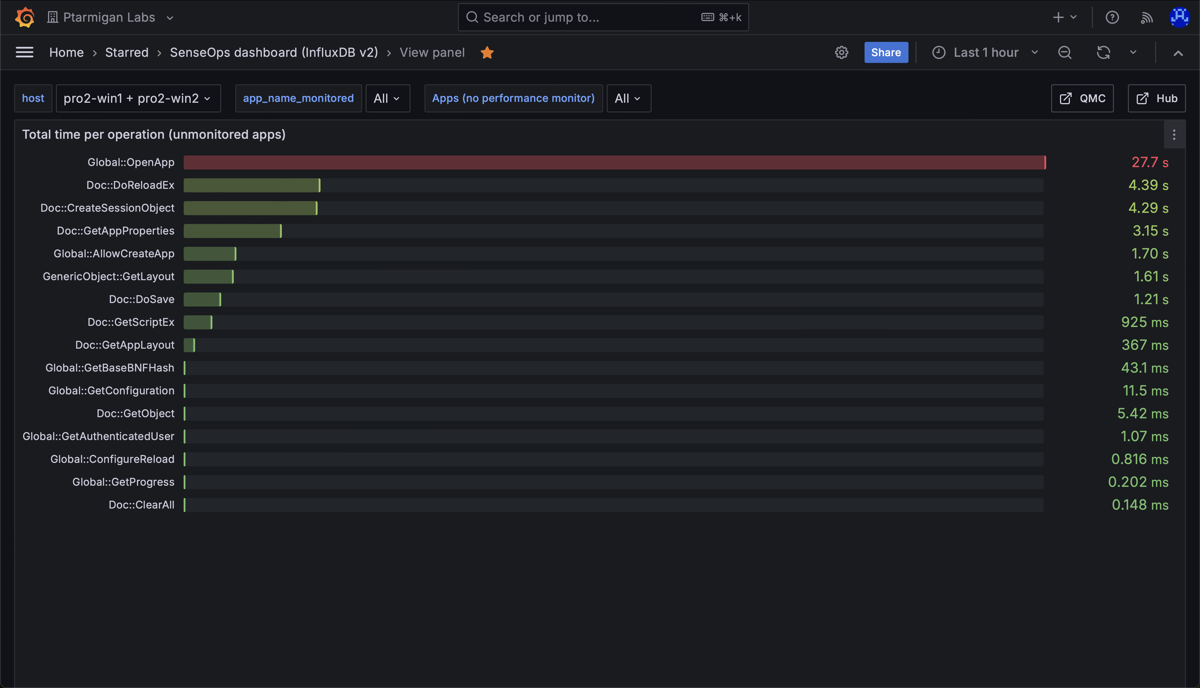
Total time spent on different engine operations, across all apps that were accessed during the selected time interval. Note the long time for the "Global::OpenApp" operation - this comes from one or more apps being slow to open.
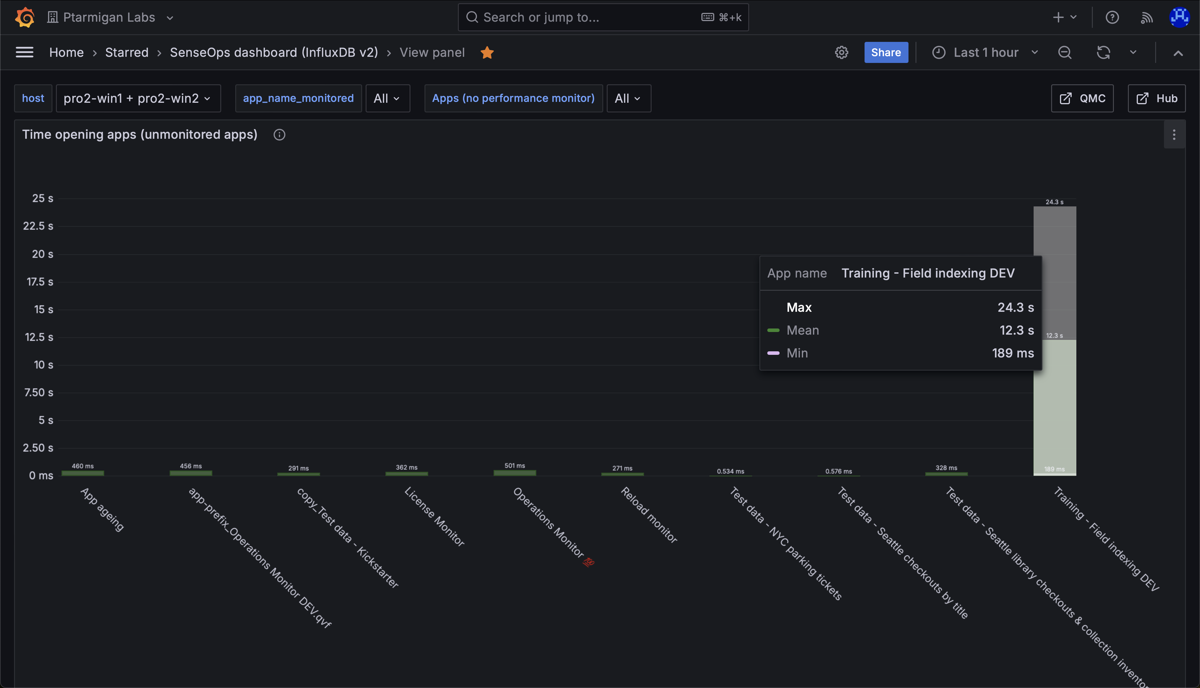
Min, medium and max time spent opening apps in a Sense environment. Here we again see that most apps open quickly, but one app takes a long time to open. We can also see that once that app is in memory, it's fast to open for subsequent users.
Detailed monitoring of app object performance (accepted events)
A large set of metrics are stored for accepted performance log events, the examples below highlight just a few of them.
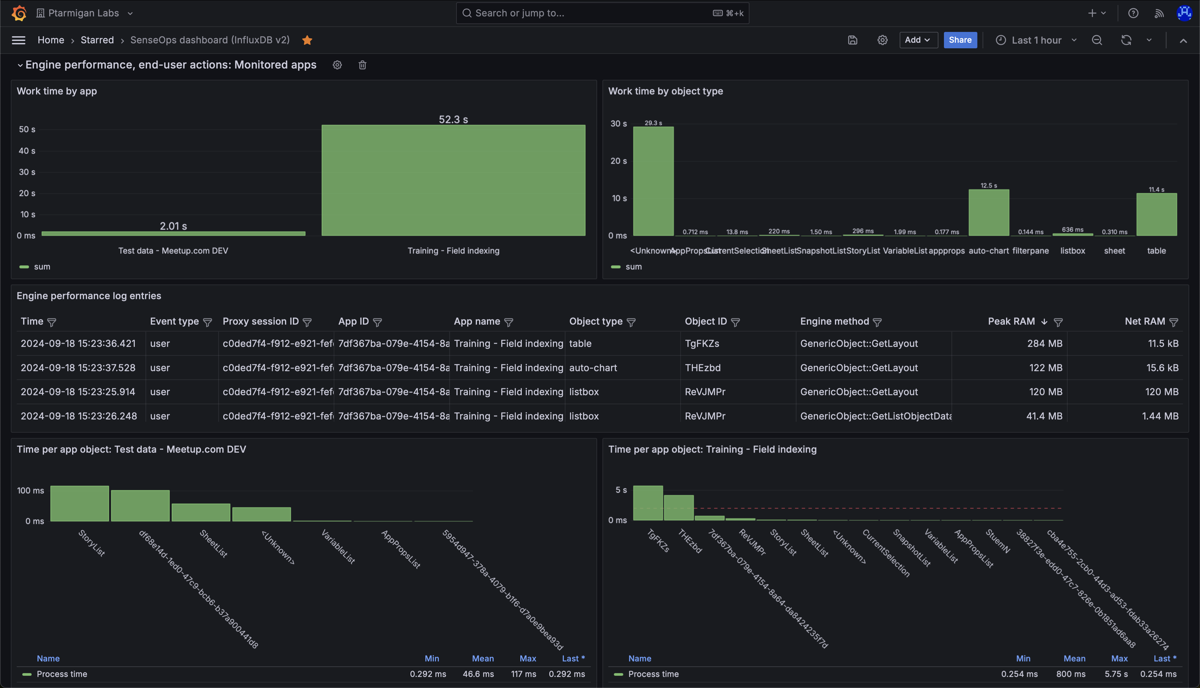
Detailed performance metrics for app objects in two different Sense apps. "Work time" (upper left) is the time spent by the engine doing the actual work, like calculating chart data after a selection is made by the user.
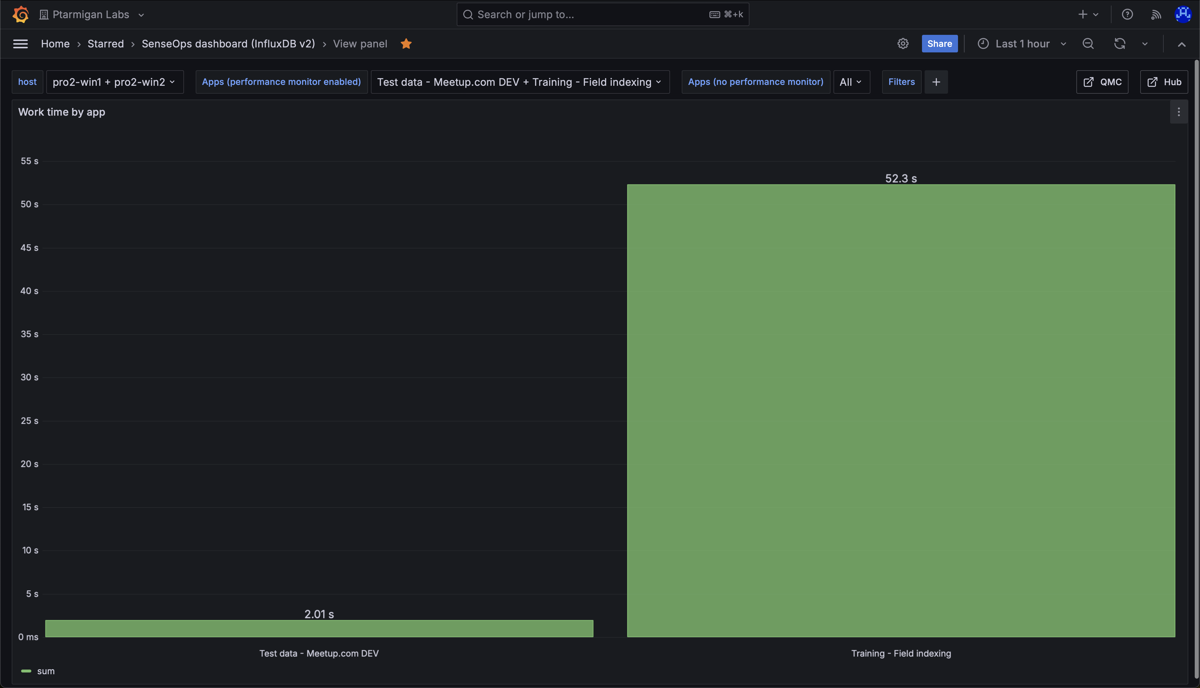
Work time per per app. The chart shows that one app dominates the work time.
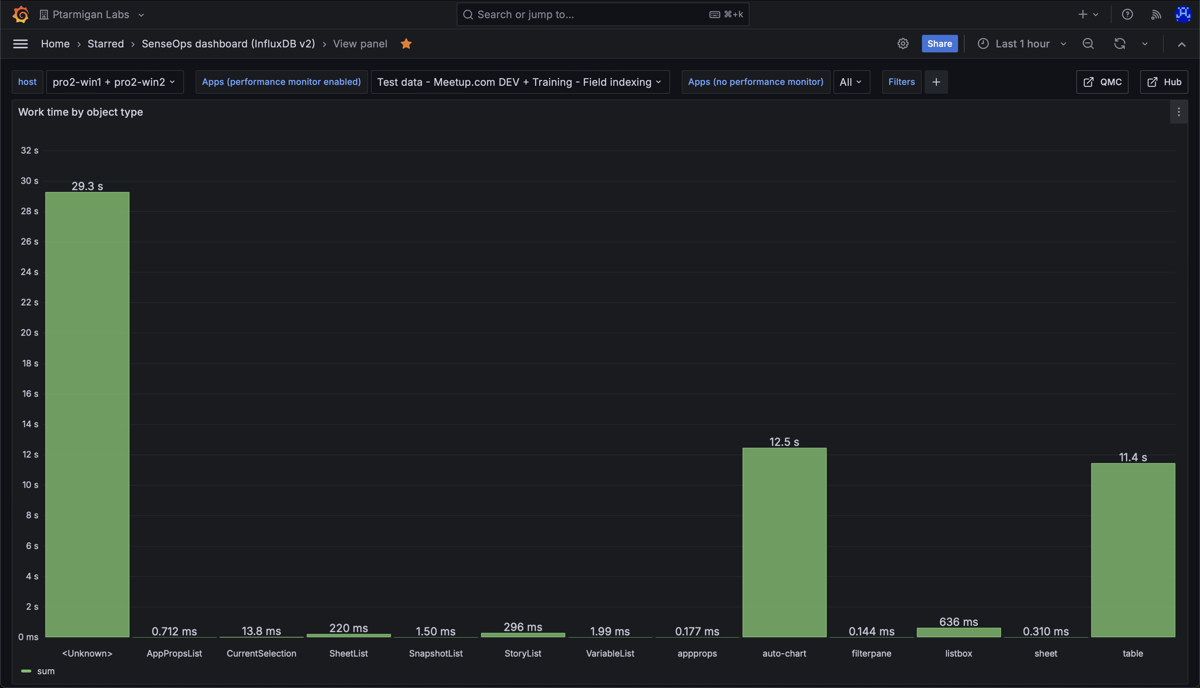
Work time per object type, for all apps accessed during the chosen time interval. The chart shows that "auto-chart" and "table" objects take the most time to calculate. The "
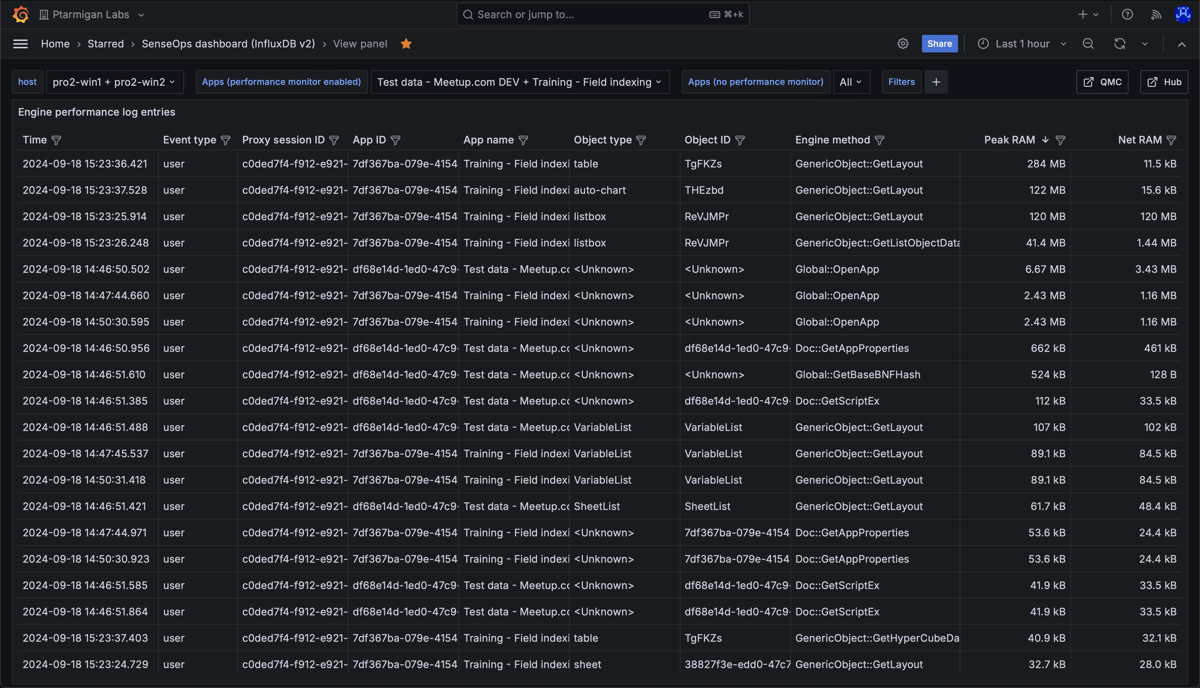
Detailed information about the various engine performance events that have been captured.
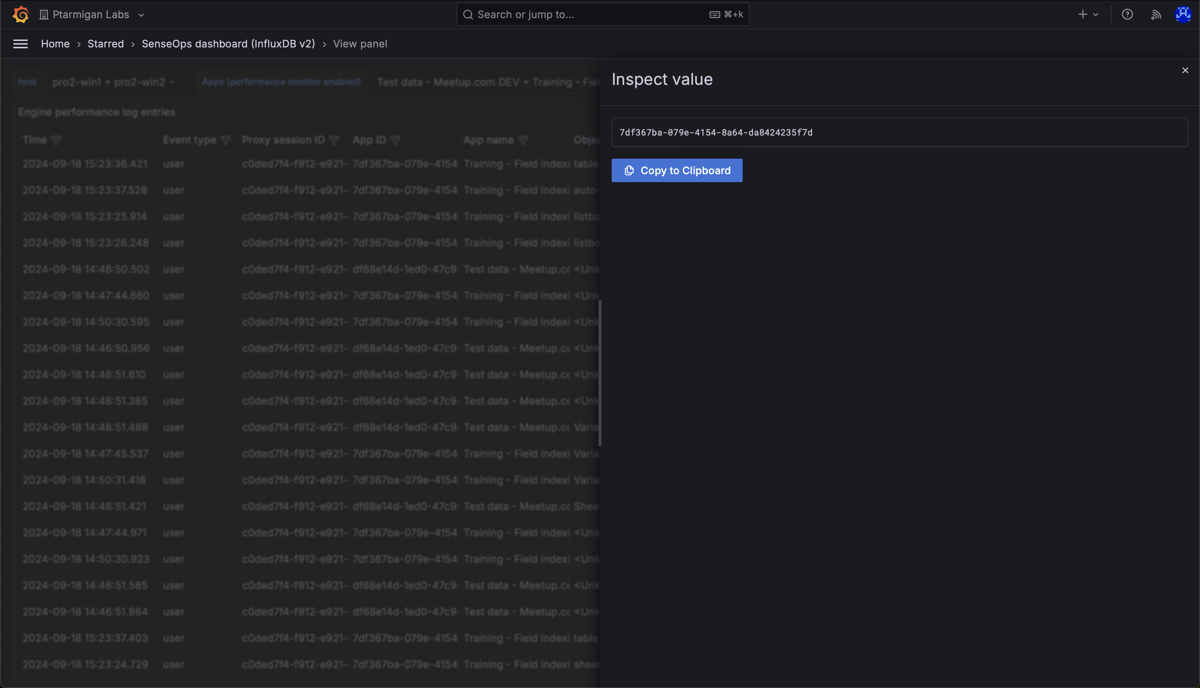
It is possible to inspect any value in the table, and easily copy it to the clipboard.
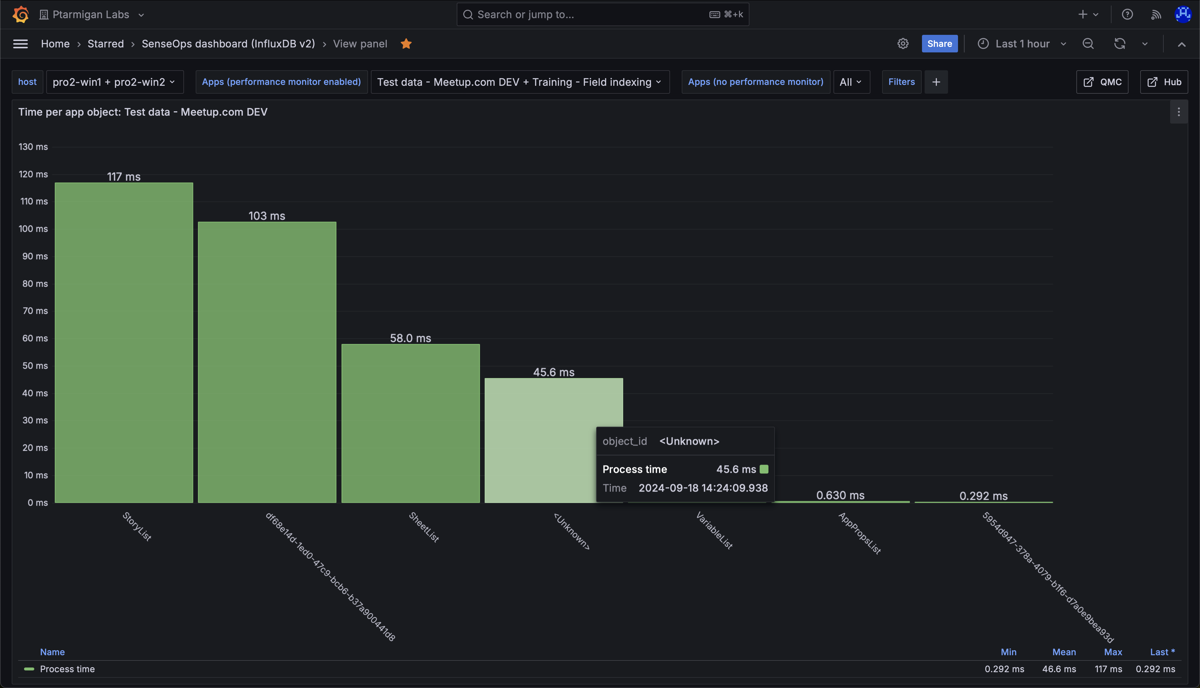
Work time per app object in the "Test data - Meetup.com DEV" app. Nothing stands out as particularly slow.
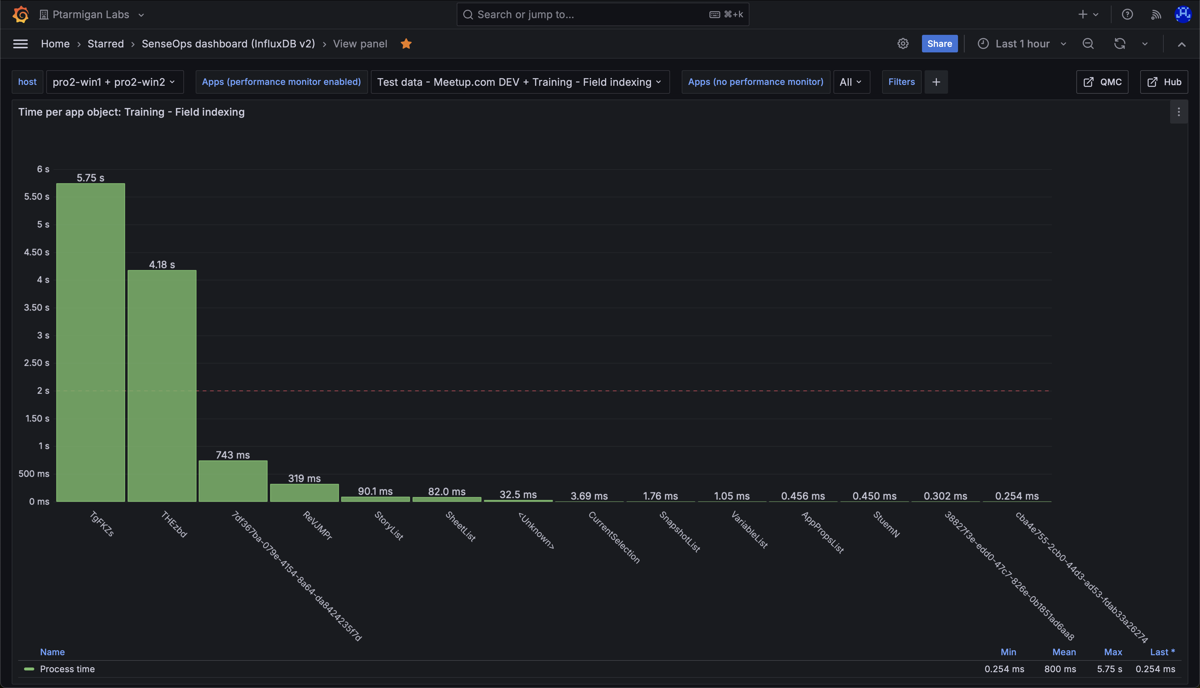
Work time per app object in the "Training - Field indexing" app. The chart shows that two objects take on the order of 5 seconds each to calculate. This is worth investigating.
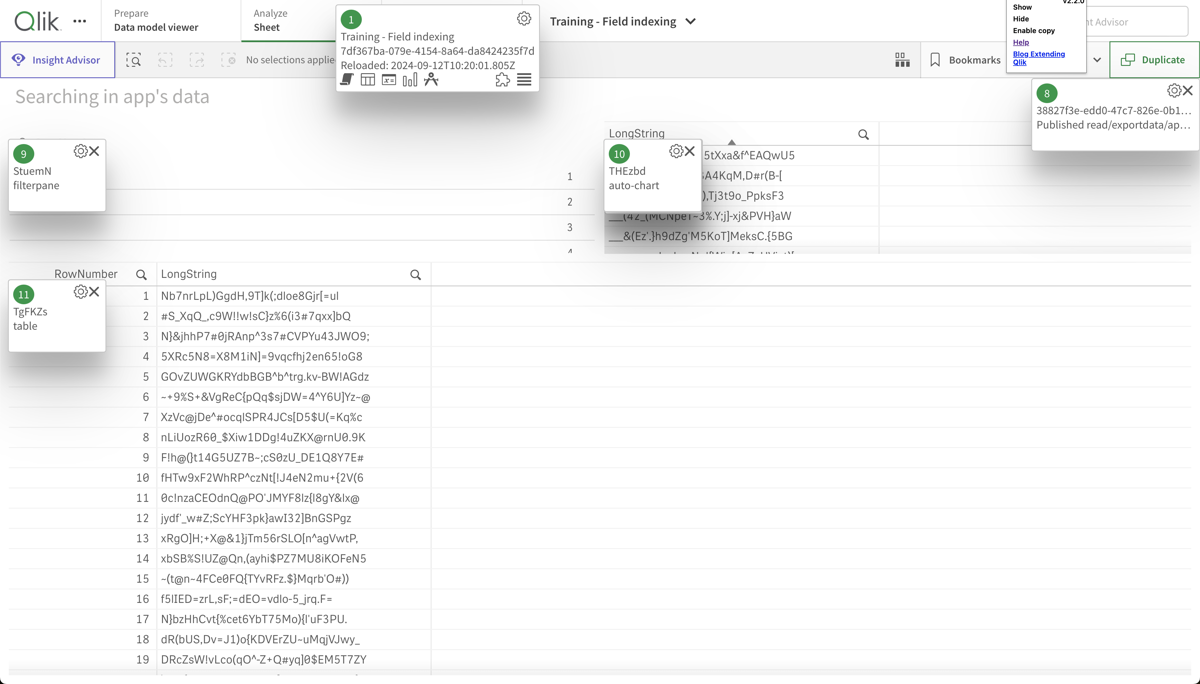
Looking at the app sheet where the two slow objects above are located, we can see that it's two tables, each containing strings with random characters. These are slow to index for the engine after a selection is done by the user (or when first opening the app), causing the high work time.